
Figure 4. Kaplan-Meier survival analysis.
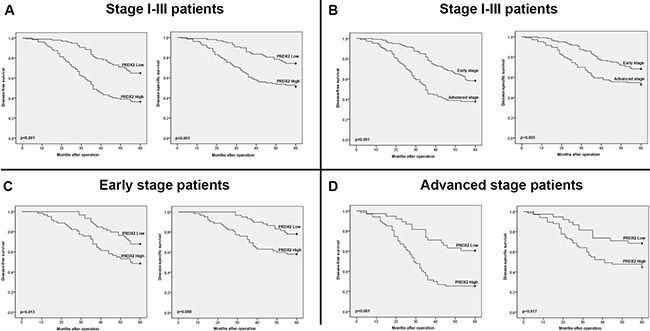
(A) Kaplan-Meier curves for disease-free survival and disease-specific survival of stage I-III CRC patients in the study cohort according to PRDX2 expression status (high or low expression). (B) Kaplan-Meier curves for disease-free survival and disease-specific survival of stage I-III CRC patients in the study cohort according to TNM stage (TNMI - II stage or TNMIII stage). (C) Kaplan-Meier curves for disease-free survival and disease-specific survival of CRC patients with early stage (stage I-II) tumors in the study cohort according to PRDX2 expression status (high or low expression). (D) Kaplan-Meier curves for disease-free survival and disease-specific survival of CRC patients with advanced stage (stage III) tumors in the study cohort according to PRDX2 expression status (high or low expression). The p-value was determined using the log-rank test.