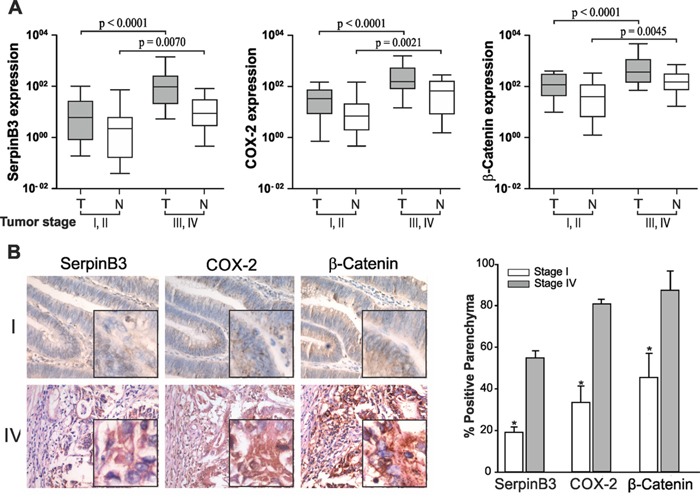
Figure 2. Correlation between SerpinB3, COX-2, β-Catenin expression and tumor stage.

A. Quantitative Real-Time PCR analysis of SerpinB3, COX-2 and β-Catenin expression levels in different tumor stages. Tumor (T) and non tumor (N) samples of early (I and II) and advanced (III and IV) tumor stages were analyzed using the Mann-Whitney test. Boxes and whiskers represent 25th to 75th and 5th to 95th percentiles, respectively; the median value is represented by the central line in each box and the range of values of all samples is represented by vertical bars. B. Immunohistochemical staining for SerpinB3, COX-2 and β-Catenin obtained in serial sections of a stage I and of a stage IV samples. In stage IV nuclear and cytoplasm positivity of SerpinB3 protein was detectable in a large number of cells, while in stage I only a small number of cells showed low level of expression. COX-2 was strongly positive in the cytoplasm and in the perinuclear area of stage IV tumor and the highest reactivity was found at the bottom of the crypts, decreasing along the longitudinal axis to the luminal region. A similar result was obtained for β-Catenin. Magnifications: 200 X, inserts 400X. In the right panel, graphical representation of the quantitative analysis of each staining has been provided. The average sum of intensities and stained area percentage of each patient was calculated using JmageJ software. Values are the mean ± SD (bar) of 10 different images analyzed [*p<0.001, Low vs High].
