

Abstract
Background: In classical homocystinuria (HCU, MIM# 236200) due to the deficiency of cystathionine β-synthase (EC 4.2.1.22) there is a clear evidence for the success of early treatment. The aim of this study was to develop and evaluate a two-tier strategy for HCU newborn screening.
Methods: We reevaluated data from our newborn screening programme for Qatar in a total number of 125,047 neonates including 30 confirmed HCU patients. Our hitherto existing screening strategy includes homocysteine (Hcy) measurements in every child, resulting in a unique dataset for evaluation of two-tier strategies. Reevaluation included methionine (Met) levels, Met to phenylalanine (Phe) ratio, and Hcy. Four HCU cases identified after database closure were also included in the evaluation. In addition, dried blood spot samples selected by Met values >P97 in the newborn screening programs in Austria, Australia, the Netherlands, and Taiwan were analyzed for Hcy.
Results: Met to Phe ratio was found to be more effective for first sieve than Met, sorting out nearly 90% of normal samples. Only 10% of the samples would have to be processed by second-tier measurement of Hcy in dried blood spots. As no patient with HCU was found neither in the samples investigated for HCU, nor by clinical diagnosis in the other countries, the generalization of our two-tier strategy could only be tested indirectly.
Conclusion: The finally derived two-tier algorithm using Met to Phe ratio as first- and Hcy as second-tier requires 10% first-tier positives to be transferred to Hcy measurement, resulting in 100% sensitivity and specificity in HCU newborn screening.
Electronic supplementary material
The online version of this chapter (doi:10.1007/8904_2016_556) contains supplementary material, which is available to authorized users.
Keywords: Classical homocystinuria, Cystathionine β-synthase, Dried blood spots, Homocysteine, Newborn screening, Two-tier strategy
Introduction
Homocystinuria (HCU, MIM# 236200) is an autosomal recessive disorder usually caused by deficiency of cystathionine β-synthase (CBS, EC 4.2.1.22, Mudd et al. 1964), leading to highly increased plasma and urine concentrations of homocysteine (Hcy) as well as increased levels of plasma methionine (Met). Clinical symptoms in untreated or late treated patients include Marfan-like appearance, progressive myopia and lens dislocation, thromboembolism, epilepsy, and mental retardation (Mudd et al. 1964, 2001). Early treatment with high doses of pyridoxine and/or methionine restriction combined with betaine administration has proven to be effective in preventing many complications of this disease (Mudd et al. 1964, 2001).
There is considerable evidence that early detection and treatment can prevent the clinical consequences of the enzyme deficiency; therefore, newborn screening for the disorder has been advocated (American College of Medical Genetics Newborn Screening Expert Group 2006; Schulze et al. 2009). HCU leads to hypermethioninemia as an additional metabolic marker (Huemer et al. 2015; Wong et al. 2016, Region 4 Stork [R4S] collaborated website, http://www.clir-r4s.org). Newborn screening for HCU by measurement of Met in dried blood spots (DBS) is being performed in some countries but has poor sensitivity. In Ireland, 4 of 25 cases were missed, including one pyridoxine-responsive patient. The false negative-screening in the other three cases might be attributed to breast-feeding, due to low Met concentrations in breast milk and some infant formulas (Naughten et al. 1998). It is likely that pyridoxine-responsive patients, which account for about half of all CBS-deficiency cases, are not detected by measurement of methionine in neonates; there is no substantiated report of such detection (Huemer et al. 2015).
Based on data from newborn screening programs, the worldwide prevalence of pyridoxine non-responsive HCU has been estimated to be approximately 1 in 335,000 (Mudd et al. 2001) but varies from 1:900,000 (Japan, Naughten et al. 1998), 1:400,000 (Germany, Aymé and Hivert 2011) to 1:65,000 (Ireland, Yap and Naughten 1998) and 1:58,000 (Australia, Naughten et al. 1998) the latter at a time when the Australian population had a high proportion with Irish ancestry. We previously reported a high prevalence of about 1:3,000 in Qatar. In this highly consanguineous population HCU is caused primarily by homozygosity for the mutation p.R336C (c.1006C>T) in the CBS gene (Bener and Hussain 2006; El-Said et al. 2006; Zschocke et al. 2009; Gan-Schreier et al. 2010).
Based on the newborn screening samples of 125,047 children born in Qatar, obtained over a 7-year period from July 2006 to June 2013 using the parameters Met, Phe and Hcy measured by high-throughput liquid chromatography–tandem mass spectrometry (LC-MS/MS) in all samples, we developed a strategy using Met to Phe ratio as first-tier, and Hcy values as second-tier screening parameters for HCU.
In addition, samples from newborn screening programs in Austria, Australia, the Netherlands, and Taiwan were used to test the generalizability of the suggested two-tier strategy.
Materials and Methods
Study Design
The primary goal of the present study was to develop a two-tier strategy for screening for HCU. Screening of 125,047 samples from Qatar between 2006 and 2013 for HCU on the basis of Hcy alone resulted in 30 confirmed cases. In a reevaluation of the data initially obtained from the regular newborn screening (Met, Phe) as well as from the Hcy determination by LC-MS/MS performed in all newborns in Qatar we used in a first approach Met as first-tier and Hcy as second-tier parameters. As this strategy resulted in a rather insufficient model with a cut-off for Met at P62 to achieve 100% sensitivity, in a second approach the Met to Phe ratio was used as first-tier variable. As phenylalanine metabolism is not affected by HCU, Phe normalizes Met, i.e., individuals with overall higher or lower amino acid profiles would have normal ratios, and only individuals with Met values deviating from the average profile would become noticeable. Again Hcy was used as a second-tier parameter.
The secondary goal was to investigate samples from the newborn screening programs of Australia, the Netherlands, Austria, and Taiwan to test the generalizability of the two-tier algorithms. All samples exceeding the top 3% (>P97) of methionine concentrations in DBS were punched into sealed microtiter membrane plates (96 wells; Millipore Multi Screen Filter Plates 0.22 μm, Darmstadt, Germany), stored at 4°C, and sent to the screening laboratory in Heidelberg, Germany, for measurement of Hcy. No cases of HCU were identified in these samples. The confirmed HCU cases from Qatar were then processed together with this second data set using the Met and Hcy two-tier algorithm previously applied on the Qatar data set. The study was approved by the respective local ethical committees.
Determination of Methionine and Phenylalanine in Dried Blood Spots
Blood spots taken between the 36th and 72nd hour of life were sampled on screening cards (Neonatal Screening Card; Whatman 903, GE Healthcare Europe GmbH, Freiburg, Germany) and dried at room temperature. Met and Phe were analyzed as their butyl esters on a triple quadrupole tandem mass spectrometer with [2H3]methionine and [2H3]phenylalanine as internal deuterated standards as previously described (Lindner et al. 2007 and the references therein). All other participating laboratories performed amino acid and acylcarnitine profiling using the above-mentioned derivatization step and subsequent ESI-MS/MS measurements (Australia and Austria: Wilcken et al. 2003; Taiwan: Huang et al. 2006; and the Netherlands: Rizzo et al. 2003).
Determination of Homocysteine in Dried Blood Spots
Following a formerly reported technique (Gan-Schreier et al. 2010), Hcy concentrations were quantified from the same blood samples in 3.2 mm punch-outs by LC-MS/MS using a modified stable isotope dilution technique (Gempel et al. 2000) and [2H4]homocysteine (Fluka, Sigma Aldrich, Taufkirchen, Germany) as an internal standard.
A Quattro micro tandem mass spectrometer (Waters, Germany) fitted with a Z-Spray ion source was used for all analyses. The instrument was operated in electrospray positive ion mode coupled to a Rheos 2000 HPLC system using an Atlantis™ HILIC Silica 2.1 × 50 mm, 3 μm (Waters, Eschborn, Germany) for separation. All aspects of system operation and data acquisition were controlled using Masslynx NT v3.5 software.
Data Analysis
For comparison of distributions of Met, Hcy, and Met to Phe values between samples with the Brown–Forsythe Levene-type test, R function “levene.test” in software package lawstat (Gastwirth et al. 2013) of statistical program R (R Core Team 2015) was used with the setting ‘correction.method = “zero.correction”’. All other statistical analyses were performed using SPSS 22 (SPSS Inc., Chicago, IL).
Results
HCU Screening Based on Hcy
In Qatar, from July 2006 until June 2008 a total of 29,791 neonates (12,152 = 40.8% Qatari; 17,639 = 59.2% non-Qatari) were screened for HCU. Starting from July 2008, information concerning ethnic origin was suppressed. For 95,256 neonates screened from July 2008 portions for the Qatari population (38,856 corresponding 40.8%) as well as for the non-Qatari population (56,400 corresponding 59.2%) were estimated on the basis of the data from 2006 until 2008. For all further calculations the total sample of 125,047 screened neonates was divided into a total sample of 51,008 Qatari children and 74,039 of non-Qatari children.
During the whole period of the study 132 cases of vitamin B12 deficiency and 30 confirmed patients with HCU were identified. Vitamin B12 deficiency was confirmed in 59 subjects in the Qatari subsample and 73 subjects in the non-Qatari subsample. The 30 patients with classical HCU were found by Hcy screening using the LC-MS/MS method. HCU patients were exclusively of Qatari origin (Table 1).
Table 1.
Basic description of the data set
| Country (period) | Samples (n) | Excluded from analysisa (n) | Missing datab (n) | Samples included in analysis (n) | Cases HCU | N for prevalencec | Prevalence |
|---|---|---|---|---|---|---|---|
| Qatari (July 2006–June 2008) | 12,152 | 952 | 0 | 11,200 | 7 | 12,152 | 1:1,736 |
| Qatari (July 2008–June 2013)d | 38,856 | 377 | 0 | 38,479 | 23 | 38,856 | 1:1,689 |
| Qatari (July 2006–June 2013) | 51,008 | 1,329 | 0 | 49,679 | 30 | 51,008 | 1:1,700 |
| Non-Qatari (July 2006–June 2008) | 17,639 | 2,177 | 0 | 15,462 | 0 | 17,639 | <1:17,639 |
| Non-Qatari (July 2008–June 2013)d | 56,400 | 862 | 0 | 55,538 | 0 | 56,400 | <1:56,400 |
| Non-Qatari (July 2006–June 2013) | 74,039 | 3,039 | 0 | 71,000 | 0 | 74,039 | <1:74,039 |
| Australia (2009–2010) | 4,344 | 452 | 96 | 3,796 | 0 | 144,800c | <1:144,800 |
| Austria (2009–2010) | 1,795 | 246 | 440 | 1,109 | 0 | 59,833c | <1:59,833 |
| Taiwan (2010) | 206 | 2 | 0 | 204 | 0 | 6,867c | <1:6,867 |
| The Netherlands (2009–2010) | 1,812 | 10 | 1,485 | 317 | 0 | 60,400c | <1:60,400 |
aPreterm sample, other diagnosis, medication, material insufficient, and post mortem sample
bMet and/or Phe missing
cCalculated as (n of samples/3) × 100
dEstimated on the distribution of screening period July 2006–June 2008
In the one-tier Hcy screening approach the cut-off for Hcy was 10 μmol/l (99.0 percentile) until March 2009 and 12 μmol/l (99.2 percentile) thereafter. In confirmed HCU patients Hcy levels in the first blood spot ranged from 14.1 to 97.0 μmol/l for Hcy. Compared to the healthy Qatari population, the lowest patient value for homocysteine of 14.1 μmol/l was well above the 100 percentile of the healthy population (12 μmol/l) resulting in a sensitivity and specificity of 100% for the cut-off of 12 μmol/l, and a sensitivity of 100% and a specificity of 99.04% (leading to 107 false positives) for the 10 μmol/l cut-off. All cases with Hcy values above the cut-offs were further investigated by molecular genetics identifying 30 confirmed cases (homozygosity for R336C: n = 29, D234N: n = 0, G347S: n = 1). No additional case with HCU has been diagnosed based on clinical symptoms so far (between July 2006 and June 2013).
Development of a Two-Tier Strategy for the Screening of Classical Homocystinuria: Met and Hcy Two-Tier Strategy
We first used Met as first-tier parameter, as it is measured routinely during screening of amino acids by ESI-MS/MS. Met values in the first screening card for patients with confirmed HCU ranged from 21.0 to 262.0 μmol/l, with the lowest value for Met corresponding to the 62nd percentile. In a retrospective approach, the cut-off for Met was set at 20 μmol/l, i.e., below the minimum value of the HCU patients, thus ensuring 100% sensitivity. This first-tier criterion led to a percentage of 38.44 (19,097 cases) suspected cases of HCU (specificity = 0.616, see Table 2) if the cut-off was trimmed for a 100% sensitivity. Only samples with first-tier values above the respective cut-offs entered the second-tier measuring Hcy. As this approach was judged to be inefficient, a second strategy, using the Met to Phe ratio as first- and Hcy as second-tier was developed and tested.
Table 2.
Results of first- and second-tier strategies with cut-offs trimmed for 100% sensitivity
| First-tier | Second-tier: Hcy = 12 μmol/l (P100) | |||||
|---|---|---|---|---|---|---|
| Sensitivity | Specificity | No. (%) of positives | Sensitivity | Specificity | No. of false positives | |
| Met > 20 (=P61) | 1 | 0.616 | 19,097 (38.44) | 1 | 1 | 0 |
| Met/Phe > 0.77 (=P98.8) | 1 | 0.988 | 611 (1.23) | 1 | 1 | 0 |
| Met/Phe > 0.61 (=P94) | 1 | 0.942 | 2,885 (8.81) | 1 | 1 | 0 |
| Met/Phe > 0.56 (=P89)a | 1 | 0.898 | 5,105 (10.28) | 1 | 1 | 0 |
Number of samples that go into first-tier: 49,679 including 30 homocystinuria patients
aIncluding four additional HCU cases
Development of a Two-Tier Strategy for the Screening of Classical Homocystinuria: Met to Phe and Hcy Two-Tier Strategy
Phe values of confirmed cases ranged from 27.0 to 73.0 μmol/l and Met to Phe ratios from 0.78 to 4.68. The lowest Met to Phe ratio corresponded to the 98.8th percentile of controls. Using a cut-off of 0.77 for the Met to Phe ratio as first-tier led to a percentage of 1.23 (611 cases) of suspected HCU (specificity = 0.988, Table 2). Again, only samples with first-tier values above the respective cut-offs entered the second-tier using Hcy values as diagnostic criterion. The 132 cases of vitamin B12 deficiency identified by first-tier Hcy were sorted out by the Met to Phe ratio cut-off during the first-tier.
Generalizability of the Two-Tier Approach
A strict test of the generalizability of the two-tier approach using the samples from Australia, Austria, the Netherlands, and Taiwan would require confirmed HCU cases identified in these screening programmes. However, no case of HCU was found in the samples analyzed for this study, nor was any clinically identified case reported during the observation period. To test the generalizability of our algorithm using the data of the samples defined by the upper 3% of the Met distributions of neonates screened in Australia, Austria, the Netherlands, Taiwan, and Qatar (Table 1 and Supplemental Table 1) we developed the following approach. First, we compared the upper 3% of values in the Qatari and non-Qatari subsamples from July 2006 to June 2008. There were only small differences between the medians as well as the distributions of Met and Hcy (Met: median test: χ2(df = 1, N = 753) = 1.78, p = 0.182, Cramer’s V = 0.049, 95%-CI[−0.023; 0.120]; Brown–Forsythe Levene-type test for distribution: W(df1 = 1, df2 = 751) = 4.33, p = 0.038, Cramer’s V = 0.076, 95%-CI[0.004; 0.146] – Hcy: median test: χ2(df = 1, N = 753) = 0.12, p = 0.729, Cramer’s V = 0.013, 95%-CI[−0.059; 0.084]; Brown–Forsythe Levene-type test for distribution: W(df1 = 1, df2 = 751) = 1.87, p = 0.172, Cramer’s V = 0.050, 95%-CI[−0.022; 0.121]). Cramer’s V gives a standardized difference between sample characteristics, small values indicating small differences. As in studies with large samples even small differences easily become significant, effect sizes and their confidence intervals are recommended to evaluate the practical significance of a result (Lin et al. 2013; Nuzzo 2014). Following Cohen’s (Cohen 1988) effect sizes were classified as small (values >= 0.1), medium (>=0.3), or large (>=0.5). All Vs comparing Qatari and non-Qatari samples were very small. Therefore, for further analyses subsamples from Qatar were merged.
In a second step comparing Met values >P97 across Qatar, Australia, Austria, the Netherlands, and Taiwan (Supplemental Fig. 1), we found a medium size difference between medians (median test: χ2(df = 4, N = 8,638) = 4648.30, p < 0.001, Cramer’s V = 0.367, 95%-CI[0.348; 0.385]) but not for distributions (Brown–Forsythe Levene-type test for distribution: W(df1 = 4, df2 = 8,633) = 287.81, p < 0.001, Cramer’s V = 0.091, 95%-CI[0.070; 0.112]). Significance for medians was only due to Australian data showing higher Met values than in all other countries, which were rather similar (median test: χ2(df = 3, N = 4,842) = 163.03, p < 0.001, Cramer’s V = 0.106, 95%-CI[0.078; 0.134]; Brown–Forsythe Levene-type test for distribution: W(df1 = 3, df2 = 4,838) = 308.80, p < 0.001, Cramer’s V = 0.146, 95%-CI[0.118; 0.173]).
Also differences between Met to Phe ratios (Supplemental Fig. 2) as well as between Hcy values (Supplemental Fig. 3) in blood samples selected if Met > P97 from Qatar, Australia, Austria, the Netherlands, and Taiwan were small (Met/Phe: median test: χ2(df = 4, N = 8,637) = 317.92, p < 0.001, Cramer’s V = 0.096, 95%-CI[0.075; 0.117]; Brown–Forsythe Levene-type test for distribution: W(df1 = 4, df2 = 8,632) = 333.43, p < 0.001, Cramer’s V = 0.098, 95%-CI[0.077; 0.119]; Hcy: median test: χ2(df = 4, N = 8,638) = 555.19, p < 0.001, Cramer’s V = 0.127, 95%-CI[0.106; 0.147]; Brown–Forsythe Levene-type test for distribution: W(df1 = 4, df2 = 8,633) = 70.80, p < 0.001, Cramer’s V = 0.045, 95%-CI[0.024; 0.066]).
In summary, distributions of Met values and Met to Phe ratios for Met > P97 were similar across all countries allowing us to conclude that Qatar data are comparable to those of other countries and a generalization of our results found for Qatar could be justified. The definite test of the generalizability of the two-tier strategy, however, is not possible, as this would require access to the complete data set of Met to Phe ratios.
Determination of a Cut-Off for the Met to Phe Ratio
Using a Met to Phe ratio of 0.77 as a cut-off given the lowest Met to Phe ratio of confirmed HCU patients being 0.78 would not be conservative enough, as repeated measurement of the same sample might be at risk to be lower than 0.77 and therefore would miss the case. The standard error of prediction (σiI) allows calculation of the interval for a repeated measurement (Xi) of a blood sample having the result XI (Dudek 1979). It is calculated as σiI = σi(1 − riI2)1/2, σi being the standard deviation of all measurements and riI the reliability of the measurement device. Quality control samples of four different concentrations for Met and Phe used as internal standards for MS/MS experiments were used to calculate the reliability (Hopkins 2000) resulting in a value of 0.994. These quality controls are the regular quality control samples which were measured each day before starting the amino acid and acylcarnitine profiling.
The mean of Met to Phe ratios of all 30 confirmed cases obtained from the initially measured data obtained from the regular screening program was 1.55 with a standard deviation of 0.77 and was used to estimate σi, leading to a standard error of prediction of 0.084. The expected true value of the lowest Met to Phe ratio is calculated as 1.55 + ((0.78 − 1.55) × 0.994) = 0.784. Now the 95% CI for 0.784 can be calculated as 0.784 ± 1.96 × 0.084 resulting in an interval of ]0.62–0.95[, with the lower bound corresponding to P 94.7. Using 0.61 (P94) as a new cut-off for Met to Phe ratio as a first-tier would still result in a sensitivity of 1. Specificity would slightly decrease to 0.942 remitting 2,885 samples to the second-tier Hcy measurement of the screening process.
Discussion
Newborn screening for classical homocystinuria performed by measurement of Met concentrations in dried blood spots has an insufficient sensitivity. The exact proportion of cases missed by newborn screening for methionine is unknown. In the present study taking the 99.5th Met centile (42 μmol/l) as a cut-off, 4 out of 34 (11.8%) affected babies would have been missed. Met cut-off values as low as 40 μmol/l have been proposed to yield higher sensitivity (Huemer et al. 2015 and the references therein: McHugh et al. 2011; Turgeon et al. 2010) but methionine seems to be to insecure as a first-tier parameter. The false negative rate is likely to be higher with early (<5 days) than with later blood sampling (5–7th day of life). Therefore, early screening, due to early discharge from the maternity unit, can be expected to influence the proportion of cases missed by methionine screening. Breast-fed babies may also have significantly lower methionine levels because of low concentrations of methionine in breast milk compared to some infant formulas (Naughten et al. 1998). Taken together, Met alone is not an adequate parameter for screening for classical homocystinuria.
Hcy can be measured in dried blood spots by LC-MS/MS for HCU screening with 100% sensitivity and specificity (Gan-Schreier et al. 2010; Alodaib et al. 2012). However, this approach requires measuring all samples with this particular and elaborated method. Our screening strategy for Qatar was so far based on Hcy as first-tier in all samples. As this is the only newborn screening programme in the world with Hcy measured in all subjects we could use a unique data set for evaluation of different second-tier strategies in newborn screening for HCU. We could demonstrate that using Met as first- and Hcy as second-tier is also a strategy with 100% sensitivity and specificity, if the cut-off for Met is set at a sufficiently low level. Compared to the Hcy alone strategy the number of samples requiring Hcy measurement is reduced by 61.6% in this second-tier strategy. However, Met and Phe are already measured by ESI-MS/MS in NBS for aminoacidopathies without additional cost and effort. Sensitivity is also increased by using the Met to Phe ratio which adjusts to the above-mentioned different protein intake (Bowron et al. 2005). Using the Met to Phe ratio as first-tier reduces the total number of samples requiring Hcy measurement by 89.7% in our retrospective data evaluation. Therefore, Met to Phe ratio as first-tier and Hcy as second-tier appears to be the optimal strategy. In the generalizability study we could demonstrate that the distributions of Met, Met to Phe ratio, and Hcy for samples selected if Met > P97 were rather similar between Qatari and non-Qatari samples from Qatar, as well as between Australia, Austria, Taiwan, and the Netherlands. However, the direct test comparing complete distributions of Met to Phe ratios remains to be done.
In retrospect although all HCU cases could be detected by first-tier Met and second-tier Hcy in the data sets selected by the upper 3% of Met distributions (corresponding to a first-tier screening using P97 for Met) from Australia and Austria, one case would not have been included in the data sets from Taiwan and the Netherlands, where one more had a Met value equal to the cut-off.
Our data allow the calculation of the prevalence for HCU in Qatar among the Qatari population, giving an estimate of 1:1,700, stable across different observation periods (Table 1, see also Gan-Schreier et al. 2010). As not a single case was found in any of the other samples from other countries, only upper limits for prevalence estimates can be derived from the data sets. Merging all non-Qatari subgroups included in our analysis results in a prevalence estimate for HCU lower than 1:345,939, which is in agreement with some previously published estimates (see introduction and Skovby et al. 2010, which estimated the frequency of classical CBS to 1:344,000).
One limitation is that CBS deficiency in the Qatari population is predominately caused by homozygosity for a frequent mutation (Bener and Hussain 2006; El-Said et al. 2006; Zschocke et al. 2009; Gan-Schreier et al. 2010). Therefore our results are not necessarily transferable to other populations with different genetic backgrounds. The generalizability of the approach should be prospectively evaluated in future studies in other populations with high incidences of CBS deficiency, e.g., the Irish population.
As expected according to the genetic background of the Qatari population, all patients detected in this study were pyridoxine non-responsive. Therefore, we cannot draw conclusions about detection of pyridoxine-responsive CBS patients by the proposed strategy in other populations. Based on the higher frequency of pyridoxine-responsive CBS patients in historical cohorts compared to cohorts detected by newborn screening (Huemer et al. 2015) current newborn screening strategies have been reported to miss the majority of pyridoxine-responsive CBS patients.
After we had finished all calculations leading to the cut-off for the Met to Phe ratio of 0.61 four more confirmed cases with HCU have been identified by one-tier Hcy screening (Hcy: 57, 82, 100, 79 μmol/l). Met to Phe ratios of these cases were 0.94, 0.96, 0.73, 1.54, i.e., all these cases would have also been detected by the suggested two-tier algorithm. However, the case with a Met to Phe ratio of 0.73 constitutes a new minimum (Fig. 1). This is comparable with the recommended cut-off value (0.75–0.97) presented previously as a summary of the laboratory markers for newborn screening of homocystinurias and methylation defects in the R4S collaborative project (Huemer et al. 2015). The lower bound of the interval for a repeated measurement of the sample with the Met to Phe ratio = 0.73 based on now 34 confirmed cases with HCU is 0.57. Therefore, for a sensitivity of 1, the new cut-off had to be changed to 0.56 (corresponding to P89), resulting in a specificity of 0.898 or 10.28% first-tier positives to be transferred to Hcy determination in the same dried blood sample.
Fig. 1.
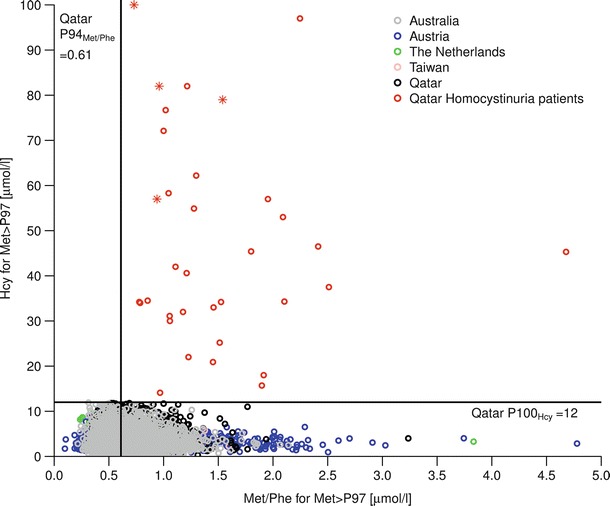
Met/Phe and Hcy for upper three percent of Met distribution of all samples and for Qatar homocystinuria patients; red stars indicate cases with confirmed HCU found after data analysis
Conclusion
In conclusion, three options have been evaluated retrospectively for neonatal screening for HCU. In a one-tier strategy samples of all newborn have to be investigated for Hcy, which has a sensitivity and specificity of 100% but is an elaborated method. Using Met as first-tier would result in nearly 40% of samples to be measured for Hcy in a second-tier strategy. Finally, using the Met to Phe ratio as first-tier would result in ~10% of samples which have to be analyzed for Hcy. We have validated a reliable strategy to screen for HCU using MS/MS for the first-tier Met to Phe ratio and LC-MS/MS for Hcy as second-tier.
Electronic Supplementary Material
Below is the link to the electronic supplementary material.
Acknowledgements
We thank Deborah Treiber and all members of the Newborn Screening Laboratory in Heidelberg as well as the team in the Newborn Screening Units in Austria, Australia, the Netherlands (especially Bert Elvers), Qatar, and Taiwan for excellent assistance and continuous reliable work.
This extensive study over more than a decade was only made possible by the continuous and generous support of the Dietmar Hopp Foundation to Georg F. Hoffmann.
Abbreviations
- CBS
Cystathionine β-synthase
- DBS
Dried blood spots
- ESI-MS/MS
Electrospray ionization-tandem mass spectrometry
- HCU
Classical homocystinuria
- Hcy
Homocysteine
- HPLC
High-performance liquid chromatography
- LC-MS/MS
Liquid chromatography-tandem mass spectrometry
- Met
Methionine
- Phe
Phenylalanine
Synopsis
Systematical evaluation and subsequent implementation of a second-tier test for homocysteine in dried blood spots improve the specificity and positive predictive value for classical homocystinuria screening.
Author Contributions
Jürgen G. Okun, Hongying Gan-Schreier, and Kathrin V. Schmidt participated in the design of the study and were involved in the experimental setup of the study. Junmin Fang-Hoffmann, Gwendolyn Gramer, Ghassan Abdoh, Tawfeg Ben-Omran, Noora Shahbeck, Hilal Al Rifai, and Abdul Latif Al Khal were involved in the newborn screening process and clinical evaluation of patients. Chuan-Chi Chiang, David C. Kasper, and Bridget Wilcken provided the upper 3% methionine samples of their newborn screening programs. Gisela Haege and Peter Burgard performed the statistical analyses and made substantial contributions to conception and interpretation of the study. Georg F. Hoffmann and Jürgen G. Okun initiated the study, participated in its design and coordination, and drafted the manuscript.
Conflict of Interest
Jürgen G. Okun, Hongying Gan-Schreier, Kathrin V. Schmidt, Junmin Fang-Hoffmann, Ghassan Abdoh, Tawfeg Ben-Omran, Noora Shahbeck, Hilal Al Rifai, Abdul Latif Al Khal, Gisela Haege, Chuan-Chi Chiang, David C. Kasper, Bridget Wilcken, Peter Burgard, and Georg F. Hoffmann declare to have no conflict of interest.
Compliance with Ethics Guidelines
This article does not contain any studies with human or animal subjects. All procedures followed were in accordance with the ethical standards of the responsible committee on human experimentation (institutional and national) and with the Helsinki Declaration of 1975, as revised in 2000.
Footnotes
Competing interests: None declared
Contributor Information
Jürgen G. Okun, Email: juergen.okun@med.uni-heidelberg.de
Collaborators: Matthias R. Baumgartner, Marc Patterson, Shamima Rahman, Verena Peters, Eva Morava, and Johannes Zschocke
References
- Alodaib AN, Carpenter K, Wiley V, Wotton T, Christodoulou J, Wilcken B. Homocysteine measurement in dried blood spot for neonatal detection of homocystinurias. JIMD Rep. 2012;5:1–6. doi: 10.1007/8904_2011_109. [DOI] [PMC free article] [PubMed] [Google Scholar]
- American College of Medical Genetics Newborn Screening Expert Group Newborn screening: toward a uniform screening panel and system-executive summary. Pediatrics. 2006;117:S296–S307. doi: 10.1542/peds.2005-2633I. [DOI] [PubMed] [Google Scholar]
- Aymé S, Hivert V (2011) Report on rare disease research, its determinants in Europe and the way forward. Homocystinuria due to cystathionine beta-synthase deficiency: Estimated Prevalence: 0.4/100,000
- Bener A, Hussain R. Consanguineous unions and child health in the State of Qatar. Paediatr Perinat Epidemiol. 2006;20:372–378. doi: 10.1111/j.1365-3016.2006.00750.x. [DOI] [PubMed] [Google Scholar]
- Bowron A, Barton A, Scott J, Stansbie D. Blood spot homocysteine: a feasibility and stability study. Clin Chem. 2005;51:257–258. doi: 10.1373/clinchem.2004.041640. [DOI] [PubMed] [Google Scholar]
- Cohen J. Statistical power analysis for the behavioral sciences. 2. Hillsdale: Lawrence Erlbaum; 1988. [Google Scholar]
- Dudek FJ. The continuing misinterpretation of the standard error of measurement. Psychol Bull. 1979;86:335–337. doi: 10.1037/0033-2909.86.2.335. [DOI] [Google Scholar]
- El-Said MF, Badii R, Bessisso MS, et al. A common mutation in the CBS gene explains a high incidence of homocystinuria in the Qatari population. Hum Mutat. 2006;27:719. doi: 10.1002/humu.9436. [DOI] [PubMed] [Google Scholar]
- Gan-Schreier H, Kebbewar M, Fang-Hoffmann J, et al. Reliable newborn population screening for classical homocystinuria by determination of total homocysteine from Guthrie cards. J Pediatr. 2010;156:427–432. doi: 10.1016/j.jpeds.2009.09.054. [DOI] [PubMed] [Google Scholar]
- Gastwirth JL, Gel YR, Wallace Hui WL, Lyubchich V, Miao W, Noguchi K (2013) Lawstat: an R package for biostatistics, public policy, and law. R package version 2.4.1, http://CRAN.R-project.org/package=lawstat (accessed 12.02.2015)
- Gempel K, Gerbitz KD, Casetta B, Bauer MF. Rapid determination of total homocysteine in blood spots by liquid chromatography-electrospray ionization-tandem mass spectrometry. Clin Chem. 2000;46:122–123. [PubMed] [Google Scholar]
- Hopkins WG. Measures of reliability in sports medicine and science. Sports Med. 2000;30:1–15. doi: 10.2165/00007256-200030010-00001. [DOI] [PubMed] [Google Scholar]
- Huang HP, Chu KL, Chien YH, et al. Tandem mass neonatal screening in Taiwan-report from one center. J Formos Med Assoc. 2006;105:882–886. doi: 10.1016/S0929-6646(09)60173-X. [DOI] [PubMed] [Google Scholar]
- Huemer M, Kožich V, Rinaldo P, et al. Newborn screening for homocystinurias and methylation disorders: systematic review and proposed guidelines. J Inherit Metab Dis. 2015;38:1007–1019. doi: 10.1007/s10545-015-9830-z. [DOI] [PMC free article] [PubMed] [Google Scholar]
- Lin M, Lucas HC, Shmueli G. Too big to fail: large samples and the p-value problem. Inf Syst Res. 2013;24:906–917. doi: 10.1287/isre.2013.0480. [DOI] [Google Scholar]
- Lindner M, Abdoh G, Fang-Hoffmann J, et al. Implementation of extended neonatal screening and a metabolic unit in the State of Qatar: developing and optimizing strategies in cooperation with the Neonatal Screening Center in Heidelberg. J Inherit Metab Dis. 2007;30:522–529. doi: 10.1007/s10545-007-0553-7. [DOI] [PubMed] [Google Scholar]
- McHugh D, Cameron CA, Abdenur JE, et al. Clinical validation of cutoff target ranges in newborn screening of metabolic disorders by tandem mass spectrometry: a worldwide collaborative project. Genet Med. 2011;13:230–254. doi: 10.1097/GIM.0b013e31820d5e67. [DOI] [PubMed] [Google Scholar]
- Mudd SH, Finkelstein JD, Irreverre F, Laster L. Homocystinuria: an enzymatic defect. Science. 1964;143:1443–1445. doi: 10.1126/science.143.3613.1443. [DOI] [PubMed] [Google Scholar]
- Mudd SH, Levy HL, Kraus JP. Disorders of transsulfuration. In: Scriver CR, Beadudet AL, Sly WS, Valle D, editors. The metabolic and molecular bases of inherited disease. 8. New York: McGraw-Hill; 2001. pp. 2007–2056. [Google Scholar]
- Naughten ER, Yap S, Mayne PD. Newborn screening for homocystinuria: Irish and world experience. Eur J Pediatr. 1998;157(Suppl 2):S84–S87. doi: 10.1007/PL00014310. [DOI] [PubMed] [Google Scholar]
- Nuzzo R. Scientific method: statistical errors. Nature. 2014;506:150–152. doi: 10.1038/506150a. [DOI] [PubMed] [Google Scholar]
- R Core Team (2015) R: a language and environment for statistical computing. R Foundation for Statistical Computing. R version 3.2.1 Vienna, Austria. http://www.R-project.org/
- Rizzo C, Boenzi S, Wanders RJ, Duran M, Caruso U, Dionisi-Vici C. Characteristic acylcarnitine profiles in inherited defects of peroxisome biogenesis: a novel tool for screening diagnosis using tandem mass spectrometry. Pediatr Res. 2003;53:1013–1018. doi: 10.1203/01.PDR.0000064902.59052.0F. [DOI] [PubMed] [Google Scholar]
- Schulze AS, Matern D, Hoffman GF. Newborn screening. In: Sarafoglou K, Hoffmann GF, Roth KS, editors. Pediatric endocrinology and inborn errors of metabolism. New York: McGraw-Hill; 2009. pp. 17–36. [Google Scholar]
- Skovby F, Gaustadnes M, Mudd SH. A revisit to the natural history of homocystinuria due to cystathionine beta-synthase deficiency. Mol Genet Metab. 2010;99:1–3. doi: 10.1016/j.ymgme.2009.09.009. [DOI] [PMC free article] [PubMed] [Google Scholar]
- Turgeon CT, Magera MJ, Cuthbert CD, et al. Determination of total homocysteine, methylmalonic acid, and 2-methylcitric acid in dried blood spots by tandem mass spectrometry. Clin Chem. 2010;56:1686–1695. doi: 10.1373/clinchem.2010.148957. [DOI] [PubMed] [Google Scholar]
- Wilcken B, Wiley V, Hammond J, Carpenter K. Screening newborns for inborn errors of metabolism by tandem mass spectrometry. N Engl J Med. 2003;348:2304–2312. doi: 10.1056/NEJMoa025225. [DOI] [PubMed] [Google Scholar]
- Wong D, Tortorelli S, Bishop L, et al. Outcomes of four patients with homocysteine remethylation disorders detected by newborn screening. Genet Med. 2016;18:162–167. doi: 10.1038/gim.2015.45. [DOI] [PubMed] [Google Scholar]
- Yap S, Naughten E. Homocystinuria due to cystathionine β-synthase deficiency in Ireland: 25 years’ experience of a newborn screened and treated population with reference to clinical outcome and biochemical control. J Inherit Metab Dis. 1998;21:738–747. doi: 10.1023/A:1005445132327. [DOI] [PubMed] [Google Scholar]
- Zschocke J, Kebbewar M, Gan-Schreier H, et al. Molecular neonatal screening for homocystinuria in the Qatari population. Hum Mutat. 2009;30:1021–1022. doi: 10.1002/humu.20994. [DOI] [PubMed] [Google Scholar]
Associated Data
This section collects any data citations, data availability statements, or supplementary materials included in this article.