

Abstract
Accurate expression profiling is imperative for understanding the biological roles of mRNAs. Real-time PCR have been at the forefront of biological innovation in detection and monitoring of gene expression, however, fluorophore-labeled oligonucleotides and double-stranded DNA binding dyes, the two most frequently used dyes in RNA detection, are not very cost effective and have poor specificity, respectively. We have developed a cost effective and specific approach for mRNA expression profiling via added unique sequence index (USI) to cDNAs before amplification. USI is a barcode which enable the detection of each target RNA. Using this method, caudal type homeobox 1 (CDX1) and FAT atypical cadherin 4 (FAT4) expressions were investigated in tumoral and non-tumoral tissues of gastric cancer patients and compared with commercial ABI kit. Both methods indicated that FAT4 and CDX1 expression were significantly reduced in gastric cancer tissues compared with adjacent noncancerous tissues. Moreover, we have shown that this assay is highly sensitive, linear and reproducible. USI barcode not only provides a powerful tool for mRNA detection due to its sensitivity, specificity and cost-effectiveness, but also allows comfortable design for real-time qPCR assays within the least time and empowers the analysis of many transcripts of virtually any organism. Furthermore, USI barcode is highly affordable for large numbers of different samples or small sample sizes without microarray and expensive commercial platforms.
Keyword: QPCR; Gene expression; Taqman; FAT4; CDX1, cancer
Introduction
Identifying differentially expressed genes is an integral part of understanding the molecular basis of human diseases and may also be used for diseases diagnosis or prognosis (Khan et al. 2001; Martin et al. 2009; Mayfield and Harris 2009; Ståhlberg et al. 2011). In the past decades, several methods including microarray and real-time quantification PCR (QPCR) have been developed to detect the expression of genes (Gibson et al. 1996; Heid et al. 1996; Krumlauf 1994; Tarca et al. 2006). QPCR is a well-established procedure widely and increasingly used for gene expression analysis in the medical field due to its high sensitivity, good reproducibility and wide dynamic quantification range (Murphy and Bustin 2009). QPCR is often referred to as the gold standard for detection of mRNAs and is also used for validating data obtained from high-throughput microarrays and sequencing (Adamski et al. 2014; Jeanty et al. 2010; Morey et al. 2006). Moreover, gene expression analysis was improved by probe-based, rather than intercalator-based, PCR product detection. Many fluorescent PCR probe-based chemistries have been developed and are available such as hydrolysis (Taqman) probes, molecular beacons, scorpions, eclipse probes, dual hybridization probes, amplifluor assays, LUX PCR primers and QZyme PCR primers. Accordingly, many commercial kits, based on real-time PCR, have also been developed. Taqman assay technology is considered as the gold standard for gene expression quantification but requires individual mRNA-specific hydrolytic Taqman probes, making them very costly for a high throughput mRNA expression profiling. CDX1 and FAT4 are members of the caudal-related homeobox gene family and a cadherin-related protein, respectively. These genes encode tumor suppressor proteins that normally inhibit the formation of tumors (Cai et al. 2015; Hryniuk et al. 2014; Qi et al. 2009; Zhang et al. 2013). CDX1 regulates intestine-specific gene expression and enterocyte differentiation (Suh and Traber 1996). It is a key regulator of differentiation in the normal colon and in colorectal cancer. It has been shown to inhibit human colon cancer cell proliferation by reducing cyclin D1 and β-Catenin/T-cell gene expression (Guo et al. 2004; Lynch et al. 2003). Abnormal expression of CDX1 has been observed in human gastric intestinal metaplasia (Kang et al. 2011). FAT4 plays an important role in the planar polarity formation and functions as a Hippo signaling regulator that controls organ size (Qi et al. 2009). Recent studies showed that FAT4 silencing promoted proliferation, migration and cell cycle progression via the activation of Wnt/β-catenin signaling and increase of phosphorylated Yap and nuclear accumulation of Yap (Cai et al. 2015; Ito et al. 2015; Ma et al. 2016). In the present study, we tested a QPCR-based approach for mRNA expression analysis using added unique sequence indices (USI) to cDNA molecules. The USI contains stem and loop structure that have specific portion for attachment probe and reverse primer, which is 64 bp in size attached to the 5′ end of an RT-PCR primer that is specific for RNA targets (Fattahi et al. 2017). The secondary structure, the principle of target recognition and cDNA synthesis by the USI barcode, as well as qPCR assay using universal primer and Taqman probe are represented in Fig. 1. As specific cDNAs synthesized using this USI have the same barcode, the same set of reverse stem-loop and probe can be used for different target-specific amplification assays. In addition, USI primers were compared with a Taqman probe-based commercial ABI kit which is considered as the gold standard (Wang et al. 2006), in their specificity, sensitivity, reproducibility and accuracy for caudal type homeobox 1 (CDX1), FAT atypical cadherin 4 (FAT4) genes expression in tumoral and non-tumoral tissues of gastric cancer patients.
Fig. 1.

Schematic representation of the principle of USI barcode application in gene expression analysis. a The target specific portion of the USI barcode binds specifically to the target mRNA and is reverse transcribed to make the first-strand cDNA which will contain a specific portion for probe and reverse primer attachment at its 5' end. b During qPCR assay, the synthesized cDNA is amplified with specific forward and universal reverse primers and amplification is quantified in the presence of the universal Taqman probe
Materials and methods
Subjects
Ten snap-frozen resected gastric tumoral and their non-tumoral counterpart tissues were obtained from patients referred to Rouhani Hospital, Babol, Iran, for surgery. Informed consent was obtained prior to sample collection which was approved by the ethical committee of Babol University of Medical Sciences.
Primer design
CDX1 (NM_001804.2), FAT 4 (NM_001291285.1) and GAPDH (NM_001289745), primer pairs were designed using AlleleID 6.0 software and USI were attached to RT-PCR primers for qPCR-based approach (Table 1). The sequence of Taqman probe was FAM 5′ TGGATGTGTCTGCGGCGTTTTATCAT 3′ BHQ-1 and the sequence of reverse primer was 5′ GTATCCAGTGCTGCGACCGT 3′. Probe-based commercial kit for CDX1, FAT4 and GAPDH were purchased from Applied Biosystems, USA.
Table 1.
Sequences of primers used in stem-loop Taqman assays
| Gene name | Accession number | Primers 5′ → 3’ |
|---|---|---|
| CDX1 | NM_001804.2 | Specific forward primer: GACGCCCTACGAGTGGATG RT-PCR primer GTCGTATCCAGTGCTGCGACCGTATGGATGTGTCTGCGGCGTTTTATCATGCACTGGATACGAC GAGTCTTACCGC |
| FAT4 | NM_001291285.1 | Specific forward primer ACACTGTGATTGCCAGGAGAG RT-PCR primer GTCGTATCCAGTGCTGCGACCGTATGGATGTGTCTGCGGCGTTTTATCATGCACTGGATACGAC CAAGAGTCCAGTC |
| GAPDH | NM_001289745 | Specific forward primer TGGAGTCCACTGGCGTCTTCAC RT-PCR primer GTCGTATCCAGTGCTGCGACCGTATGGATGTGTCTGCGGCGTTTTATCATGCACTGGATACGAC AGGCATTGCTGA |
USI sequence is underlined
QPCR assay
Tumoral and non-tumoral tissues were ground to a fine powder under liquid nitrogen. Total RNA was extracted from 20 to30 mg ground tissue using Tripure (Qiagen) according to the manufacturer’s instruction as previously described (Samadani et al. 2015). The integrity and purity of the RNA was measured based on electrophoresis and A260/A280 value, respectively. Genomic DNA contamination was removed from total RNA with DNase I (Roche Diagnostics, Mannheim, Germany) treatment according to the manufacturer’s instructions. For TaqMan probe-based commercial kit, cDNA synthesis was performed using random hexamer primers and RevertAid Reverse Transcriptase (Fermentas, Lithuania). For stem-loop RT assay, RNA samples were transcribed into cDNA via mRNA specific USI RT-PCR primers and RevertAid Reverse Transcriptase (Fermentas, Lithuania). QPCR reactions were carried out using Step One real-time PCR apparatus (Applied Biosystems, USA). Amplification protocol consisted of an initial denaturation at 95 °C for 5 min followed by 45 cycles, each consisting of denaturation at 95 °C for 45 s, annealing at 60 °C for 1 min.
Validation of stem-loop RT primer for gene expression
In order to evaluate the reproducibility and accuracy of stem-loop primers, intra assay (test precision)- and inter-assay (test variability) of GAPDH, CDX1 and FAT4 genes were investigated using three repeat of each gene (3 samples) within one run and three different experimental runs performed in three consecutive days, respectively. In addition, in order to examine the dynamic range and sensitivity of the mRNA quantification in universal Taqman assay, series of consecutive 10-fold dilutions of untreated RNAs were generated. The cDNA was synthesized by specific stem-loop primer followed by real-time PCR amplification with specific forward primer, universal reverse primer and Taqman probe.
Statistical analysis
Relative fold change of target RNA level was determined using the 2-∆∆CT method (Livak and Schmittgen 2001) by Relative Expression Software Tool (REST 2009). The significant difference between stem-loop and commercial kit was statistically analyzed by paired Student’s t test. P < 0.05 was considered as statistically significant.
Results
Expression of CDX1 in gastric tissue specimens
Expression of CDX1 was determined using qRT-PCR in 10 tumoral and their non-tumor tissue counterparts of stomach. In the stem loop assay, CDX1 was down-regulated in 70% of tumoral tissues and its expression was up-regulated in 20% of cases. In contrast, in the commercial kit assay, 60% of samples showed low expression and 30% were over-expressed. In both methods the expression of one sample (10%), did not change (Fig. 2).
Fig. 2.

Scatter plot of CDX1 gene expression in tumoral and non-tumoral tissues. Central black line shows identical expression; parallel red lines represent cut-off values (2 fold changes in expression). The upper part of the graphs indicates higher expression levels in the tumoral compared to the non-tumoral tissue; the lower part of the graph indicates lower expression levels in the tumoral compared to the non-tumoral tissue (differences in expression ≥2; P < 0.05) Red spheres: ABI primer; Yellow diamonds: stem-loop (S. L) primer
Expression of FAT4 in gastric tissue specimens
In stem loop assay, 80% of samples exhibited down-regulation of FAT4 in gastric cancer tumor, while its expression was up-regulated in one examined tumor tissue. In commercial kit assay, results also indicated down-regulation of FAT4 in 80% of tumors and over-expression of FAT4 only in one sample which was down regulated with stem-loop assay. Expression of FAT4 did not change in one sample in both assays (Fig. 3). Therefore, out of 10 examined samples, the 2 methods were concordant in 80% of cases (Fig. 2).
Fig. 3.

Scatter plot of FAT4 gene expression in tumoral and non-tumoral tissue. Central black line shows identical expression; parallel red lines represent cut-off values (2 fold changes in expression). The upper part of the graphs indicates higher expression levels in the tumoral compared to the non-tumoral tissue; the lower part of the graph indicates lower expression levels in the tumoral compared to the non-tumoral tissue (differences in expression ≥2; P < 0.05) Red spheres: ABI primer; Yellow diamonds: stem-loop (S. L) primer
Comparison of stem loop system with commercial kit
The expression levels of CDX1 and FAT4 genes by stem loop and commercial kit assays were measured by real-time RT-PCR in tumoral and non-tumoral tissues. Data analysis by rest software indicated that in both assays FAT4 and CDX1 were down-regulated. The difference between the P values of the 2 methods (stem loop and commercial kit assays) was not significant (Table 2). As shown in Figs. 2 and 3, for both CDX1 and FAT4, a discordance in gene expression evaluation was observed between the commercial kit and USI primer in only 1 out of 10 analyzed samples.
Table 2.
Differential expression of CDX1 and FAT4 in gastric cancer patients using stem-loop (S. L) and gold standard (ABI) assays
| Gene | Expression | Std. Error | 95% C.I. | P-value of the two methods |
|---|---|---|---|---|
| GAPDH | 1.000 | |||
| CDX1-ABI | 0.303 | 0.049–1.433 | 0.012–5.415 | 0.1 |
| CDX1-S. L | 0.294 | 0.054–1.208 | 0.025–4.082 | |
| FAT4-ABI | 0.250 | 0.042–2.848 | 0.000–17.165 | 0.33 |
| FAT4-S. L | 0.230 | 0.025–2.114 | 0.005–8.106 |
Stem-loop primer efficiency, linearity, intra- and inter-assay variations
As shown in Fig. 4, all examined genes showed high real-time PCR efficiency with 94%, 92% and 103% efficiency for GAPDH, CDX1 and FAT4, respectively. There was a good correlation between obtained Cts and their respective RNA concentrations over three log10 RNA dilutions for all genes (r2 ≥ 0.99). The reproducibility assay was examined by performing 3 mRNA genes with 3 replicates. Coefficients of Variability (CV) were calculated by dividing the standard deviation by mean of plate × 100. For all examined genes, the reproducibility of tests was low in inter-assay (< 1.78%) and even lower in intra-assay (< 1.13%). Low CV values demonstrate the high precision of the assays and assure that the results are consistent throughout the study (Table 3).
Fig. 4.
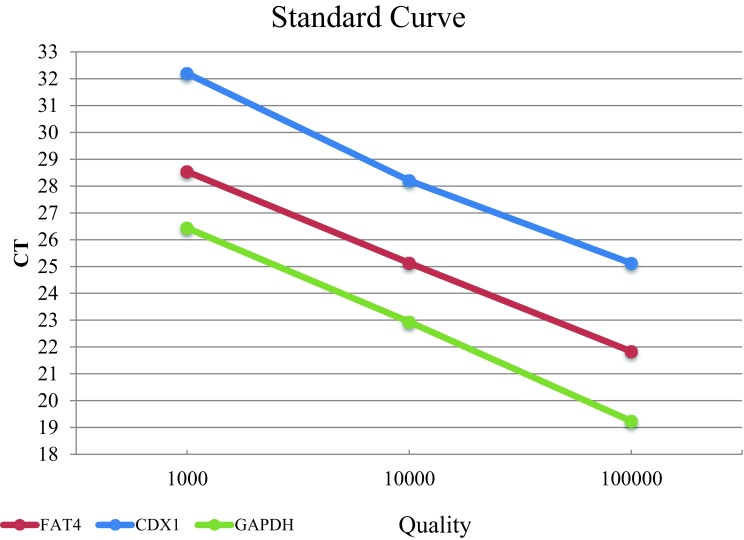
Standard curve of GAPDH, FAT4 and CDX1 expression. 10-fold dilutions of RNA were performed in the stem-loop RT-qPCR assay with the Ct values plotted against the log of the starting quantity of template for each gene
Table 3.
Inter and intra-assay coefficients of variation (CV), for GAPDH, CDX1 and FAT4 using stem-loop (S. L) assay
| Gene | No. of sample | Intra-Assay Ct Value† | Inter-Assay Ct Value†† | ||||
|---|---|---|---|---|---|---|---|
| Mean | SD | CV | Mean | SD | CV | ||
| GAPDH | S1 | 25.7789 | 0.10974 | 0.42 | 24.9314 | 0.443027 | 1.776 |
| S2 | 28.8764 | 0.09279 | 0.32 | 25.7948 | 0.202184 | 0.7838 | |
| S3 | 24.1048 | 0.20447 | 0.84 | 26.3664 | 0.104976 | 0.3981 | |
| CDX1 | S1 | 36.4837 | 0.2003 | 0.55 | 26.58683 | 0.38591 | 1.4515 |
| S2 | 34.1279 | 0.20896 | 0.61 | 27.71851 | 0.39556 | 1.4270 | |
| S3 | 32.2662 | 0.05873 | 0.18 | 29.31454 | 0.50508 | 1.7229 | |
| FAT4 | S1 | 31.33537 | 0.071005 | 0.22 | 26.95512 | 0.175833 | 0.6523 |
| S2 | 30.63667 | 0.335533 | 1.09 | 31.42642 | 0.177635 | 0.5652 | |
| S3 | 26.26987 | 0.318859 | 1.12 | 31.2516 | 0.228194 | 0.7301 | |
†3 repeats within one run
†† 3 different experiment runs performed on 3 days
Discussion
Investigation of the transcriptome and molecular pathways become increasingly important in monitoring of genes and may open new avenues to treatment strategies in different research areas including biomedicine, veterinary science, agriculture, pharmacology. Some of the established techniques, such as microarray and RNA-sequencing were applied to profile or quantify large numbers of genes (King and Sinha 2001; Mantione et al. 2014). However, these methods are expensive and not readily accessible to all. Unlike high throughput technologies, real-time PCR represents a cost-effective and rapid technique for quantifying gene expression. Noticeably, QPCR technology development provided a useful tool for discovering and characterizing the genetic information relative to a variety of diseases. An increasing number of laboratories are using real-time PCR technology for gene expression analysis. Currently, the two commonly used RNA detection methods in qPCR assessment are double-stranded DNA (dsDNA) binding dyes and fluorophore-labeled oligonucleotides. dsDNA binding dyes such as ethidium bromide (Higuchi et al. 1992), SYBR Green (Ririe et al. 1997), SYTO (Monis et al. 2005), EvaGreen (Mao et al. 2007), BEBO and BOXTO (Bengtsson et al. 2003) rely on binding of dyes to double-stranded DNA, and increases in fluorescence over a hundred fold are monitored throughout the cycles. These dyes enable binding to any dsDNA. Although this method is capable of assaying a wide range of mRNA expression in a high-throughput manner, it is less specific as the primer dimer and non-specific products are also detected (Bustin and Nolan 2004; Ginzinger 2002; Lind et al. 2006; Whitcombe et al. 1999; Wong and Medrano 2005). In contrast, fluorophore-labeled oligonucleotides detect only the targeted product and become the preferred choice for real-time PCR compared to dsDNA binding dyes. To date, many fluorophore-labeled oligonucleotides have been developed such as hydrolysis (Taqman) probes, molecular beacons, scorpions, eclipse probes, LUX PCR primers and QZyme PCR primers (Bengtsson et al. 2003; Kiss et al. 2006; Whitcombe et al. 1999). The main disadvantage of Taqman probes is their cost, as a specific probe must be synthesized for each target. While real-time PCR technology is continuously improved and its usefulness and versatility is proven, detection of RNA in qPCR remains a bottleneck process for labs and a limiting factor in choosing a low-cost or specific method that can successfully generate gene expression data. We have developed a simple, novel, low-cost and specific approach for mRNA expression profiling by adding USIs to cDNAs before any amplification. Distinctively, cDNAs having USIs represent a combination of the advantages of both fluorophore-labeled oligonucleotides and the dsDNA binding dye methods, i.e., the specificity of the probe-based primer and cost-effectiveness of the dsDNA binding dye method. USIs allowed amplification and quantification of cDNAs using the same probe for all examined cDNAs, with similar level of efficiency. For specificity and sensitivity investigation of this method, the expression of CDX1 and FAT4 in tumoral and non-tumoral tissues of gastric cancer patients was compared with probe-based commercial kit (ABI) which is generally considered as the gold standard (Wang et al. 2006). Like the commercial kit (ABI), this new approach indicated that the expression of both CDX1 and FAT4 were significantly down-regulated in most tumoral tissues which suggests that reduced CDX1 and FAT4 gene expression can trigger carcinogenesis. In support of our finding, another recent study has demonstrated that human FAT4 gene expression is decreased in gastric tumoral tissue. FAT4 is a tumor suppressor and prevents the growth and invasion of gastric cancer cells via inhibition of the Wnt/β-catenin signaling pathway as well as inactivation of YAP oncoprotein (Cai et al. 2015, Maet al. 2016). Qi et al. indicated that FAT4 was down-regulated in breast cancer via promoter methylation (Qi et al. 2009). Also, Rauch et al. demonstrated CpG island methylation of FAT4 in lung cancer (Rauch et al. 2012). Moreover, exome sequencing revealed that missense and nonsense somatic mutations were commonly found in FAT4 in melanoma cancer (Nikolaev et al. 2012). Also, CDX1 inhibits human colon cancer cell growth via cyclin D1 and β-catenin/TCF and its gene expression is repressed in colon cancer (Guo et al. 2004; Lynch et al. 2003). CDX1 can decrease gastric cancer cell growth by promoting apoptosis and cell cycle arrest and its expression is lost in gastric cancer (Li et al. 2014). In contrast, Bornschein et al. showed that the expression of CDX1 was not different in tumor and tumor-distant mucus, while CDX1 expression was significantly increased in tumor compared with normal patients (Bornschein et al. 2013). In the present study, the comparison of results obtained by SL assay and commercial kit demonstrated that there were no significant differences between SL assay and gold standard method. Therefore, suggesting that SL primer can replace gold standard and can be used for qualitative and quantitative real-time PCR assays with high stability. Moreover, we investigated the linearity and reproducibility of this assay. The data showed that there was a high linearity and reproducibility for all examined genes. Our method has some advantages over the other probes methods as a relatively small region within genes (at least 35 nucleotides) is needed for primer design. Furthermore, because all genes are quantified by USIs attached to cDNA, it avoids Taqman design parameters barrier such as identical Tm criteria, Ta temperature, length Criteria, GC content and amplicon length. Consequently, this method allows researchers to design real-time qPCR assays within the least time and to analyze many transcripts of virtually any organism.
In conclusion, we have developed and tested a convenient, cost-effective and specific method for gene expression analysis. The use of USIs exhibits the same sensitivity and specificity as the gold standard but reduces the costs for detection or quantification of multiple targets.
Abbreviations
- bp
base pair
- cDNA
complementary DNA
- Ct
cycle threshold
- CDX1
caudal type homeobox 1
- CV
coefficient of variability
- FAT4
FAT atypical cadherin 4
- GAPDH
Glyceraldehyde 3-phosphate dehydrogenase
- QPCR
quantitative polymerase chain reaction
- RT-PCR
reverse transcription polymerase chain reaction
- S. L
stem-loop
- Tm
melting temperature
- USI
unique sequence index
Compliance with ethical standards
Conflict of interests
Authors declare no conflict of interest.
Contributor Information
Sadegh Fattahi, Email: Fattahi_pgs@yahoo.com.
Maryam Pilehchian Langroudi, Email: maryam1661@gmail.com.
Ali Akbar Samadani, Email: a_a_hormoz@yahoo.com.
Novin Nikbakhsh, Email: novinsu@hotmail.com.
Mohsen Asouri, Email: Mohsen.asouri@yahoo.com.
Haleh Akhavan-Niaki, Phone: +989111255920, Email: Halehakhavan@yahoo.com.
References
- Adamski M G, Gumann P, Baird A E (2014) A method for quantitative analysis of standard and high-throughput qPCR expression data based on input sample quantity. PLoS One 9:e103917 [DOI] [PMC free article] [PubMed]
- Bengtsson M, Karlsson HJ, Westman G, Kubista M. A new minor groove binding asymmetric cyanine reporter dye for real-time PCR. Nucleic Acids Res. 2003;31 doi: 10.1093/nar/gng045. [DOI] [PMC free article] [PubMed] [Google Scholar]
- Bornschein J, Toth K, Selgrad M, Kuester D, Wex T, Molnar B, Tulassay Z, Malfertheiner P. Dysregulation of CDX1, CDX2 and SOX2 in patients with gastric cancer also affects the non-malignant mucosa. J Clin Pathol. 2013;66:819–822. doi: 10.1136/jclinpath-2013-201448. [DOI] [PubMed] [Google Scholar]
- Bustin SA, Nolan T. Pitfalls of quantitative real-time reverse-transcription polymerase chain reaction. J Biomol Tech. 2004;15:155–166. [PMC free article] [PubMed] [Google Scholar]
- Cai J, Feng D, Hu L, Chen H, Yang G, Cai Q, Gao C, Wei D. FAT4 functions as a tumour suppressor in gastric cancer by modulating Wnt/beta-catenin signalling. Br J Cancer. 2015;113:1720–1729. doi: 10.1038/bjc.2015.367. [DOI] [PMC free article] [PubMed] [Google Scholar]
- Fattahi S, Amirbozorgi G, Lotfi M, Amini Navaei B, Kavoosian S, Asouri M, Akhavan-Niaki H (2017) Development of a universal Taqman probe for mRNA Gene expression analysis Iranian journal of science and technology, Transactions A: Science (In Press)
- Gibson U, Heid CA, Williams PM. A novel method for real time quantitative RT-PCR. Genome Res. 1996;6:995–1001. doi: 10.1101/gr.6.10.995. [DOI] [PubMed] [Google Scholar]
- Ginzinger DG. Gene quantification using real-time quantitative PCR: an emerging technology hits the mainstream. Exp Hematol. 2002;30:503–512. doi: 10.1016/S0301-472X(02)00806-8. [DOI] [PubMed] [Google Scholar]
- Guo RJ, Huang E, Ezaki T, Patel N, Sinclair K, Wu J, Klein P, Suh ER, Lynch JP. Cdx1 inhibits human colon cancer cell proliferation by reducing beta-catenin/T-cell factor transcriptional activity. J Biol Chem. 2004;279:36865–36875. doi: 10.1074/jbc.M405213200. [DOI] [PubMed] [Google Scholar]
- Heid CA, Stevens J, Livak KJ, Williams PM. Real time quantitative PCR. Genome Res. 1996;6:986–994. doi: 10.1101/gr.6.10.986. [DOI] [PubMed] [Google Scholar]
- Higuchi R, Dollinger G, Walsh PS, Griffith R. Simultaneous amplification and detection of specific DNA sequences. Biotechnology (N Y) 1992;10:413–417. doi: 10.1038/nbt0492-413. [DOI] [PubMed] [Google Scholar]
- Hryniuk A, Grainger S, Savory JG, Lohnes D. Cdx1 and Cdx2 function as tumor suppressors. J Biol Chem. 2014;289:33343–33354. doi: 10.1074/jbc.M114.583823. [DOI] [PMC free article] [PubMed] [Google Scholar]
- Ito T, Taniguchi H, Fukagai K, Okamuro S, Kobayashi A. Inhibitory mechanism of FAT4 gene expression in response to actin dynamics during Src-induced carcinogenesis. PLoS One. 2015;10:e0118336. doi: 10.1371/journal.pone.0118336. [DOI] [PMC free article] [PubMed] [Google Scholar]
- Kang JM, Lee BH, Kim N, Lee HS, Lee HE, Park JH, Kim JS, Jung HC, Song IS. CDX1 and CDX2 expression in intestinal metaplasia, dysplasia and gastric cancer. J Korean Med Sci. 2011;26:647–653. doi: 10.3346/jkms.2011.26.5.647. [DOI] [PMC free article] [PubMed] [Google Scholar]
- Khan J, Wei JS, Ringner M, Saal LH, Ladanyi M, Westermann F, Berthold F, Schwab M, Antonescu CR, Peterson C. Classification and diagnostic prediction of cancers using gene expression profiling and artificial neural networks. Nat Med. 2001;7:673–679. doi: 10.1038/89044. [DOI] [PMC free article] [PubMed] [Google Scholar]
- King HC, Sinha AA. Gene expression profile analysis by DNA microarrays: promise and pitfalls. JAMA. 2001;286:2280–2288. doi: 10.1001/jama.286.18.2280. [DOI] [PubMed] [Google Scholar]
- Kiss I, German P, Sami L, Antal M, Farkas T, Kardos G, Kecskemeti S, Dan A, Belak S. Application of real-time RT-PCR utilising lux (light upon extension) fluorogenic primer for the rapid detection of avian influenza viruses. Acta Vet Hung. 2006;54:525–533. doi: 10.1556/AVet.54.2006.4.10. [DOI] [PubMed] [Google Scholar]
- Krumlauf R. Analysis of gene expression by northern blot. Mol Biotechnol. 1994;2:227–242. doi: 10.1007/BF02745879. [DOI] [PubMed] [Google Scholar]
- Li T, Lu YY, Zhao XD, Guo HQ, Liu CH, Li H, Zhou L, Han YN, Wu KC, Nie YZ, Shi YQ, Fan DM. MicroRNA-296-5p increases proliferation in gastric cancer through repression of caudal-related homeobox 1. Oncogene. 2014;33:783–793. doi: 10.1038/onc.2012.637. [DOI] [PubMed] [Google Scholar]
- Lind K, Stahlberg A, Zoric N, Kubista M. Combining sequence-specific probes and DNA binding dyes in real-time PCR for specific nucleic acid quantification and melting curve analysis. BioTechniques. 2006;40:315–319. doi: 10.2144/000112101. [DOI] [PubMed] [Google Scholar]
- Livak KJ, Schmittgen TD. Analysis of relative gene expression data using real-time quantitative PCR and the 2(−Delta Delta C(T)) method. Methods. 2001;25:402–408. doi: 10.1006/meth.2001.1262. [DOI] [PubMed] [Google Scholar]
- Lynch J, Keller M, Guo RJ, Yang D, Traber P. Cdx1 inhibits the proliferation of human colon cancer cells by reducing cyclin D1 gene expression. Oncogene. 2003;22:6395–6407. doi: 10.1038/sj.onc.1206770. [DOI] [PubMed] [Google Scholar]
- Ma L, Cui J, Xi H, Bian S, Wei B, Chen L. Fat4 suppression induces yap translocation accounting for the promoted proliferation and migration of gastric cancer cells. Cancer Biol Ther. 2016;17:36–47. doi: 10.1080/15384047.2015.1108488. [DOI] [PMC free article] [PubMed] [Google Scholar]
- Mantione KJ, Kream RM, Kuzelova H, Ptacek R, Raboch J, Samuel JM, Stefano GB. Comparing bioinformatic gene expression profiling methods: microarray and RNA-Seq. Med Sci Monit Basic Res. 2014;20:138–142. doi: 10.12659/MSMBR.892101. [DOI] [PMC free article] [PubMed] [Google Scholar]
- Mao F, Leung W, YXin X. Characterization of EvaGreen and the implication of its physicochemical properties for qPCR applications. BMC Biotechnol. 2007;7:76. doi: 10.1186/1472-6750-7-76. [DOI] [PMC free article] [PubMed] [Google Scholar]
- Martin CM, Astbury K, Mcevoy L, O’toole S, Sheils O, O’leary JJ. Gene expression profiling in cervical cancer: identification of novel markers for disease diagnosis and therapy. Methods Mol Biol. 2009;511:333–359. doi: 10.1007/978-1-59745-447-6_15. [DOI] [PubMed] [Google Scholar]
- Mayfield RD, Harris RA. Gene expression profiling in blood: new diagnostics in alcoholism and addiction? Neuropsychopharmacology. 2009;34:250–251. doi: 10.1038/npp.2008.162. [DOI] [PMC free article] [PubMed] [Google Scholar]
- Monis PT, Giglio S, Saint CP. Comparison of SYTO9 and SYBR green I for real-time polymerase chain reaction and investigation of the effect of dye concentration on amplification and DNA melting curve analysis. Anal Biochem. 2005;340:24–34. doi: 10.1016/j.ab.2005.01.046. [DOI] [PubMed] [Google Scholar]
- Morey JS, Ryan JC, Van Dolah FM. Microarray validation: factors influencing correlation between oligonucleotide microarrays and real-time PCR. Biological procedures online. 2006;8:175–193. doi: 10.1251/bpo126. [DOI] [PMC free article] [PubMed] [Google Scholar]
- Murphy J, Bustin SA. Reliability of real-time reverse-transcription PCR in clinical diagnostics: gold standard or substandard? Expert Rev Mol Diagn. 2009;9:187–197. doi: 10.1586/14737159.9.2.187. [DOI] [PubMed] [Google Scholar]
- Nikolaev SI, Rimoldi D, Iseli C, Valsesia A, Robyr D, Gehrig C, Harshman K, Guipponi M, Bukach O, Zoete V, Michielin O, Muehlethaler K, Speiser D, Beckmann JS, Xenarios I, Halazonetis TD, Jongeneel CV, Stevenson BJ, Antonarakis SE. Exome sequencing identifies recurrent somatic MAP2K1 and MAP2K2 mutations in melanoma. Nat Genet. 2012;44:133–139. doi: 10.1038/ng.1026. [DOI] [PubMed] [Google Scholar]
- Qi C, Zhu YT, Hu L, Zhu YJ. Identification of Fat4 as a candidate tumor suppressor gene in breast cancers. Int J Cancer. 2009;124:793–798. doi: 10.1002/ijc.23775. [DOI] [PMC free article] [PubMed] [Google Scholar]
- Rauch TA, Wang Z, Wu X, Kernstine KH, Riggs AD, Pfeifer GP. DNA methylation biomarkers for lung cancer. Tumour Biol. 2012;33:287–296. doi: 10.1007/s13277-011-0282-2. [DOI] [PubMed] [Google Scholar]
- Ririe KM, Rasmussen RP, Wittwer CT. Product differentiation by analysis of DNA melting curves during the polymerase chain reaction. Anal Biochem. 1997;245:154–160. doi: 10.1006/abio.1996.9916. [DOI] [PubMed] [Google Scholar]
- Samadani AA, Nikbakhsh N, Fattahi S, Pourbagher R, Aghajanpour Mir SM, Mousavi Kani N, Abedian Z, Akhavan-Niaki H. RNA extraction from animal and Human’s cancerous tissues: does tissue matter? Int J Mol Cell Med. 2015;4:54–59. [PMC free article] [PubMed] [Google Scholar]
- Ståhlberg A, Kubista M, Åman P. Single-cell gene-expression profiling and its potential diagnostic applications. Expert Rev Mol Diagn. 2011;11:735–740. doi: 10.1586/erm.11.60. [DOI] [PubMed] [Google Scholar]
- Suh E, Traber PG. An intestine-specific homeobox gene regulates proliferation and differentiation. Mol Cell Biol. 1996;16:619–625. doi: 10.1128/MCB.16.2.619. [DOI] [PMC free article] [PubMed] [Google Scholar]
- Tarca AL, Romero R, Draghici S. Analysis of microarray experiments of gene expression profiling. Am J Obstet Gynecol. 2006;195:373–388. doi: 10.1016/j.ajog.2006.07.001. [DOI] [PMC free article] [PubMed] [Google Scholar]
- Wang Y, Barbacioru C, Hyland F, Xiao W, Hunkapiller KL, Blake J, Chan F, Gonzalez C, Zhang L, Samaha RR. Large scale real-time PCR validation on gene expression measurements from two commercial long-oligonucleotide microarrays. BMC Genomics. 2006;7:59. doi: 10.1186/1471-2164-7-59. [DOI] [PMC free article] [PubMed] [Google Scholar]
- Whitcombe D, Theaker J, Guy SP, Brown T, Little S. Detection of PCR products using self-probing amplicons and fluorescence. Nat Biotechnol. 1999;17:804–807. doi: 10.1038/11751. [DOI] [PubMed] [Google Scholar]
- Wong ML, Medrano JF. Real-time PCR for mRNA quantitation. BioTechniques. 2005;39:75–85. doi: 10.2144/05391RV01. [DOI] [PubMed] [Google Scholar]
- Zhang R, Kang KA, Kim KC, Na SY, Chang WY, Kim GY, Kim HS, Hyun JW. Oxidative stress causes epigenetic alteration of CDX1 expression in colorectal cancer cells. Gene. 2013;524:214–219. doi: 10.1016/j.gene.2013.04.024. [DOI] [PubMed] [Google Scholar]