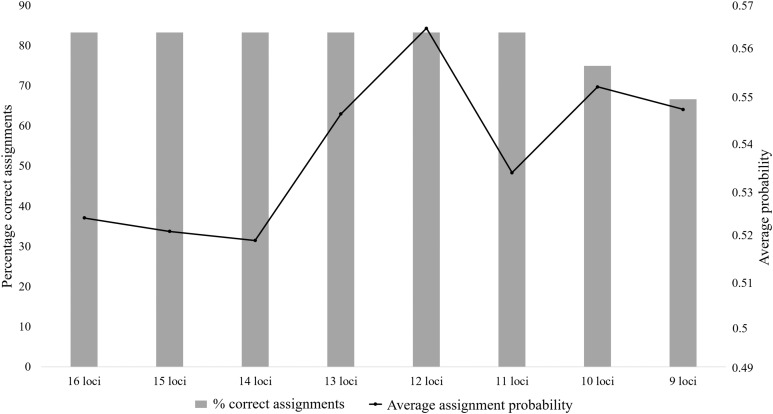
Figure 3. The assignment success rates for the eight microsatellite panels following the partial Bayesian exclusion analyses performed to assign Poicephalus robustus specimens to their area of origin.
The black line represents the average assignment probability calculated from the correctly assigned specimens’ probability values. The exact probability values for the assignments conducted with each of the eight panels are available in Table S5.

