

Abstract
Survival of glioma (GBM) patients treated with the current standard of care remains dismal. Immunotherapeutic approaches that harness the cytotoxic and memory potential of the host immune system have shown great benefit in other cancers. GBMs have developed multiple strategies, including the accumulation of myeloid-derived suppressor cells (MDSCs) to induce immunosuppression. It is therefore imperative to develop multipronged approaches when aiming to generate a robust anti-tumor immune response. Herein, we tested whether combining MDSC depletion or checkpoint blockade would augment the efficacy of immune-stimulatory herpes simplex type-I thymidine kinase (TK) plus Fms-like tyrosine kinase ligand (Flt3L)-mediated immune stimulatory gene therapy. Our results show that MDSCs constitute >40% of the tumor-infiltrating immune cells. These cells express IL-4Rα, inducible nitric oxide synthase (iNOS), arginase, programmed death ligand 1 (PDL1), and CD80, molecules that are critically involved in antigen-specific T cell suppression. Depletion of MDSCs strongly enhanced the TK/Flt3L gene therapy-induced tumor-specific CD8 T cell response, which lead to increased median survival and percentage of long-term survivors. Also, combining PDL1 or CTLA-4 immune checkpoint blockade greatly improved the efficacy of TK/Flt3L gene therapy. Our results, therefore, indicate that blocking MDSC-mediated immunosuppression holds great promise for increasing the efficacy of gene therapy-mediated immunotherapies for GBM.
Keywords: glioma, myeloid cells, immunotherapy, tumor microenvironment, gene therapy
Graphical Abstract
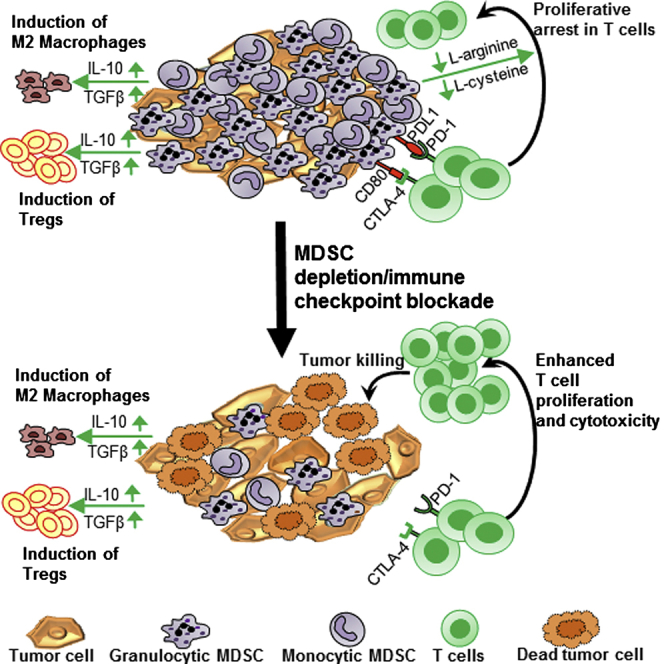
Kamran and colleagues provide compelling evidence that shows that inhibiting the critical immunosuppressive myeloid network in the glioma (GBM) tumor microenvironment enhances the efficacy of the immune stimulatory gene therapy, thereby enabling robust anti-GBM immunity to inhibit brain cancer progression and elicit long-term survival of GBM-bearing mice.
Introduction
Malignant brain tumors (gliomas [GBMs]) are highly aggressive and immunosuppressive cancers.1, 2, 3, 4, 5 Despite implementing the current standard of care, which includes resection followed by radiotherapy and chemotherapy with temozolomide, GBMs still carry a dismal median survival of 14.2 months.5, 6 Robust and durable clinical benefits of immunotherapeutic strategies in tumors such as melanoma, prostate cancer, and leukemia have been achieved, and this has driven research efforts into developing a variety of immunotherapeutic strategies for GBMs.2, 7, 8, 9, 10, 11, 12
While, traditionally, it was accepted that the CNS was an immune-privileged organ, recent research has challenged that dogma.4 The evidence for permeability of the blood-brain barrier (BBB) under conditions of inflammation and tumor growth, such as in GBMs, the presence of lymphatic drainage, and the antigen-presenting ability of microglial cells reveals a more dynamic interaction of the central nervous system (CNS) with the systemic immune system.13, 14, 15, 16 Arming the immune system to mount a robust anti-tumor response is an attractive therapeutic approach, since the cytotoxic and memory responses of its effector cell populations can be specifically targeted to the tumor cells in the brain parenchyma.
Aiming to harness the power of immune stimulatory approaches to implement more effective treatments for GBMs, we developed a combined conditionally cytotoxic immune stimulatory gene therapy strategy for GBMs that is currently being tested in a phase I clinical trial at our institution (https://clinicaltrials.gov; identifier: NCT01811992).17, 18, 19, 20 The gene therapy approach entails using adenoviruses (Ads) encoding herpes simplex virus type-I thymidine kinase (Ad-TK) and Fms-like tyrosine kinase 3 ligand (Flt3L), which are injected into the tumor followed by ganciclovir (GCV) administration. Thymidine kinase converts GCV to its active metabolite, which leads to tumor cell lysis, with concomitant release of tumor antigens and damage-associated molecular pattern molecules, i.e., HMGB1.18, 19, 21, 22 Flt3L mediates dendritic cell (DC) recruitment and expansion into the tumor microenvironment (TME). The DCs pick up the tumor antigen, traffic it to the draining lymph nodes, and prime a robust anti-tumor cytotoxic and memory T cell response, leading to tumor regression and long-term survival.18, 19
Gliomas have been shown to employ a variety of mechanisms to suppress the immune system, such as downregulation of MHC class I molecules, production of transforming growth factor-β (TGF-β), vascular endothelial growth factor (VEGF), prostaglandin E2, and IL-10, expression of ligands of checkpoint receptors, such as PD-1, and accumulation of immunosuppressive cells, such as myeloid-derived suppressor cells (MDSCs), regulatory T cells (Tregs), and tumor-associated macrophages (TAMs).23, 24, 25, 26, 27, 28, 29, 30 It has been previously shown in human samples and experimental GBM models that MDSCs are powerful inhibitors of anti-tumor immune responses.30, 31 Through a variety of mechanisms that inhibit T cell activation and expansion, including the production of arginase and inducible nitric oxide synthase (iNOS), reactive oxygen species and/or reactive nitrogen species (ROS and/or RNS), release of IL-10, expansion of regulatory T cells (Tregs), and inhibition of T cell migration, MDSCs have been shown to promote immunosuppression and tumor progression.32, 33, 34, 35, 36 Targeting specific mechanisms of immune suppression are critical to increasing the effectiveness of immunotherapies. Herein, we aimed to test the hypothesis that MDSCs accumulate in the GBM TME and inhibit tumor-specific immunity. Thus, we hypothesized that blocking MDSC accumulation in the GBM TME would enhance the TK/Flt3L-induced anti-tumor T cell immunity. Also, expression of checkpoint receptor ligands by glioma cells and tumor-infiltrating MDSCs, such as programmed death ligand-1 and CD80, restrict the priming and activation of anti-GBM T cell responses.37 A combinatorial approach aiming to activate anti-GBM immunity and abolish immunosuppressive cells and immune checkpoints would thus provide a powerful therapeutic strategy against GBMs. We therefore tested the impact on the therapeutic efficacy and long-term survival of combining MDSC depletion or programmed death ligand 1 (PDL1) or CTLA-4 blockade with the TK/Flt3L gene therapy. Our data show that GBMs induce the accumulation of massive quantities (40%–80% of the tumor-infiltrating immune cell population) of immunosuppressive MDSCs within the TME and that blocking MDSC accumulation or abolishing MDSC-mediated immune suppression through PDL1 or CTLA-4 blockade greatly augments the efficacy of immune-stimulatory gene therapy. These combination strategies lead to enhanced CD8 T cell responses, improved median survival, and an increased percentage of long-term survivors. Thus, our results provide evidence supporting the development of combination immune-stimulatory strategies aimed at overcoming GBM-induced immune suppression and the use of checkpoint inhibitors in GBMs. Since the TK/Flt3L gene therapy is already in clinical trials (https://clinicaltrials.gov; Identifier: NCT01811992) and clinical-grade reagents for checkpoint blockade inhibitors are readily available, translating this combinatorial approach from bench to bedside should be possible in the near future.
Results
GBMs Induce MDSC Expansion in Bone Marrow Culture In Vitro and in the GBM TME In Vivo
Various preclinical studies have demonstrated that immunotherapeutic strategies, such as gene therapy,38 passive immunotherapy,39 adoptive T cell transfer with T cells activated against tumor antigens, or chimeric antigen receptor (CAR)-engineered T cells,40, 41, 42 can be successful in animal models of GBM. However, glioma cells utilize a variety of mechanisms to escape from the anti-tumor immune response, such as the downregulation of MHC class I molecules, production of TGF-β, VEGF, prostaglandin E2, and IL-10, and accumulation of immunosuppressive cells, such as MDSCs, regulatory T cells (Tregs), and tumor-associated macrophages (TAMs).32, 33 MDSC accumulation has been associated with tumor burden, metastatic stage, and diminished overall survival in a range of tumor types, and expansion of circulating MDSCs has been observed in glioma patients.30, 31, 43 Therefore, we set out to assess if secreted factors by GBM cells in culture could induce the expansion of immature myeloid cells from bone marrow cultures (BMCs) in vitro. When we cultured bone marrow cells with GBM cell culture supernatant, a 1.4-fold expansion of MDSCs was observed (p < 0.01, Figure 1A). To study the impact of MDSCs on anti-GBM immunity, we examined the myeloid cell compartment in a syngeneic GL26 GBM model in immunocompetent C57BL/6 mice (Figure 1). TME-infiltrating immune cells were identified as CD45high cells; MDSCs were identified as CD11b+/Gr 1+ cells within CD45high cells. Strikingly, 40% of the CD45high cells in the GBM TME were composed of CD11b+/Gr 1+ MDSCs (Figure 1B). MDSCs were further identified as granulocytic (Gr-1high) or monocytic (Gr-1low) MDSCs. H&E staining of cytospin preparation of MDSCs purified from GL26 tumor showed the characteristic polymorphonuclear and monocytic nuclear shapes for Gr-1high and Gr-1low cells (Figure 1B). GL26 tumors showed similar levels of the Gr-1high and Gr-1low lineages (Figure 1B). To advance our understanding about their lineage commitment and immunosuppressive potential, we used the pan macrophage (F4/80) and pan DC (CD11c) markers. Based on the expression of F4/80 and CD11c, we identified four distinct populations of myeloid cells within the CD11b+/Gr-1+ population (Figure 1C): cells that expressed only CD11c (CD11c+ cells), cells that expressed only F4/80 (F4/80+ cells), cells that expressed both CD11c and F4/80 (DP), and cells that did not express either CD11c or F4/80. The greatest expansion of DP cells was seen in GL26 tumors (Figure 1C). Interestingly we also observed a 3.2-fold expansion of MDSCs in the spleens of moribund GL26 tumor-bearing mice, suggesting the occurrence of extramedullary hematopoiesis compared to wild-type (WT) mice (p < 0.01; Figure 1D). No significant expansion of circulating MDSCs was observed in GL26 tumor-bearing mice (Figure 1E).
Figure 1.

GBM Induces MDSC Expansion in Bone Marrow Culture In Vitro and in the GBM TME In Vivo
(A) Bone marrow cells were cultured with conditioned media (CM) from 3T3 cells or GL26 GBM cells. MDSC expansion was analyzed on day 6 of the culture. MDSCs were identified as CD11b+, Gr-1+ cells within CD45+ cells. Data were analyzed using Student’s t test, and mean ± SEM are shown. (B–E) MDSCs were examined in the TME, spleen, and blood of moribund C57BL/6 mice bearing GL26 tumors. Mice injected with PBS in the same stereotactic coordinates and euthanized at day 30 post implantation were used as control animals (WT). (B) Total CD11b+/Gr-1+ MDSCs were also analyzed for the proportions of Gr-1high (Ly6G+, Ly6Clow) and Gr-1low (Ly6G−, Ly6Chigh) cells. Representative images show cytospin analysis of Gr-1high and Gr-1low cells isolated from the TME. (C) CD11b+, Gr-1+ cells were further differentiated on the basis of F4/80 and CD11c expression into F4/80+, CD11c+, double-negative, (DN) and double-positive (DP) cells. (D and E) MDSC expansion in the spleen (D) and blood (E) was analyzed from mice as in (B). Dot plots show representative flow stains from each tumor type. Graphs show the data combined from 4–5 animals per group. Mean ± SEM are shown. For total MDSC analysis, data were analyzed using Student’s t test. For Gr-1high and Gr-1low cells, data were analyzed using one-way ANOVA, followed by Tukey’s test for multiple comparisons. *p < 0.05; **p < 0.01; ****p < 0.001; ns, not significant.
To test whether MDSC expansion was a universal phenomenon across several GBM models, we also analyzed MDSC expansion in M7 and OL61 neurosphere-induced GBM models. M7 and OL61 neurospheres were derived from sleeping beauty transposase system-induced tumors in wild-type mice.44, 45 While M7 tumors were generated using NRASG12V and SV40-large T antigen plasmids, OL61 tumors contained NRASG12V, short hairpin (sh)-targeting p53, and platelet-derived growth factor β (PDGFβ) overexpression.44 Almost 80% of the CD45high compartment was comprised of MDSCs (Figure S1A). The proportion of Gr-1low cells in M7 and OL61 tumors was 1.3-fold (p < 0.05) and 1.4-fold (p < 0.01) higher than that of the Gr-1high cells (Figure S1A). F4/80+ cells were the dominant myeloid population in M7 tumors (48% of the CD11b+/Gr-1+ population), while the CD11c+ population was observed to be highest in OL61 tumors (12% of the CD11b+/Gr-1+ population; Figure S1B). In contrast, no expansion of splenic MDSCs was seen in M7 and OL61 spleens (Figure S1C). Circulating MDSCs were expanded in OL61 tumor-bearing mice (Figure S1D).
Thus, MDSCs constitute the dominant population of the TME-infiltrating immune cells in a variety of GBM models; this myeloid cell compartment was composed of highly heterogeneous lineages whose expansion is potentially influenced by the distinct tumor microenvironments of three GBM models tested.
TME-Infiltrating MDSCs Express T Cell-Immunosuppressive Molecules, Such as IL-4Rα, Arginase, and iNOS
Signaling through IL-4Rα has been shown to activate STAT1, STAT3, and STAT6 transcription factors, which regulates the production of TGF-β, arginase, and ROS and/or RNS.46 IL-4Rα expressing myeloid cell expansion has been observed in cancer patients. Furthermore, SNPs in IL-4Rα gene are associated with better survival in GBM patients.47 GL26 cells and M7 and OL61 neurospheres do not produce interleukin 4 (IL-4) (Figure S2), and the most likely source of IL-4 is CD4 T cells, mast cells, or TME-infiltrating eosinophils.48 Arginase and iNOS metabolize arginine and deplete it from the extracellular environment, thereby interfering with the expression of the CD3ζ chain and preventing the upregulation of cell-cycle regulators cyclin D3 and cdk4, thus inhibiting T cell proliferation (Figure 2A).34 Therefore, we examined the expression of IL-4Rα on splenic and TME-infiltrating MDSCs. GL26 TME-MDSCs showed a 12-fold increase (p < 0.001) in IL-4Rα expression compared to splenic myeloid cells (Figure 2B). We then assessed the expression of iNOS and arginase on CD11b+, Gr-1+ MDSCs from the spleen and the TME of the various GBM models. GL26 TME-MDSCs showed a 6.5-fold (p < 0.001) increase in arginase expression compared to splenic MDSCs (Figure 2C). A small induction in iNOS expression was observed in GL26 TME-MDSCs (p < 0.05, Figure 2C). An increase in IL-4Rα expression was also observed in TME-MDSCs from M7 and OL61 models compared to the corresponding splenic MDSCs (p < 0.001, Figure S3A). M7 and OL61 TME-derived MDSCs showed a 14-fold (p < 0.01) and 3.5-fold (p < 0.01) induction in arginase expression compared to corresponding splenic-MDSCs (Figure S3B). M7 TME-MDSCs showed the greatest increase in iNOS by 14.2-fold (p < 0.001), while no increase in iNOS expression on TME-MDSCs from OL61 models was observed (Figure S3B). Overall, GBM TME-infiltrating MDSCs expressed high levels of molecules involved in eliciting T cell suppression, and we next tested the immunosuppressive potential of the GBM TME-infiltrating and splenic MDSCs.
Figure 2.

TME-Infiltrating MDSCs Express T Cell Immunosuppressive Molecules, Such as IL-4Rα, Arginase, and iNOS
(A) Model depicting how signaling through IL-4Rα can induce arginase expression. Arginase and iNOS metabolize arginine and deplete it from the extracellular environment, thus creating a deficiency of this amino acid for T cells. (B and C) Surface expression of IL-4Rα (B) and intracellular levels of arginase and iNOS (C) on tumor-infiltrating and splenic CD11b+/Gr-1+ MDSCs from GL26 tumor-bearing mice was determined by flow staining at moribund stage. In (B) and (C), the dot plots show the gating for CD11b+/Gr-1+ cells from GL26 spleen and tumor. The gray-shaded histograms represent staining for the corresponding marker on splenic MDSCs, while the thick black line shows the staining pattern on MDSCs from the tumor. The black-dashed and -dotted lines show staining for isotype controls on splenic and tumor MDSCs, respectively. Bar graphs show the geometric MFI values for IL-4Rα, arginase, and iNOS on splenic and TME-derived MDSCs normalized to MFI for isotype stains. 4–5 tumor-bearing animals were analyzed in each group. Data were analyzed using paired Student’s t test. Mean ± SEM are indicated. *p < 0.05; ****p < 0.001.
The Glioma Microenvironment Determines Myeloid Cell-Mediated Immunosuppression
MDSCs from the TME and the spleen were observed to be phenotypically distinct with regard to the expression of key immunosuppressive enzymes, such as iNOS and arginase, suggesting that TME-MDSCs may be distinct from the splenic MDSCs with regard to inducing T cell suppression. We next examined how the expression of these enzymes would relate with the T cell-suppressive potential of TME-infiltrating or splenic MDSCs. To do this, MDSCs purified from the TME or the spleens of GL26 tumor-bearing animals were cultured with 5-(and 6)-carboxyfluorescein diacetate succinimidyl ester (CFSE)-labeled OT-1 splenocytes that were then stimulated with the cognate peptide SIINFEKL (Figure 3A). T cells from the OT-1 mice are engineered to recognize the SIINFEKL peptide, and almost 100% of the T cells underwent cell division in response to SIINFEKL stimulation (Figure 3B). When Gr-1high or Gr-1low CD11b+ MDSCs from the TME of GL26 tumors were added to the culture, the percentage of T cells that proliferated in response to the peptide was reduced to ∼40% (p < 0.001; Figure 3B). Gr-1low cells were more effective at inhibiting antigen-specific T cell proliferation compared to Gr-1high cells and at ratios of two or four T cells to one Gr-1low MDSC, only 30%–40% of T cells underwent proliferation (p < 0.005; Figure 3B). Also, in accordance with our data regarding the phenotypic distinction with regard to IL-4Rα, arginase, and iNOS expression between the TME-derived and splenic MDSCs, we did not see any effect of splenic MDSCs on antigen-specific T cell proliferation (Figure 3B). Furthermore, MDSCs isolated from spleens and bone marrow from WT mice also did not inhibit T cell proliferation in response to antigen stimulation (Figure 3C), suggesting that, while present in WT animals, the CD11b+, Gr-1+ cells are progenitors of myeloid lineages that lack immunosuppressive potential and that tumors have the ability to skew these immature myeloid cells to an immunosuppressive phenotype.
Figure 3.

GBM TME-Infiltrating MDSCs Elicit Inhibition of Antigen-Specific T Cell Expansion
(A) Diagram depicting the experimental design to analyze the immunosuppressive potential of myeloid cells. (B and C) Gr-1high and Gr-1low MDSCs purified from the TME and spleens of moribund GL26 tumor-bearing mice (B) or the spleen and bone marrow (BM) of WT mice (C) were cultured with CFSE-labeled splenocytes from Rag2/OT-1 transgenic mice. Cultures were stimulated with 100 nM SIINFEKL peptide for 4 days, after which proliferation was analyzed by flow cytometry. Flow plots show representative CFSE stains from unstimulated splenocytes (T only), splenocytes undergoing rapid proliferation in response to SIINFEKL (T + pep), and the effect on SIINFEKL-induced T cell proliferation in the presence of MDSCs from the TME, spleen, or BM. Numbers in parentheses indicate the ratio of splenocytes to MDSCs. Graphs show data combined together from 2–3 experiments. Tumors and spleens from 3–5 mice were pooled together for each experiment to obtain sufficient number of Gr-1high and Gr-1low myeloid cells. Mean ± SEM are indicated. Data were analyzed using one-way ANOVA, followed by Tukey’s multiple comparisons. ***p < 0.005; ****p < 0.001.
Depletion of MDSCs Enhances the Efficacy of Conditionally Cytotoxic Immune-Stimulatory Gene Therapy
Our data showed that the GBM TME was infiltrated with massive quantities of MDSCs, which can exert powerful tumor antigen-specific T cell suppression. Thus, we wished to test the hypothesis that, by depleting MDSCs, it would be possible to enhance the efficacy of immunotherapies. We previously developed a conditionally cytotoxic (TK+GCV)-immune stimulatory (FLT3L) gene therapy approach that is currently being tested in a phase I clinical trial at our institution (https://clinicaltrials.gov; Identifier: NCT01811992).18, 19, 20, 21 The success of this gene therapy approach relies on the generation of a robust anti-GBM cytotoxic and memory T cell response; thus, we wished to assess whether the presence of such large numbers of immunosuppressive MDSCs would interfere with the anti-GBM T cell response induced by the gene therapy. If our hypothesis was correct, then the efficacy of the gene therapy would be enhanced after depleting MDSCs. To this end, we made use of Gr-1-depleting antibody.49, 50 The effect of MDSC depletion was examined in combination with immune-stimulatory TK/Flt3L gene therapy in the GL26 model harboring the surrogate tumor antigen, ovalbumin (OVA), which allowed us to monitor the generation of tumor-specific T cells using the H2Kb-tetramer. Gr-1 antibody administration resulted in the depletion of CD11b+/Gr-1+ cells from the tumor, spleen, and blood of GL26 tumor-bearing animals; no effect was observed on the frequency of F4/80+ or CD11c+ cells (Figure 4A). Administration of TK/Flt3L gene therapy to GL26 tumor-bearing mice induced a 4-fold increase in the percentage of TME-infiltrating CD11c+ DCs (p < 0.05 for saline + Rat immunoglobulin G [IgG] versus TF + Rat IgG; Figure S4). Additionally, combination of Gr-1-depleting antibody with TK/Flt3L gene therapy did not have any effect on the infiltration of CD11c+ DCs to the TME (p > 0.05 for TF + Rat IgG versus TF + Gr-1 depletion; Figure S4). The depletion efficacy was sustained for approximately 4 days, after which the MDSCs reappeared in the spleen and circulation. Gr-1-depleting antibody was administered such that the depletion of MDSCs would coincide with the peak of TK/Flt3L-induced T cell response, which previous studies from our lab have shown to occur at 7 days post immune-mediated gene therapy (Figure 4B).18, 20 Administration of Gr-1-depleting antibody to mice bearing GL26-OVA tumors did not confer any survival benefit (p > 0.05 for saline + isotype control, median survival [MS] = 32 days versus saline + Gr-1 antibody, MS = 35 days; Figure 4C). Gr-1 antibody administration to TK/Flt3L-treated GL26-OVA tumor-bearing mice significantly enhanced the efficacy of the gene therapy. While 50% of the TK/Flt3L-treated GL26-OVA tumor-bearing animals were alive at 55 days post tumor implantation, 77% of the TK/Flt3L + Gr-1 depletion-treated animals survived long term (Figure 4C). Of note, starting the administration of the Gr-1-depleting antibody to GL26 tumor-bearing animals at 11 days post tumor implantation did increase the median survival time, indicating that early intervention with the Gr-1-depleting antibody as a single agent to deplete MDSCs can provide survival benefit (p < 0.01 for isotype control, MS = 31 days versus Gr-1 antibody, MS = 37 days; Figure S5). The effect of MDSC depletion was also tested in mice bearing tumors generated with the parental GL26 cells in the absence of the strong surrogate antigen OVA. Gr-1 antibody administration to TK/Flt3L-treated GL26 tumor-bearing mice significantly enhanced the efficacy of the gene therapy. While 40% of the TK/Flt3L-treated GL26 tumor-bearing animals were alive at 50 days post tumor implantation, 80% of the TK/Flt3L+Gr-1 depletion-treated animals survived long term (p < 0.005 for TF + isotype control, MS = 41 days versus TF + Gr-1 antibody, MS = not yet reached; Figure 4D). We also tested the efficacy of combining MDSC depletion with TK/Flt3L gene therapy in the highly aggressive OL61 model. Administration of TK/Flt3L gene therapy increased the median survival of OL61 tumor-bearing mice to 22 days. Addition of the MDSC-depletion antibody further enhanced the median survival to 28 days (p < 0.05 for saline versus TF + MDSC depletion; Figure S6). Our data therefore clearly showed that the efficacy of anti-GBM immune-gene therapy is strongly impacted by the presence of MDSCs and that strategies that are aimed at blocking the expansion or activation of MDSCs are an important adjuvant to immunotherapeutic strategies that can significantly prolong progression-free survival.
Figure 4.

Depletion of Gr-1+ Myeloid Cells Enhances the Efficacy of Immune-Stimulatory Gene Therapy
(A) GL26 tumor-bearing animals were administered the Gr-1 depletion antibody twice (at 14 and 18 dpi) and analyzed for tumor-infiltrating, splenic, and circulating MDSCs by flow cytometry at 21 dpi. The percent of CD11b+/Gr-1+, F4/80+ and CD11c+ within the CD45+ cells in the tumor, spleen, and blood were compared between the isotype and Gr-1 depletion group. (B) Schematic showing experimental paradigm of MDSC depletion with TK/Flt3L gene therapy. Mice with GL26-OVA tumors or GL26 tumors were treated with TK/Flt3L gene therapy on day 12 or day 9, respectively. Gr-1 depletion antibody was administered twice intraperitoneally (i.p.) 6 days and 11 days post gene therapy, as indicated in the figure, and animals were monitored for survival. (C and D) Kaplan-Meier survival analysis of GL26-OVA (C) or GL26 (D) tumor-bearing animals. At least n = 5 tumor-bearing mice were analyzed for each group. MS indicates the median survival (MS) time for each group. Data were analyzed using log-rank (Mantel-Cox) test. ***p < 0.005.
Depletion of MDSCs Enhances the TK/Flt3L-Induced Anti-GBM CD8 T Cell Response
The TK/Flt3L gene therapy induces a vigorous anti-tumor cytotoxic and memory T cell response. GBM-infiltrating MDSCs inhibit T cell proliferation and, given that the efficacy of the immune-stimulatory gene therapy was enhanced by Gr-1 depletion in the GL26 GBM model, we examined the impact of MDSC depletion on the quantity and quality of anti-tumor T cell response in this experimental paradigm (Figure 5A). Using OVA-expressing GBM cells, we were able to quantify tumor-specific CD8 T cells by making use of the SIINFEKL-H2Kb tetramer. Our data showed an ∼3-fold increase in the frequency of tumor-specific CD8 T cells in the TME after the administration of the TK/Flt3L gene therapy; this was further increased ∼1.3-fold (p < 0.05) in the presence of MDSC depletion (Figure 5B). The percentage of total TME-infiltrating CD3, CD4, or CD8 T cells was not changed by Gr-1 depletion, indicating the impact of MDSCs on tumor-antigen-specific T cells only (Figure S7A). To test the impact of MDSC depletion on the cytotoxicity of CD8 T cells in the TME, we stained the CD8 T cells for granzyme B (Gzb). TK/Flt3L gene therapy resulted in a 2-fold increase in the frequency of Gzb+ CD8 T cells compared to saline-treated animals. This was further enhanced in the presence of MDSC depletion by 1.2-fold (p < 0.05; Figure 5C). No difference in the tumor-specific CD8 T cell frequency or Gzb release was observed after MDSC depletion in the absence of TK/Flt3L gene therapy, indicating that absence of MDSCs augments the TK/Flt3L-induced anti-tumor CD8 T cell cytotoxic response (Figures 5B and 5C). While the frequency of interferon (IFN)γ+ T cells in the TME was not changed by the combination of MDSC depletion with TK/Flt3L gene therapy (Figure 5D), tumor-specific T cell IFNγ release by splenic CD8+ T cells was enhanced by 2-fold (p < 0.01) in the presence of MDSC depletion (Figure 5E). Likewise, we observed a 1.5-fold (p < 0.05) increase in the percentage of splenic IFNγ+ CD8+ T cells in the wild-type GL26 tumor-bearing mice treated with MDSC depletion in combination with TK/Flt3L gene therapy (Figure S8). Thus, our data demonstrate that, by combining MDSC depletion with TK/Flt3L immune-stimulatory gene therapy, we can strongly boost the quantity and quality of TK/Flt3L-induced anti-GBM T cell response, leading to an increase in median survival and the percentage of long-term survivors.
Figure 5.

Depletion of Gr-1+ Myeloid Cells in GBM-Bearing Mice Enhances Tumor-Specific CD8 T Cell Responses
(A) GL26-OVA tumor-bearing mice were treated with saline or TK/Flt3L gene therapy on day 12 post implantation, followed by administration of Gr-1-depleting antibody on day 16. T cell responses were analyzed at day 21. (B) Tumor-specific CD8 T cells within the TME of GL26-OVA tumors were analyzed by staining for PE-conjugated SIINFEKL-Kb tetramers by flow cytometry. (C and D) Activation status of CD8 T cells within the TME was analyzed by staining for granzyme B (Gzb) and IFNγ in tumor-infiltrating immune cells restimulated with the tumor lysate. (E) Splenic T cells were analyzed for antigen-specific IFNγ release by stimulating splenocytes from each group with tumor lysate and staining for intracellular IFNγ. Flow plots show representative stains for tetramer density, Gzb, and IFNγ stains in each group. Graphs show data combined from 2–3 experimental repeats, with 4–5 mice per repeat. Data were compared using Student’s t test to compare values between TK/Flt3L and TK/Flt3L + Gr-1 depletion groups. Means are indicated. *p < 0.05; ***p < 0.005.
Immunosuppressive Checkpoint Blockade Enhances the Efficacy of TK/Flt3L Immune-Mediate Gene Therapy
Immunosuppressive checkpoints, such as CTLA-4 and PD-1, negatively regulate T cell activation.37 CTLA-4 competes with CD28 in binding with great affinity to CD80 and CD86 and therefore interferes with the priming and expansion of T cells (Figure 6A). PD-1 binds to PDL1 and PDL2 and leads to T cell apoptosis and inhibition of effector functions. Circulating monocytes from GBM patients express high levels of PDL1 (Figure 6A).23, 51 Since our data showed that MDSC depletion enhanced the quantity and quality of anti-GBM T cell response, we assessed whether MDSCs from GBM-bearing mice expressed the ligands for CTLA-4 and PD-1. We analyzed the expression of PDL1 and CD80 on tumor-infiltrating and splenic MDSCs. Our data show that PDL1 was expressed on splenic MDSCs from the GL26 GBM model; its expression was strongly enhanced 12-fold (p < 0.001) on MDSCs from the GL26 TME (Figure 6B). CD80 expression was induced 32-fold (p < 0.001) on MDSCs from GL26 TME compared to the splenic MDSCs (Figure 6C). PDL1 and CD80 expression was also enhanced on TME MDSCs from the M7 and OL61 GBM model (Figure S9). We next tested the effect of blocking PDL1 or CTLA-4 in combination with TK/Flt3L gene therapy. As before, the timing of antibody administration coincided with the peak of the gene therapy-induced T cell response (Figure 6D). PDL1 neutralization strongly enhanced the long-term survival of GL26-OVA GBM-bearing mice; 80% of the mice were alive at day 98 as compared to 50% of mice from the gene therapy alone group (Figure 6E). PDL1 blockade in the absence of TK/Flt3L gene therapy also enhanced the survival of GBM-bearing mice (p < 0.05; MS = 33 days for isotype control versus MS = 43 days for PDL1 neutralization antibody). CTLA-4 blockade also enhanced the survival proportion of GBM-bearing mice treated with TK/Flt3L gene therapy, such that 57% of GBM-bearing mice survived beyond day 100 post tumor implantation compared to 28% in the TK+Flt3L gene therapy alone group (Figure 6F). Thus, our data demonstrate that inhibition of checkpoint signaling through PD-1 or CTLA-4 improves the efficacy of immune-stimulatory gene therapy, inducing a potent anti-GBM CD8 T cell response.
Figure 6.

PDL1 and CTLA-4 Blockade Enhance the Survival of TK+ Flt3L-Treated GBM-Bearing Mice
(A) Schematic showing PDL1- and CD80-induced checkpoint blockade. PDL1 and CD80 on MDSCs can bind to PD-1 and CTLA-4, respectively, and inhibit T cell proliferation and activation. (B and C) Surface expression of PDL1 (B) and CD80 (C) on tumor-infiltrating and splenic CD11b+/Gr-1+ MDSCs from GL26 tumor-bearing mice was determined by flow staining at moribund stage. Dot plots show gating for CD11b+/Gr-1+ cells from the GL26 spleen and tumor. The gray-shaded histograms and the thick black line represent staining on splenic MDSCs and tumor MDSCs, respectively. The black-dashed and -dotted lines show staining for isotype controls on splenic and tumor MDSCs, respectively. Bar graphs show the geometric MFI values for PDL1 and CD80 normalized to MFI for isotype stains. 4–5 tumor-bearing animals were analyzed in each group. (D) Mice with GL26-OVA tumors were treated with saline or TK/Flt3L gene therapy on day 12. PDL1-neutralization antibody or CTLA-4-blocking antibody was administered two times, 6 days and 11 days post gene therapy, as indicated in the figure, and animals were monitored for survival. (E and F) Kaplan-Meier survival analysis of GL26-OVA tumor-bearing animals treated with saline or gene therapy and PDL1- or CTLA-4-blocking antibody. Data were analyzed using the log-rank (Mantel-Cox) test. **p < 0.01; ***p < 0.005. MS indicates median survival.
In order to assess potential inflammatory and neuropathologic autoimmune effects of PDL1 neutralization or MDSC depletion, mice that survived long term post TK/Flt3L + MDSC depletion or TK/Flt3L + PDL1 neutralization antibody administration were subjected to detailed immune-histochemical analysis using myelin basic protein (MBP), CD4, CD8, and CD68 antibodies (Figure S10). Staining with MBP revealed that the demyelination seen with tumor growth in saline-treated mice was significantly reduced in TK/Flt3L-treated mice, indicating tumor regression and recovering myelination. Furthermore, no significant difference was observed in MBP staining in mice that received MDSC depletion or PDL1 neutralization antibodies in combination with TK/Flt3L, indicating the absence of autoimmunity-induced neuropathology. While CD4+ and CD8+ T cells and CD68+ macrophages were observed within the tumors of saline-treated mice and around the injection site in long-term survivors from the TK/Flt3L-treated cohort, no significant differences were observed between TK/Flt3L alone and the combination of TK/Flt3L with MDSC depletion or PDL1 neutralization. There was no further increase in inflammatory cellular infiltrates in the presence of MDSC depletion or PDL1 neutralization. MBP staining in spinal cord sections was uniform across the various groups. No staining for CD4 and CD8 T cells was observed in spinal cord sections, indicating the absence of inflammation in the spinal cord (Figure S10). CD68 staining was observed throughout the spinal cord and, as explained in our previous study, most likely indicates a lesion in the pyramidal tract.18 Overall, no overt autoimmune reactivity was observed by the administration of MDSC depletion or PDL1 neutralization antibody in combination with TK/Flt3L gene therapy.
Discussion
Evidence from tumors such as colorectal cancer have demonstrated that examination of the immune cellular infiltrates (presence of CD3 and CD8 T cells and memory T cells), localization (center of the tumor or at the invasive margins), and functional response (TH1 CD4 T cells and cytotoxic CD8 T cells) constitutes a robust predictive marker for evaluating overall survival and relapse after surgical resection.52 In melanomas and breast cancer, these parameters have also been predictive of responses to immunotherapies.53, 54 While quantitative and qualitative analysis of T cells within the TME is an important determinant, the data we presented herein clearly show that overcoming tumor-mediated immune suppression is essential to developing robust immunotherapeutic strategies. GBM is one of the most immunosuppressive cancers, and effective tumor regression would require that immunotherapeutic approaches be accompanied by a second line of treatment that eliminates restrictions on the generation of a potent anti-GBM immune response. We observed that MDSCs accumulate to levels of up to 80% of tumor-infiltrating immune cells in the GBM TME, and they were extremely potent suppressors of antigen-specific T cell proliferation. The content of the TME-infiltrating myeloid cells was distinct, depending upon the tumor model. Some studies have attempted to find a link between tumor mutations and the immune response against the tumor.55, 56 For example, an increased ratio of MDSCs to CD8 T cells was observed in tumors grown in animals lacking TP53.57 Additionally, IL-15 deletion in colorectal tumors and IFNγ locus deletion in melanomas resulted in impaired immune surveillance and tumor growth.58 A similar mechanism may be at play in GBM tumors. Our analysis of the TME-infiltrating myeloid cells shows a significant heterogeneity in the content and phenotype of these cells, depending on the GBM model that the myeloid cells are analyzed from. We hypothesize that the genetic landscape of GBMs could be a key determinant of the tumor-infiltrating immature myeloid cells’ function and could thereby impact the efficacy of immunotherapies.
The success of the TK/Flt3L gene therapy relies on the induction of a robust cytotoxic and memory T cell response.18, 20 In order to ensure that recruitment and expansion of powerful anti-tumor cytotoxic T lymphocytes is not repressed, we made use of the Gr-1-depleting antibody to eliminate immunosuppressive MDSCs from the GBM TME. A previous study from our lab showed that antibodies successfully cross the blood-brain barrier (BBB) and penetrate into the TME; the loss of BBB integrity associated with GBM growth may further support this process.59, 60, 61, 62, 63 A preliminary analysis of Gr-1 antibody-treated mice showed that the efficacy of depletion lasted for approximately 4 days. Therefore, to ensure the maintenance of TK/Flt3L-induced tumor-specific T cell proliferation, we administered the antibody so that MDSCs would be eliminated from the GBM TME around the peak of the T cell response, which occurs 7 days after the administration of gene therapy.18, 20, 64 In agreement with our hypothesis, we saw that combining MDSC depletion with the TK/Flt3L gene therapy increased the frequency of tumor-specific CD8 T cells in the TME and increased cytotoxicity as indicated by enhanced granzyme B production. Although the increased frequency of tumor-specific CD8 T cells could result from either increased proliferation or decreased apoptosis of the CD8 T cells, our in vitro data regarding the impact of MDSCs on antigen-specific CD8 T cell proliferation do suggest that depleting immunosuppressive MDSCs allows for amplified tumor-specific CD8 T cell proliferation in the TME (Figure 7). The enhanced CD8 T cell response was accompanied by an increased median survival and percentage of long-term survivors of GBM-bearing mice. Of note, while the effect on CD8 T cells is one of the major mechanisms by which MDSCs exert immunosuppression, they have also been shown to support tumor growth by promoting angiogenesis, establishing a pre-metastatic niche, and decreasing tumor cell apoptosis and response to chemotherapy.32, 33 Thus, depleting MDSCs can be an attractive adjuvant to many other anti-GBM therapies that target any of the above pathways.
Figure 7.

Blocking MDSC-Mediated Immunosuppression Enhances the Efficacy of TK/Flt3L Immune Stimulatory Gene Therapy
Administration of TK + GCV results in tumor cell lysis, and Flt3L induces the recruitment and expansion of DCs to the tumor that picks up the tumor antigens released by the dying cell. DCs traffic to the LNs and prime CD8 T cell response. The activated T cells migrate to the tumor and kill the tumor cells. In the absence of immunosuppressive MDSCs, the inhibition on T cell proliferation and cytotoxicity is abolished, leading to enhanced anti-GBM CD8 T cell response and long-term survival.
Another immunosuppressive mechanism occurring within the TME is mediated by the engagement of immune checkpoint blockade receptors like PD-1, CTLA-4, LAG-3, and TIM-3, among others. Recent clinical trials have demonstrated remarkable results with the use of inhibitors of immune checkpoints, such as anti-CTLA-4 and anti-PD-1 antibodies, in patients with late-stage melanoma and squamous cell lung cancer.8, 9 While under conditions of homeostasis, the engagement of checkpoint receptors and ligands serves to prevent autoimmunity, and tumors utilize these pathways as a mechanism of immune escape. MDSCs from the GBM TME expressed PDL1 and CD80; thus, binding of these ligands to their cognate receptors PD-1 and CTLA-4 on T cells would hinder the TK/Flt3L-induced anti-GBM T cell response. Combining the administration of PDL1- or CTLA-4-neutralizing antibodies with the TK/Flt3L gene therapy showed a significant improvement in the median survival of GBM-bearing mice along with an increase in the percentage of long-term survivors. PDL1 is known to be expressed on glioma tissues, and our blockade with the neutralizing antibody does not distinguish between the impact of PDL1 expressed by glioma cells or MDSCs. PDL1 blockade with TK/Flt3L gene therapy showed increased efficacy over the combination of CTLA-4 blockade with TK/Flt3L gene therapy. Both CD80-CTLA-4 and PDL1-PD-1 binding have similar negative effects on T cell activity; however, the timing of T cell inhibition and the downstream signaling pathways of immune inhibition by these two immune checkpoints are different.65, 66 While CTLA-4 functions during the priming phase of the T cell response, PD-1 functions during the effector phase.65, 66 The blockade antibodies were administered to coincide with the peak of the TK/Flt3L-induced T cell response, at which point, inhibition by the PDL1-PD1 pathway is more critical and is possibly why the PDL1 neutralization antibody administration shows better efficacy. Nevertheless, our data indicate that removing checkpoint blockade enhances the efficacy of gene therapy-mediated immunotherapeutic approaches in an intracranial mouse GBM model. Additionally, our data also highlight the importance of developing multipronged strategies, since MDSC depletion and immune checkpoint blockade as single treatment modalities provide only a slight therapeutic benefit. This is also evident from the survival benefit obtained by the administration of TK/Flt3L gene therapy and MDSC depletion together in the highly aggressive OL61 model. The observations by Wainwright and colleagues,67 showing maximal survival benefit when PDL1, CTLA-4, and IDO are blocked simultaneously, also support this assertion.
In summary, the data reported here indicate that eliminating MDSC-mediated immunosuppression is a critical adjuvant to enhance the efficacy of immunotherapeutic strategies. Controlling the progression of intractable cancers, such as GBM, will require not only a potent activation of the host anti-tumor immune response, but also the eradication of barriers that can limit the progression of the immune response once activated. Since the TK/Flt3L gene therapy approach and checkpoint inhibitors for CTLA-4 (ipilimumab) and PD-1 (nivolumab and pembrolizumab) are currently being tested in clinical trials, a combinatorial approach utilizing these modalities should be readily testable in patients in a phase I clinical trial.
Materials and Methods
Reagents
DMEM-F12, FBS, PBS, N2, and B27 supplements and penicillin-streptomycin were purchased from GIBCO, Life Technologies. Epidermal growth factor (EGF) and fibroblast growth factor (FGF) were purchased from Peprotech. Anti-mouse CD11b, Gr-1, and CD45 antibodies were obtained from BD Biosciences. F4/80 (BM8) and IL-4Rα (I015F8) antibodies were purchased from Biolegend. Ly6G (IA8), Ly6C (HK1.4), CD3 (145-2C11), CD4 (RM4-5), CD8 (53-6.7), CD11c (N418), CD80 (16-10A1), PDL1 (10F.9G2), and iNOS antibodies were from eBiosciences. SIINFEKL tetramers were obtained from MBL International. Arginase antibody was from R&D Systems. For immunohistochemistry, MBP (MAB386) primary antibody was purchased from Millipore, CD4 (ab183685) and CD68 (ab125212) antibodies from Abcam, and CD8 (361003) antibody from Synaptic Systems. Goat anti-rabbit HRP, goat anti-rabbit biotin-labeled, and rabbit anti-rat biotin-labeled secondary antibodies were obtained from Dako.
Cell Culture
GL26 cells were obtained from the National Cancer Institute and GL26 cells expressing ovalbumin (OVA) were obtained as detailed in Yang et al.68 GL26 and GL26-OVA cells were cultured as before.68 M7 and OL61 neurospheres were a gift from Dr. John Ohlfest (University of Minnesota).44 Neurospheres were derived from tumors generated in C57BL/6 mice using the Sleeping Beauty (SB) transposase system.44, 45 Tumor tissue was dissociated using HyQTase (HyClone), passed through a 70-μm cell strainer, and cultured in media containing DMEM-F12, N2, and B27 supplements, 1% penicillin-streptomycin (Invitrogen), Normocin (Invivogen), and supplemented with 20 ng/mL EGF and 20 ng/mL FGF (Peprotech). Growth factors were added every 2 to 3 days, and cells were passaged once to twice each week, depending on density.
Glioma Models and Gene Therapy
All animal experiments were performed in accordance with protocols approved by the University Committee on Use and Care of Animals (UCUCA) at the University of Michigan. Intracranial xenograft GBM models were developed as described before.19, 68 Briefly, 20,000 GL26 cells, 60,000 GL26-OVA cells, or 20,000 M7 or 10,000 OL61 neurospheres in 1 μL DMEM were stereotactically implanted in the right striatum of syngeneic female C57BL/6 mice (6–8 wk; Taconic) at the coordinates of 0.5 mm anterior and 2.0 mm lateral from the bregma and 3.0 mm ventral from the dura.18, 19 The adenoviral vectors used in this protocol are first-generation Ad.hCMV.hsFLT3L (Ad-Flt3L) + Ad.hCMV.TK (Ad-TK). Gene therapy was administered 12 days, 10 days, and 7 days post GL26-OVA, GL26, and OL61 tumor implantation, respectively, as described before.19 Briefly, mice received 5 × 10⁸ plaque-forming units (pfu) of Ad-Flt3L and 1 × 10⁸ pfu of Ad-TK in 1.5 μL volume in three locations at 3.5 mm, 3.0 mm, and 2.5 mm ventral from the dura, followed by ganciclovir (GCV; TSZ Chemicals) administration twice a day for 10 days.19, 68
Myeloid Cell Depletion
250 μg of the Gr-1-depleting antibody or rat IgG2b isotype control (Bio-X-Cell, clone RB6-8C5) was administered intraperitoneally (i.p.) as indicated in the figures.49, 50
Immune Checkpoint Blockade
PDL1- (clone 10F.9G2) and CTLA-4 (clone 9D9)-neutralizing antibodies were purchased from Bio-X-Cell. Mice were injected with 200 μg of each antibody i.p as indicated in the figures.
Flow Cytometry
Tissue preparation was carried out as before.17, 19, 64, 69 All cell suspensions obtained from tissues were resuspended in PBS containing 2% fetal calf serum (FCS) (flow buffer) for antibody staining for flow cytometry. All flow data were acquired on a FACSAria flow cytometer (BD Biosciences) and analyzed using Flow Jo version 10 (Treestar). To analyze the myeloid cell population, cells were stained with anti-mouse CD45, CD11b, Gr-1, Ly6G, Ly6C, F4/80, and CD11c antibodies. For characterization of cell-surface markers, cells were stained with anti-mouse IL-4Rα, CD80, and PDL1 antibodies. Intracellular iNOS and arginase stains were performed on percoll (GE Healthcare)-purified tumor-infiltrating leukocytes (TILs) and splenocytes using the BD intracellular staining kit (BD Biosciences) following the manufacturer’s protocol. For T cell functional analysis, percoll-purified TILs were stained with anti-mouse CD45, CD3, CD8, and SIINFEKL-H2Kb-tetramer-PE in flow buffer for 30 min at 4°C after blocking non-specific binding with CD16/CD32. Cells were washed two times with flow buffer prior to data acquisition. For granzyme B and IFNγ stains, purified TILs were stimulated with 100 μg/mL of GL26-OVA lysate for 24 hr in 10% FCS-containing media supplemented with IL-2. Brefeldin and monensin were added for the last 6 hr of the culture. Cells were first stained with CD3 and CD8 antibodies, followed by intracellular stains for granzyme B (eBioscience) and IFNγ (BD Biosciences). Intracellular stains were performed using the BD intracellular staining kit according to the kit instructions. Dead cells were excluded from analysis using a fixable viability dye (eBioscience). Tumor-specific IFNγ release by splenic CD8 T cells was analyzed as above. Wild-type GL26 cells were used to prepare the lysate when testing the anti-tumor CD8+T cell response in the GL26 model.
MDSC Expansion Assays
0.5 × 10⁶ bone marrow cells were cultured in 500 μL of media containing DMEM (10% FCS) and conditioned media (CM) from GBM cell lines. Fresh media was added every 2 days, and MDSC expansion in the culture was examined on day 6 by flow cytometry.
T Cell Proliferation Assays
MDSCs were purified from the brains and spleens of moribund GL26 mice or the spleens and bone marrow of naive wild-type mice by flow sorting. Gr-1high and Gr 1low MDSCs were purified separately. Briefly, tumor tissue was carefully dissected out from the brain and homogenized using a Tenbroeck (Corning) homogenizer in DMEM media containing 10% FCS. TME-infiltrating immune cells were enriched from the homogenized suspension using a 30%/70% Percoll (GE Lifesciences) density gradient. The purified immune cells were labeled with CD45, CD11b, and Gr-1 antibodies, and MDSCs were purified by flow sorting. Purified Gr-1high and Gr-1low MDSCs were cultured with CFSE-labeled total splenocytes from Rag2 knockout/transgenic OT-I T cell receptor mice (Taconic) at various ratios. Cultures were stimulated with 100 nM SIINFEKL peptide (Anaspec) for 4 days. Cells were then stained with anti-mouse CD3 and CD8 antibodies in flow buffer, and T cell proliferation was analyzed by CFSE dye dilution.
Cytokine Array
For the cytokine array of GBM cells and neurospheres, 2 × 10⁶ cells in 2 mL media were cultured for 2 days, after which the supernatant was collected by centrifugation. Total protein concentration was quantified in the supernatants using the BCA protein assay (Pierce), and equal amounts of protein were used for the Proteome Profiler Cytokine array (R&D Systems). Pixel density was analyzed using ImageJ software.
Immunohistochemistry
PFA-fixed 5 μm paraffin-embedded brain and spinal cord sections mounted on electrostatic slides were de-paraffinized and subjected to antigen retrieval for 20 min at 98°C in 0.1 M citrate buffer (pH 6) or Tris EDTA buffer (pH 9). This was followed by three 5-min TBS-Triton X (TBS-Tx) washes. Endogenous peroxidase was inactivated by 0.3% H2O2 incubation for 15 min, followed by three 5-min TBS-Tx washes. Sections were blocked in 10% goat serum for 1 hr at 37°C, then incubated with either MBP (1:500 dilution), CD4 (1:1,000 dilution), CD8 (1:2,000 dilution), or CD68 (1:200 dilution) in 1% goat serum in TBS-Tx for 24 hr at 4°C. The next day, sections were washed four times for 5 min in TBS-Tx. The secondary antibodies used were anti-rabbit HRP labeled (goat polyclonal, 1:1,000), anti-rabbit biotin labeled (goat polycolonal, 1:1,000) and, anti-rat biotin labeled (rabbit polyclonal, 1:1,000). Sections were then developed with 3, 3′-diaminobenzidine (DAB) (Biocare Medical) with nickel sulfate precipitation. The reaction was quenched with 10% sodium azide, and sections were washed for 5 min four times in 0.1 M sodium acetate and twice in PBS before dehydrating in xylene and coverslipping with DePeX Mounting Medium (Electron Microscopy Sciences). Images were obtained on the Olympus BX53 microscope at the bright field setting.
Statistical Analysis
Data were analyzed using GraphPad Prism version 6.01. Animal studies were carried out with at least 4–5 animals in each group. The statistical test used is indicated in each figure. p < 0.05 were considered significant.
Author Contributions
Conceptualization, N.K., M.C., P.R.L., and M.G.C.; Methodology, N.K., P.R.L., and M.G.C.; Investigation, N.K., P.K., M.S., M.C., Y.L., M.A.M.-A., N.R., and D.S.; Formal analysis, N.K., P.K., and M.C.; Writing, review, and editing, N.K., M.C., P.R.L., and M.G.C.; Visualization, N.K., P.K., M.S., M.C., and M.G.C.; Resources, P.R.L. and M.G.C.; Supervision, M.G.C.; Project administration, N.K., P.K., M.S., P.R.L., and M.G.C.; Funding acquisition, P.R.L. and M.G.C.
Conflicts of Interest
The authors have declared that no conflicts of interest exist.
Acknowledgments
This work was supported by NIH/National Institute of Neurological Disorders & Stroke (NIH/NINDS) Grants R37-NS094804-01, R01-NS074387-01, R01-NS057711-01, and R21-NS091555-01 to M.G.C. and R01-NS061107-01, R01-NS076991-01, R01-NS082311-01, and R21-NS084275-01 to P.R.L.; Grant R01-EB-022563-01, Leah’s Happy Hearts, University of Michigan Comprehensive Cancer Center, Chad Tough Foundation, and The Phase One Foundation to M.G.C. and P.R.L.; the Department of Neurosurgery, University of Michigan School of Medicine; the Michigan Institute for Clinical and Health Research, NIH2UL1-TR000433; the University of Michigan Cancer Biology Training Grant, NIH/NCI (National Cancer Institute) T32-CA009676; University of Michigan Training in Clinical and Basic Neuroscience, NIH/NINDS T32-NS007222; and the University of Michigan Medical Scientist Training Program, NIH/NIGMS (National Institute of General Medicine Sciences) T32-GM007863. M.A.M.-A. was supported by the Jorge Oster Fellowship from the Bunge & Born Foundation (Argentina). We are grateful to Karin Muraszko for her outstanding academic leadership, Stephen Napolitan and Molly Dahlgren for excellent administrative support, and Marta Dzaman for superb technical assistance.
Footnotes
Supplemental Information includes ten figures and can be found with this article online at http://dx.doi.org/10.1016/j.ymthe.2016.10.003.
Supplemental Information
References
- 1.Ostrom Q.T., Bauchet L., Davis F.G., Deltour I., Fisher J.L., Langer C.E., Pekmezci M., Schwartzbaum J.A., Turner M.C., Walsh K.M. The epidemiology of glioma in adults: a “state of the science” review. Neuro-oncol. 2014;16:896–913. doi: 10.1093/neuonc/nou087. [DOI] [PMC free article] [PubMed] [Google Scholar]
- 2.Calinescu A.A., Kamran N., Baker G., Mineharu Y., Lowenstein P.R., Castro M.G. Overview of current immunotherapeutic strategies for glioma. Immunotherapy. 2015;7:1073–1104. doi: 10.2217/imt.15.75. [DOI] [PMC free article] [PubMed] [Google Scholar]
- 3.Brat D.J., Verhaak R.G., Aldape K.D., Yung W.K., Salama S.R., Cooper L.A., Rheinbay E., Miller C.R., Vitucci M., Morozova O., Cancer Genome Atlas Research Network Comprehensive, Integrative Genomic Analysis of Diffuse Lower-Grade Gliomas. N. Engl. J. Med. 2015;372:2481–2498. doi: 10.1056/NEJMoa1402121. [DOI] [PMC free article] [PubMed] [Google Scholar]
- 4.Reardon D.A., Freeman G., Wu C., Chiocca E.A., Wucherpfennig K.W., Wen P.Y., Fritsch E.F., Curry W.T., Jr., Sampson J.H., Dranoff G. Immunotherapy advances for glioblastoma. Neuro-oncol. 2014;16:1441–1458. doi: 10.1093/neuonc/nou212. [DOI] [PMC free article] [PubMed] [Google Scholar]
- 5.Stupp R., Mason W.P., van den Bent M.J., Weller M., Fisher B., Taphoorn M.J., Belanger K., Brandes A.A., Marosi C., Bogdahn U., European Organisation for Research and Treatment of Cancer Brain Tumor and Radiotherapy Groups. National Cancer Institute of Canada Clinical Trials Group Radiotherapy plus concomitant and adjuvant temozolomide for glioblastoma. N. Engl. J. Med. 2005;352:987–996. doi: 10.1056/NEJMoa043330. [DOI] [PubMed] [Google Scholar]
- 6.Stupp R., Hegi M.E., Gilbert M.R., Chakravarti A. Chemoradiotherapy in malignant glioma: standard of care and future directions. J. Clin. Oncol. 2007;25:4127–4136. doi: 10.1200/JCO.2007.11.8554. [DOI] [PubMed] [Google Scholar]
- 7.Tanimoto T., Hori A., Kami M. Sipuleucel-T immunotherapy for castration-resistant prostate cancer. N Engl J Med. 2010;363:1966. doi: 10.1056/NEJMc1009982. author reply 1967-1968. [DOI] [PubMed] [Google Scholar]
- 8.Hodi F.S., O’Day S.J., McDermott D.F., Weber R.W., Sosman J.A., Haanen J.B., Gonzalez R., Robert C., Schadendorf D., Hassel J.C. Improved survival with ipilimumab in patients with metastatic melanoma. N. Engl. J. Med. 2010;363:711–723. doi: 10.1056/NEJMoa1003466. [DOI] [PMC free article] [PubMed] [Google Scholar]
- 9.Brahmer J.R., Tykodi S.S., Chow L.Q., Hwu W.J., Topalian S.L., Hwu P., Drake C.G., Camacho L.H., Kauh J., Odunsi K. Safety and activity of anti-PD-L1 antibody in patients with advanced cancer. N. Engl. J. Med. 2012;366:2455–2465. doi: 10.1056/NEJMoa1200694. [DOI] [PMC free article] [PubMed] [Google Scholar]
- 10.Dietrich P.Y., Dutoit V., Walker P.R. Immunotherapy for glioma: from illusion to realistic prospects? Am. Soc. Clin. Oncol. Educ. Book. 2014:51–59. doi: 10.14694/EdBook_AM.2014.34.51. [DOI] [PubMed] [Google Scholar]
- 11.Jackson C.M., Lim M., Drake C.G. Immunotherapy for brain cancer: recent progress and future promise. Clin Cancer Res. 2014;20:3651–3659. doi: 10.1158/1078-0432.CCR-13-2057. [DOI] [PMC free article] [PubMed] [Google Scholar]
- 12.Yang Y. Cancer immunotherapy: harnessing the immune system to battle cancer. J. Clin. Invest. 2015;125:3335–3337. doi: 10.1172/JCI83871. [DOI] [PMC free article] [PubMed] [Google Scholar]
- 13.Davies D.C. Blood-brain barrier breakdown in septic encephalopathy and brain tumours. J. Anat. 2002;200:639–646. doi: 10.1046/j.1469-7580.2002.00065.x. [DOI] [PMC free article] [PubMed] [Google Scholar]
- 14.Rascher G., Fischmann A., Kröger S., Duffner F., Grote E.H., Wolburg H. Extracellular matrix and the blood-brain barrier in glioblastoma multiforme: spatial segregation of tenascin and agrin. Acta Neuropathol. 2002;104:85–91. doi: 10.1007/s00401-002-0524-x. [DOI] [PubMed] [Google Scholar]
- 15.Goldmann J., Kwidzinski E., Brandt C., Mahlo J., Richter D., Bechmann I. T cells traffic from brain to cervical lymph nodes via the cribroid plate and the nasal mucosa. J. Leukoc. Biol. 2006;80:797–801. doi: 10.1189/jlb.0306176. [DOI] [PubMed] [Google Scholar]
- 16.Cserr H.F., Harling-Berg C.J., Knopf P.M. Drainage of brain extracellular fluid into blood and deep cervical lymph and its immunological significance. Brain Pathol. 1992;2:269–276. doi: 10.1111/j.1750-3639.1992.tb00703.x. [DOI] [PubMed] [Google Scholar]
- 17.Mineharu Y., Muhammad A.K., Yagiz K., Candolfi M., Kroeger K.M., Xiong W., Puntel M., Liu C., Levy E., Lugo C. Gene therapy-mediated reprogramming tumor infiltrating T cells using IL-2 and inhibiting NF-κB signaling improves the efficacy of immunotherapy in a brain cancer model. Neurotherapeutics. 2012;9:827–843. doi: 10.1007/s13311-012-0144-7. [DOI] [PMC free article] [PubMed] [Google Scholar]
- 18.Ali S., King G.D., Curtin J.F., Candolfi M., Xiong W., Liu C., Puntel M., Cheng Q., Prieto J., Ribas A. Combined immunostimulation and conditional cytotoxic gene therapy provide long-term survival in a large glioma model. Cancer Res. 2005;65:7194–7204. doi: 10.1158/0008-5472.CAN-04-3434. [DOI] [PMC free article] [PubMed] [Google Scholar]
- 19.Curtin J.F., Liu N., Candolfi M., Xiong W., Assi H., Yagiz K., Edwards M.R., Michelsen K.S., Kroeger K.M., Liu C. HMGB1 mediates endogenous TLR2 activation and brain tumor regression. PLoS Med. 2009;6:e10. doi: 10.1371/journal.pmed.1000010. [DOI] [PMC free article] [PubMed] [Google Scholar]
- 20.Ghulam Muhammad A.K., Candolfi M., King G.D., Yagiz K., Foulad D., Mineharu Y., Kroeger K.M., Treuer K.A., Nichols W.S., Sanderson N.S. Antiglioma immunological memory in response to conditional cytotoxic/immune-stimulatory gene therapy: humoral and cellular immunity lead to tumor regression. Clin Cancer Res. 2009;15:6113–6127. doi: 10.1158/1078-0432.CCR-09-1087. [DOI] [PMC free article] [PubMed] [Google Scholar]
- 21.Candolfi M., Yagiz K., Foulad D., Alzadeh G.E., Tesarfreund M., Muhammad A.K., Puntel M., Kroeger K.M., Liu C., Lee S. Release of HMGB1 in response to proapoptotic glioma killing strategies: efficacy and neurotoxicity. Clin Cancer Res. 2009;15:4401–4414. doi: 10.1158/1078-0432.CCR-09-0155. [DOI] [PMC free article] [PubMed] [Google Scholar]
- 22.Candolfi M., Yagiz K., Wibowo M., Ahlzadeh G.E., Puntel M., Ghiasi H., Kamran N., Paran C., Lowenstein P.R., Castro M.G. Temozolomide does not impair gene therapy-mediated antitumor immunity in syngeneic brain tumor models. Clin Cancer Res. 2014;20:1555–1565. doi: 10.1158/1078-0432.CCR-13-2140. [DOI] [PMC free article] [PubMed] [Google Scholar]
- 23.Berghoff A.S., Kiesel B., Widhalm G., Rajky O., Ricken G., Wöhrer A., Dieckmann K., Filipits M., Brandstetter A., Weller M. Programmed death ligand 1 expression and tumor-infiltrating lymphocytes in glioblastoma. Neuro-oncol. 2015;17:1064–1075. doi: 10.1093/neuonc/nou307. [DOI] [PMC free article] [PubMed] [Google Scholar]
- 24.Bloch O., Crane C.A., Kaur R., Safaee M., Rutkowski M.J., Parsa A.T. Gliomas promote immunosuppression through induction of B7-H1 expression in tumor-associated macrophages. Clin Cancer Res. 2013;19:3165–3175. doi: 10.1158/1078-0432.CCR-12-3314. [DOI] [PMC free article] [PubMed] [Google Scholar]
- 25.Grossman S.A., Ye X., Lesser G., Sloan A., Carraway H., Desideri S., Piantadosi S., NABTT CNS Consortium Immunosuppression in patients with high-grade gliomas treated with radiation and temozolomide. Clin Cancer Res. 2011;17:5473–5480. doi: 10.1158/1078-0432.CCR-11-0774. [DOI] [PMC free article] [PubMed] [Google Scholar]
- 26.Gustafson M.P., Lin Y., New K.C., Bulur P.A., O’Neill B.P., Gastineau D.A., Dietz A.B. Systemic immune suppression in glioblastoma: the interplay between CD14+HLA-DRlo/neg monocytes, tumor factors, and dexamethasone. Neuro-oncol. 2010;12:631–644. doi: 10.1093/neuonc/noq001. [DOI] [PMC free article] [PubMed] [Google Scholar]
- 27.Humphries W., Wei J., Sampson J.H., Heimberger A.B. The role of tregs in glioma-mediated immunosuppression: potential target for intervention. Neurosurg. Clin. N. Am. 2010;21:125–137. doi: 10.1016/j.nec.2009.08.012. [DOI] [PMC free article] [PubMed] [Google Scholar]
- 28.Prosniak M., Harshyne L.A., Andrews D.W., Kenyon L.C., Bedelbaeva K., Apanasovich T.V., Heber-Katz E., Curtis M.T., Cotzia P., Hooper D.C. Glioma grade is associated with the accumulation and activity of cells bearing M2 monocyte markers. Clin Cancer Res. 2013;19:3776–3786. doi: 10.1158/1078-0432.CCR-12-1940. [DOI] [PubMed] [Google Scholar]
- 29.Wu A., Wei J., Kong L.Y., Wang Y., Priebe W., Qiao W., Sawaya R., Heimberger A.B. Glioma cancer stem cells induce immunosuppressive macrophages/microglia. Neuro-oncol. 2010;12:1113–1125. doi: 10.1093/neuonc/noq082. [DOI] [PMC free article] [PubMed] [Google Scholar]
- 30.Raychaudhuri B., Rayman P., Huang P., Grabowski M., Hambardzumyan D., Finke J.H., Vogelbaum M.A. Myeloid derived suppressor cell infiltration of murine and human gliomas is associated with reduction of tumor infiltrating lymphocytes. J. Neurooncol. 2015;122:293–301. doi: 10.1007/s11060-015-1720-6. [DOI] [PubMed] [Google Scholar]
- 31.Raychaudhuri B., Rayman P., Ireland J., Ko J., Rini B., Borden E.C., Garcia J., Vogelbaum M.A., Finke J. Myeloid-derived suppressor cell accumulation and function in patients with newly diagnosed glioblastoma. Neuro-oncol. 2011;13:591–599. doi: 10.1093/neuonc/nor042. [DOI] [PMC free article] [PubMed] [Google Scholar]
- 32.Gabrilovich D.I., Nagaraj S. Myeloid-derived suppressor cells as regulators of the immune system. Nat. Rev. Immunol. 2009;9:162–174. doi: 10.1038/nri2506. [DOI] [PMC free article] [PubMed] [Google Scholar]
- 33.Marvel D., Gabrilovich D.I. Myeloid-derived suppressor cells in the tumor microenvironment: expect the unexpected. J. Clin. Invest. 2015;125:3356–3364. doi: 10.1172/JCI80005. [DOI] [PMC free article] [PubMed] [Google Scholar]
- 34.Bronte V., Zanovello P. Regulation of immune responses by L-arginine metabolism. Nat. Rev. Immunol. 2005;5:641–654. doi: 10.1038/nri1668. [DOI] [PubMed] [Google Scholar]
- 35.Ezernitchi A.V., Vaknin I., Cohen-Daniel L., Levy O., Manaster E., Halabi A., Pikarsky E., Shapira L., Baniyash M. TCR zeta down-regulation under chronic inflammation is mediated by myeloid suppressor cells differentially distributed between various lymphatic organs. J. Immunol. 2006;177:4763–4772. doi: 10.4049/jimmunol.177.7.4763. [DOI] [PubMed] [Google Scholar]
- 36.Hanson E.M., Clements V.K., Sinha P., Ilkovitch D., Ostrand-Rosenberg S. Myeloid-derived suppressor cells down-regulate L-selectin expression on CD4+ and CD8+ T cells. J. Immunol. 2009;183:937–944. doi: 10.4049/jimmunol.0804253. [DOI] [PMC free article] [PubMed] [Google Scholar]
- 37.Kim E.S., Kim J.E., Patel M.A., Mangraviti A., Ruzevick J., Lim M. Immune Checkpoint Modulators: An Emerging Antiglioma Armamentarium. J. Immunol. Res. 2016;2016:4683607. doi: 10.1155/2016/4683607. [DOI] [PMC free article] [PubMed] [Google Scholar]
- 38.Kane J.R., Miska J., Young J.S., Kanojia D., Kim J.W., Lesniak M.S. Sui generis: gene therapy and delivery systems for the treatment of glioblastoma. Neuro-oncol. 2015;17(Suppl 2):ii24–ii36. doi: 10.1093/neuonc/nou355. [DOI] [PMC free article] [PubMed] [Google Scholar]
- 39.Chen K.S., Mitchell D.A. Monoclonal antibody therapy for malignant glioma. Adv. Exp. Med. Biol. 2012;746:121–141. doi: 10.1007/978-1-4614-3146-6_10. [DOI] [PubMed] [Google Scholar]
- 40.Morgan R.A., Dudley M.E., Wunderlich J.R., Hughes M.S., Yang J.C., Sherry R.M., Royal R.E., Topalian S.L., Kammula U.S., Restifo N.P. Cancer regression in patients after transfer of genetically engineered lymphocytes. Science. 2006;314:126–129. doi: 10.1126/science.1129003. [DOI] [PMC free article] [PubMed] [Google Scholar]
- 41.Morgan R.A., Johnson L.A., Davis J.L., Zheng Z., Woolard K.D., Reap E.A., Feldman S.A., Chinnasamy N., Kuan C.T., Song H. Recognition of glioma stem cells by genetically modified T cells targeting EGFRvIII and development of adoptive cell therapy for glioma. Hum. Gene Ther. 2012;23:1043–1053. doi: 10.1089/hum.2012.041. [DOI] [PMC free article] [PubMed] [Google Scholar]
- 42.Ohno M., Natsume A., Ichiro Iwami K., Iwamizu H., Noritake K., Ito D., Toi Y., Ito M., Motomura K., Yoshida J. Retrovirally engineered T-cell-based immunotherapy targeting type III variant epidermal growth factor receptor, a glioma-associated antigen. Cancer Sci. 2010;101:2518–2524. doi: 10.1111/j.1349-7006.2010.01734.x. [DOI] [PMC free article] [PubMed] [Google Scholar]
- 43.Messmer M.N., Netherby C.S., Banik D., Abrams S.I. Tumor-induced myeloid dysfunction and its implications for cancer immunotherapy. Cancer Immunol. Immunother. 2015;64:1–13. doi: 10.1007/s00262-014-1639-3. [DOI] [PMC free article] [PubMed] [Google Scholar]
- 44.Wiesner S.M., Decker S.A., Larson J.D., Ericson K., Forster C., Gallardo J.L., Long C., Demorest Z.L., Zamora E.A., Low W.C. De novo induction of genetically engineered brain tumors in mice using plasmid DNA. Cancer Res. 2009;69:431–439. doi: 10.1158/0008-5472.CAN-08-1800. [DOI] [PMC free article] [PubMed] [Google Scholar]
- 45.Calinescu A.A., Núñez F.J., Koschmann C., Kolb B.L., Lowenstein P.R., Castro M.G. Transposon mediated integration of plasmid DNA into the subventricular zone of neonatal mice to generate novel models of glioblastoma. J. Vis. Exp. 2015;(96) doi: 10.3791/52443. [DOI] [PMC free article] [PubMed] [Google Scholar]
- 46.Kohanbash G., McKaveney K., Sakaki M., Ueda R., Mintz A.H., Amankulor N., Fujita M., Ohlfest J.R., Okada H. GM-CSF promotes the immunosuppressive activity of glioma-infiltrating myeloid cells through interleukin-4 receptor-α. Cancer Res. 2013;73:6413–6423. doi: 10.1158/0008-5472.CAN-12-4124. [DOI] [PMC free article] [PubMed] [Google Scholar]
- 47.Scheurer M.E., Amirian E., Cao Y., Gilbert M.R., Aldape K.D., Kornguth D.G., El-Zein D.G., Bondy M.L. Polymorphisms in the interleukin-4 receptor gene are associated with better survival in patients with glioblastoma. Clin Cancer Res. 2008;14:6640–6646. doi: 10.1158/1078-0432.CCR-07-4681. [DOI] [PMC free article] [PubMed] [Google Scholar]
- 48.Gadani S.P., Cronk J.C., Norris G.T., Kipnis J. IL-4 in the brain: a cytokine to remember. J. Immunol. 2012;189:4213–4219. doi: 10.4049/jimmunol.1202246. [DOI] [PMC free article] [PubMed] [Google Scholar]
- 49.Mauti L.A., Le Bitoux M.A., Baumer K., Stehle J.C., Golshayan D., Provero P., Stamenkovic I. Myeloid-derived suppressor cells are implicated in regulating permissiveness for tumor metastasis during mouse gestation. J. Clin. Invest. 2011;121:2794–2807. doi: 10.1172/JCI41936. [DOI] [PMC free article] [PubMed] [Google Scholar]
- 50.Srivastava M.K., Zhu L., Harris-White M., Kar U.K., Huang M., Johnson M.F., Lee J.M., Elashoff D., Strieter R., Dubinett S., Sharma S. Myeloid suppressor cell depletion augments antitumor activity in lung cancer. PLoS ONE. 2012;7:e40677. doi: 10.1371/journal.pone.0040677. [DOI] [PMC free article] [PubMed] [Google Scholar]
- 51.Jacobs J.F., Idema A.J., Bol K.F., Nierkens S., Grauer O.M., Wesseling P., Grotenhuis J.A., Hoogerbrugge P.M., de Vries I.J., Adema G.J. Regulatory T cells and the PD-L1/PD-1 pathway mediate immune suppression in malignant human brain tumors. Neuro-oncol. 2009;11:394–402. doi: 10.1215/15228517-2008-104. [DOI] [PMC free article] [PubMed] [Google Scholar]
- 52.Galon J., Angell H.K., Bedognetti D., Marincola F.M. The continuum of cancer immunosurveillance: prognostic, predictive, and mechanistic signatures. Immunity. 2013;39:11–26. doi: 10.1016/j.immuni.2013.07.008. [DOI] [PubMed] [Google Scholar]
- 53.Galon J., Costes A., Sanchez-Cabo F., Kirilovsky A., Mlecnik B., Lagorce-Pagès C., Tosolini M., Camus M., Berger A., Wind P. Type, density, and location of immune cells within human colorectal tumors predict clinical outcome. Science. 2006;313:1960–1964. doi: 10.1126/science.1129139. [DOI] [PubMed] [Google Scholar]
- 54.Gajewski T.F., Woo S.R., Zha Y., Spaapen R., Zheng Y., Corrales L., Spranger S. Cancer immunotherapy strategies based on overcoming barriers within the tumor microenvironment. Curr. Opin. Immunol. 2013;25:268–276. doi: 10.1016/j.coi.2013.02.009. [DOI] [PubMed] [Google Scholar]
- 55.Trimboli A.J., Cantemir-Stone C.Z., Li F., Wallace J.A., Merchant A., Creasap N., Thompson J.C., Caserta E., Wang H., Chong J.L. Pten in stromal fibroblasts suppresses mammary epithelial tumours. Nature. 2009;461:1084–1091. doi: 10.1038/nature08486. [DOI] [PMC free article] [PubMed] [Google Scholar]
- 56.Palumbo A., Jr., Da Costa Nde.O., Bonamino M.H., Pinto L.F., Nasciutti L.E. Genetic instability in the tumor microenvironment: a new look at an old neighbor. Mol. Cancer. 2015;14:145. doi: 10.1186/s12943-015-0409-y. [DOI] [PMC free article] [PubMed] [Google Scholar]
- 57.Guo G., Marrero L., Rodriguez P., Del Valle L., Ochoa A., Cui Y. Trp53 inactivation in the tumor microenvironment promotes tumor progression by expanding the immunosuppressive lymphoid-like stromal network. Cancer Res. 2013;73:1668–1675. doi: 10.1158/0008-5472.CAN-12-3810. [DOI] [PMC free article] [PubMed] [Google Scholar]
- 58.Mlecnik B., Bindea G., Angell H.K., Sasso M.S., Obenauf A.C., Fredriksen T., Lafontaine L., Bilocq A.M., Kirilovsky A., Tosolini M. Functional network pipeline reveals genetic determinants associated with in situ lymphocyte proliferation and survival of cancer patients. Sci. Transl. Med. 2014;6:228ra37. doi: 10.1126/scitranslmed.3007240. [DOI] [PubMed] [Google Scholar]
- 59.Baker G.J., Yadav V.N., Motsch S., Koschmann C., Calinescu A.A., Mineharu Y., Camelo-Piragua S.I., Orringer D., Bannykh S., Nichols W.S. Mechanisms of glioma formation: iterative perivascular glioma growth and invasion leads to tumor progression, VEGF-independent vascularization, and resistance to antiangiogenic therapy. Neoplasia. 2014;16:543–561. doi: 10.1016/j.neo.2014.06.003. [DOI] [PMC free article] [PubMed] [Google Scholar]
- 60.Wolburg H., Noell S., Fallier-Becker P., Mack A.F., Wolburg-Buchholz K. The disturbed blood-brain barrier in human glioblastoma. Mol. Aspects Med. 2012;33:579–589. doi: 10.1016/j.mam.2012.02.003. [DOI] [PubMed] [Google Scholar]
- 61.On N.H., Mitchell R., Savant S.D., Bachmeier C.J., Hatch G.M., Miller D.W. Examination of blood-brain barrier (BBB) integrity in a mouse brain tumor model. J. Neurooncol. 2013;111:133–143. doi: 10.1007/s11060-012-1006-1. [DOI] [PMC free article] [PubMed] [Google Scholar]
- 62.Dubois L.G., Campanati L., Righy C., D’Andrea-Meira I., Spohr T.C., Porto-Carreiro I., Pereira C.M., Balça-Silva J., Kahn S.A., DosSantos M.F. Gliomas and the vascular fragility of the blood brain barrier. Front. Cell. Neurosci. 2014;8:418. doi: 10.3389/fncel.2014.00418. [DOI] [PMC free article] [PubMed] [Google Scholar]
- 63.Leten C., Struys T., Dresselaers T., Himmelreich U. In vivo and ex vivo assessment of the blood brain barrier integrity in different glioblastoma animal models. J. Neurooncol. 2014;119:297–306. doi: 10.1007/s11060-014-1514-2. [DOI] [PubMed] [Google Scholar]
- 64.Candolfi M., Curtin J.F., Yagiz K., Assi H., Wibowo M.K., Alzadeh G.E., Foulad D., Muhammad A.K., Salehi S., Keech N. B cells are critical to T-cell-mediated antitumor immunity induced by a combined immune-stimulatory/conditionally cytotoxic therapy for glioblastoma. Neoplasia. 2011;13:947–960. doi: 10.1593/neo.11024. [DOI] [PMC free article] [PubMed] [Google Scholar]
- 65.Keir M.E., Butte M.J., Freeman G.J., Sharpe A.H. PD-1 and its ligands in tolerance and immunity. Annu. Rev. Immunol. 2008;26:677–704. doi: 10.1146/annurev.immunol.26.021607.090331. [DOI] [PMC free article] [PubMed] [Google Scholar]
- 66.Postow M.A., Callahan M.K., Wolchok J.D. Immune Checkpoint Blockade in Cancer Therapy. J. Clin. Oncol. 2015;33:1974–1982. doi: 10.1200/JCO.2014.59.4358. [DOI] [PMC free article] [PubMed] [Google Scholar]
- 67.Wainwright D.A., Chang A.L., Dey M., Balyasnikova I.V., Kim C.K., Tobias A., Cheng Y., Kim J.W., Qiao J., Zhang L. Durable therapeutic efficacy utilizing combinatorial blockade against IDO, CTLA-4, and PD-L1 in mice with brain tumors. Clin Cancer Res. 2014;20:5290–5301. doi: 10.1158/1078-0432.CCR-14-0514. [DOI] [PMC free article] [PubMed] [Google Scholar]
- 68.Yang J., Sanderson N.S., Wawrowsky K., Puntel M., Castro M.G., Lowenstein P.R. Kupfer-type immunological synapse characteristics do not predict anti-brain tumor cytolytic T-cell function in vivo. Proc. Natl. Acad. Sci. USA. 2010;107:4716–4721. doi: 10.1073/pnas.0911587107. [DOI] [PMC free article] [PubMed] [Google Scholar]
- 69.Mineharu Y., Kamran N., Lowenstein P.R., Castro M.G. Blockade of mTOR signaling via rapamycin combined with immunotherapy augments antiglioma cytotoxic and memory T-cell functions. Mol. Cancer Ther. 2014;13:3024–3036. doi: 10.1158/1535-7163.MCT-14-0400. [DOI] [PMC free article] [PubMed] [Google Scholar]
Associated Data
This section collects any data citations, data availability statements, or supplementary materials included in this article.