

Abstract
Light drives phytoplankton productivity, so phytoplankton must exploit variable intensities and durations of light exposure, depending upon season, latitude, and depth. We analyzed the growth, photophysiology and composition of small, Thalassiosira pseudonana, and large, Thalassiosira punctigera, centric diatoms from temperate, coastal marine habitats, responding to a matrix of photoperiods and growth light intensities. T. pseudonana showed fastest growth rates under long photoperiods and low to moderate light intensities, while the larger T. punctigera showed fastest growth rates under short photoperiods and higher light intensities. Photosystem II function and content responded primarily to instantaneous growth light intensities during the photoperiod, while diel carbon fixation and RUBISCO content responded more to photoperiod duration than to instantaneous light intensity. Changing photoperiods caused species‐specific changes in the responses of photochemical yield (e−/photon) to growth light intensity. These photophysiological variables showed complex responses to photoperiod and to growth light intensity. Growth rate also showed complex responses to photoperiod and growth light intensity. But these complex responses resolved into a close relation between growth rate and the cumulative daily generation of reductant, across the matrix of photoperiods and light intensities.
Keywords: cell size, diatom, electron transport, growth, photoperiod, photosystem II, RUBISCO, Thalassiosira
Abbreviations
- ANOVA
Analyses of Variance
- C:N
carbon‐to‐nitrogen
- F0′2s
base line fluorescence in the light adapted state
- F0
base line fluorescence in darkness
- FM′2s
maximal fluorescence in the light adapted state
- FM′
maximal fluorescence under growth light illumination
- FM
maximal fluorescence in darkness
- FRR
Fast Repetition Rate
- Fs
steady state fluorescence under growth light intensity
- KL
saturated growth light intensites
- L:D
Light:Dark
- PSII
Photosystem II
- RbcL
large protein subunit of the Ribulose‐1,5‐bisphosphate Carboxylase Oxygenase enzyme
- RUBISCO
Ribulose‐1,5‐bisphosphate Carboxylase Oxygenase
- μ
cell specific exponential growth rate
- μmax
maximum cell specific exponential growth rate
- σPSII′
effective absorbance cross‐section serving Photosystem II photochemistry
The effects of light intensity on the photosynthetic responses and growth rates of diatoms and other phytoplankton have been well studied (Platt and Jassby 1976, Falkowski et al. 1985, Falkowski and Raven 2007). Interactions between light intensity and nutrient limitation have also been explored (Shuter 1979, Laws and Bannister 1980, Sakshaug et al. 1989, Geider et al. 1998, Pahlow 2005, Loebl et al. 2010, Halsey and Jones 2015). Furthermore, the effects of fluctuating or oscillating light have been studied physiologically (Litchman 2000, 2003, Mackenzie and Campbell 2005, Wagner et al. 2005, Key et al. 2010, Orefice et al. 2016) and through competition models (Huisman et al. 1999a,b, Litchman and Klausmeier 2001, Litchman et al. 2004).
Beyond instantaneous light intensity, the diel light:dark cycle is a significant environmental variable; the diel light:dark cycle can regulate phytoplankton metabolic processes through the influences of photoperiod or of night length, maximum irradiance or spectral composition, or the oscillation pattern (Prézelin 1992, Orefice et al. 2016). Photoperiod varies seasonally at temperate to high latitudes, from total darkness during the high latitude winter, to constant illumination during the summer solstice. At mid‐latitudes, photoperiod waxes and wanes through the year on top of shorter term changes in light intensity imposed by mixing. Photoperiod length interacts with light intensity (Brand and Guillard 1981) and with the oscillation pattern (Orefice et al. 2016) to modulate photosynthesis and metabolism in diatoms, whose photosynthesis involves tight coupling between chloroplasts and mitochondria (Prihoda et al. 2012, Bailleul et al. 2015). Yet, surprisingly few studies (Chisholm and Costello 1980, Brand and Guillard 1981, Tilzer and Dubinsky 1987, Nielsen 1997, Tang and Vincent 2000, Walter et al. 2015) have systematically examined the effects of photoperiod on marine phytoplankton metabolism and physiology. In contrast, a recent meta‐analysis attempted to extrapolate phytoplankton growth responses to light intensity from data derived from studies with different applied photoperiods (Edwards et al. 2015).
Growth, photosynthetic, and adaptive traits are strongly influenced by organism size (McMahon and Bonner 1983, Peters 1983, Kooijman 1986, West et al. 1997, Marañón et al. 2007, 2013). Diatoms span a wide range of sizes (Beardall et al. 2009) and their metabolism and photophysiology show predictable patterns across related species of increasing size (Finkel 2001, Finkel et al. 2004, Key et al. 2010, Wu et al. 2014a,b). At least two broad categories of mechanisms conceptually connect organism size, photoperiod, light intensity, and growth rate. First, small cell volume could limit capacity for carbon storage of carbohydrate and lipid, resulting in limited flexibility in cellular carbon‐to‐nitrogen (C:N) ratios (Ross and Geider 2009), and limited energy reserves to fuel respiration to support dark synthesis of proteins and structural apparatus (Geider and Osborne 1989, Talmy et al. 2014). Alternately, cell size dependent differences in the coupling of reductant generation to retained carbon assimilation (Suggett et al. 2009, Halsey et al. 2010, 2013) could cause differences in growth rate responses to light intensity and photoperiod.
To explore the interacting effects of diatom cell size and photoperiod on the light responses of growth rate and physiology, we selected two coastal diatom strains differing by ~4 orders of magnitude in cell biovolume, Thalassiosira pseudonana (~40 μm3), and Thalassiosira punctigera (~300,000 μm3), and grew them under a matrix of different photoperiods and light intensities. To explore the underlying mechanisms linking growth rate with diatom cell size, photoperiod, and light intensity, we measured cellular carbon and nitrogen contents, Photosystem II (PSII) electron transport, cellular PSII content, Ribulose‐1,5‐bisphosphate Carboxylase Oxygenase (RUBISCO) activity and cellular RUBISCO content. Our experiments led us to ask how cell size and photoperiod interact to influence the coupling of photosynthetically generated reductant to carbon assimilation and to growth.
Materials and Methods
Culture protocol and growth rate
We semicontinuously cultured two strains of coastal, temperate, marine centric diatoms, T. pseudonana (CCMP 1335; ~40 μm3) and T. punctigera (CCAP 1085/19) (~300,000 μm3) obtained from the Provasoli‐Guillard National Center of Marine Phytoplankton, with f/2 medium (Guillard and Ryther 1962) in 2 L polycarbonate bottles (Nalgene, USA) at 18°C. During cultivation, the culture bottles were manually shaken 2–3 times a day and arbitrarily distributed in a growth chamber. Light in the chamber was provided by fluorescent tubes (Sylvania 17W T8 4100K) automatically turned on at 08:00 and maintained continuously (24:0 Light:Dark (L:D) cycle) or turned off at 12:00 (4:20 L:D cycle), 16:00 (8:16 L:D cycle), or 24:00 (16:8 L:D cycle) in a square‐wave pattern (Orefice et al. 2016). Cultures under all four L:D cycles were grown under 75, 150, and 300 μmol photons · m−2 · s−1, measured with a microspherical quantum sensor (US‐SQS; Waltz, Germany) submersed in a culture bottle filled with seawater. In addition, 24:0 L:D cultures were grown under 25 μmol photons · m−2 · s−1, to achieve light limitation of growth rate under continuous light, where growth rate was already nearly saturated at 75 μmol photons · m−2 · s−1. 4:20 L:D cultures were also grown under 600 μmol photons · m−2 · s−1, because 300 μmol photons · m−2 · s−1 did not saturate growth rate under this short photoperiod. We grew two or three replicate culture bottles of each species under each combination of light intensity and photoperiod, for a total of 60 separate semi‐continuous cultures.
To track the growth of small T. pseudonana, we measured fluorescence from culture samples with excitation of 440 nm and emission at 650 nm at 10:00 a.m. every day (Molecular Devices SpectraMax Gemini EM), before and after dilutions with sufficient fresh media to maintain cultures between 110 and 220 ng Chlorophyll a · mL−1. To track the growth of larger T. punctigera, we took duplicate 2 mL samples at 10:00 a.m. and fixed in Lugol's acid solution, and then counted cells with a Sedgwick Rafter chamber under an inverted microscope. The cell density for T. punctigera was maintained at 676–1,100 cells · mL−1, equivalent to 60–114 ng Chlorophyll a · mL−1. The cell specific exponential specific growth rate was estimated as:
where Nt is the culture fluorescence or cell number at time t, N0 is the fluorescence or cell number at time 0, and Δt is the time elapsed from time 0 to time t. At least 15 transfers of semi‐continuous dilution were done for cultures growing under each regime of photoperiod and light intensity, resulting in more than 12 cellular generations before sampling.
Sampling protocol
Samples to measure the chlorophyll fluorescence induction and relaxation kinetics, RUBISCO, carbon and nitrogen contents were taken at two hours prior to dawn (06:00), immediately prior to dawn (08:00), then every 2 h within the illuminated period, and again two hours after lights off. In total, nine sample time points were taken from the 16:8 L:D treatment, seven from the 8:16 L:D treatment, and five from 4:20 L:D treatment. Samples were taken at 06:00, 10:00, and 18:00 for the 24:0 L:D treatment. At each sampling point, the 2 L bottle was gently mixed to disperse the cell suspension prior to withdrawal of samples.
Fluorometer measurements
At each time point a 2 mL sample taken from each 2 L bottle was incubated in darkness for 5 min within a cuvette with temperature control (18°C). Chlorophyll fluorescence kinetics was measured using the Fast Repetition Rate (FRR) fluorescence technique (FL 3500; Photon Systems Instruments, Czech Republic) (Kolber et al., 1998). A train of 40 × 1.2 μs flashlets of blue light (455 nm; ~100,000 μmol photons · m−2 · s−1) were applied over 128 μs to progressively close PSII reaction centers. The sample was then allowed to relax over 2 s of darkness, followed immediately by a second flashlet train. This chlorophyll fluorescence induction protocol was then repeated after 2 min exposure to growth light intensity. We analyzed the resulting FRR induction curve with the PSIWORX script (A. Barnett, sourceforge.net) for MATLAB software, and derived the base line fluorescence in darkness (F0) or steady state fluorescence under growth light intensity (Fs), the maximal fluorescence in darkness (FM), or under growth light illumination (FM′), and the base line and maximal fluorescence in the light adapted state, F0′2s and FM′2s, which were measured after 2 s of darkness following the fluorescence induction under growth light. We used the magnitude of any increase from FM′ to FM′2s to apply a proportional correction to F0′2s to estimate the actual level of F0′ prevailing under illumination (Oxborough and Baker 1997, Ware et al. 2015):
We followed (Suggett et al. 2009, Huot and Babin 2010) to estimate the rate of reductant generation from PSII under the growth light intensity applied during the photoperiod, as:
where σPSII′(A2 · quanta−1) is the effective absorbance cross‐section serving PSII photochemistry at growth light intensity I (photons · A−2 · s−1), and qP, (FM′‐FS)/(FM′‐F0′) is the proportion of PSII instantaneously open and ready to perform photochemistry under light intensity I. We estimated the functional pool of PSII centres competent for photochemistry, PSIIactive, using a linear calibration of F0′/σPSII′ compared with oxygen flash yield measures of [PSIIactive] from culture samples of T. pseudonana and T. punctigera (Oxborough et al. 2012, Silsbe et al. 2015).
We estimated the electron transport rate per total protein as:
Carbon and nitrogen analyses
At each sampling point 20 mL of culture was filtered onto a pre‐combusted (5 h, 450°C) Whatman GF/F glass fiber filter (13 mm in diameter), followed by 10 mL of 50 mmol · L−1 HCl to dispel inorganic carbon on filters, which were then dried in an oven at 55°C for 12 h and stored in a desiccators for later analyses. Cellular carbon and nitrogen contents were measured with a Vario EL III Elemental Analyzer (Elementar, Hanau, Germany). In parallel with culture filtering equivalent 20 mL media volumes were filtered through pre‐combusted GF/F filters. These blank filters were interspersed with sample filters during the elemental analyses. C of blank filters accounted for less than 5% of the total C in the culture samples while and N of blank filters accounted for less than 10% of total N in the culture filters. Filter blank determinations were subtracted from culture C & N determinations before further analyses.
Cell count, protein, and Chlorophyll a measurements
At each sampling point duplicate 2 mL samples were fixed in Lugol's acid solution. The cell suspension density was then measured with a Coulter Z2 counter (Beckman Instruments, Mississauga, Canada) for T. pseudonana and with a Sedgwick Rafter chamber under an inverted microscope for T. punctigera. At the same time, 50 mL of culture was vacuum‐filtered onto a binder‐free Whatman GF/F glass fiber filter (25 mm in diameter), which was immediately flash frozen in liquid nitrogen and stored at −80°C until later analyses of proteins and chlorophyll.
Total protein was extracted from the frozen filters into 450 μL of denaturing extraction buffer (0.1375 mol TRIS · L−1 buffer, 0.075 mol Lithium Dodecyl Sulfate · L−1, 1.075 mol glycerol · L−1, 0.5 mmol EDTA · L−1, 0.1 mg Pefabloc · mL−1; Roche) (Brown et al. 2008). The filters were suspended in the extraction buffer and subjected to three cycles of 60 s at 6.5 m · s−1 to break up cells using a MPBio FastPrep®‐24 instrument with bead lysing matrix D (MPBio SKU 116913050). We then measured the concentration of total protein in the extracts using a Bio‐Rad DC protein assay kit (500‐0116) with known BGG standards. We loaded extract containing 0.5 μg of total protein onto 4%–12% acrylamide precast NuPAGE gels (Invitrogen, ThermoFisher, Ottawa, Canada) in parallel with a range of 1,500, 750, 375, 187.5 fmol large protein subunit of the Ribulose‐1,5‐bisphosphate Carboxylase Oxygenase enzyme (RbcL) standard per standard lane (Agrisera, www.agrisera.se, AS01 017S) to establish a standard curve for determination of RUBISCO large subunit (RbcL) content in the samples. We ran electrophoresis for 25 min at 200 V and transferred proteins to a polyvinylide fluoride membrane for 60 min at 30 V. After membrane blocking with 2% (g · mL−1) ECL Advance blocking reagent (GE Healthcare, Mississsauga, Canada), we applied a primary antibody (Agrisera, AS03 037, 1:20,000 in 2% ECL Advance blocking dilution), then an anti‐rabbit secondary antibody coupled with horseradish peroxidase (Agrisera, AS09 602, 1:20,000). After this, we developed the membranes with chemoluminescence using ECL Advance (GE Biosciences) and imaged under a CCD imager (BioRadVersaDoc 4000MP). Finally, we quantified RbcL by fitting the sample signal values to the protein standard curves, taking care that all sample signals fell within the range of protein standard curve and that no band signals were saturated (Brown et al. 2008).
To measure chlorophyll a, 60 μL of the protein extract was added to 440 μL 90% acetone (v/v) saturated with magnesium carbonate; after 15 min extraction in the dark at 4°C and 2 min centrifugation (13,000 g), we measured the absorbance of the supernatant at 664, 630, and 750 nm using a UV/VIS photospectrometer (UV‐1800, Shimadzu, Japan). We estimated chlorophyll a content (Jeffrey and Humphrey 1975) as:
Data analysis
We fit the response of growth rate to culture growth light intensity using the equation of (Eilers and Peeters 1988):
where μ is cell specific exponential growth rate (d−1) at the particular light intensity; I is the growth light (μmol photons · m−2 · s−1) and a, b and c are parameters to constrain the equation to the plot of measured values for μ across a range of growth light intensity. We calculated the maximum cell specific exponential growth rate (μmax) as:
and saturated growth light intensites (KL) as:
Because of our experimental design, we lacked sufficient determinations of μ under low light intensities to reliably estimate the more familiar KE light saturation parameter (MacIntyre and Cullen 2005).
We estimated apparent carbon assimilation per RUBISCO active site (C · RbcL−1 · s−1) as:
where μ (units of s−1) is cell specific exponential growth rate. (24 H/Photoperiod H) assigns 24 h of diel C assimilation to RUBISCO activity during the photoperiod hours only.
We used ANOVA with Bonferroni or Tukey post‐tests (Prism 5, Graphpad Software, La Jolla, CA, USA; RStudio 0.99.491) and comparisons of linear and non‐linear curve fits to detect significant differences among cultures of each species from each L:D cycle and growth light intensity.
Results
In the smaller diatom T. pseudonana, the response of cell specific growth rate (μ) to increasing growth light intensity (Fig. 1A) was strongly influenced by the length of the photoperiod. Under continuous 24:0 L:D, T. pseudonana showed a sharp rise in μ from low to moderately low light, followed by growth inhibition at 150 μmol photons · m−2 · s−1 and above. As the photoperiod decreased, the response of growth to light intensity became progressively weaker, and maximum growth rate μmax decreased. Thus, under the shortest photoperiod (4:20 L:D), T. pseudonana showed little change in μ across the range of lights from 75 to 600 μmol photons · m−2 · s−1 (Fig. 1A), although under this short photoperiod the cells were unable to reliably maintain growth at 25 μmol photons · m−2 · s−1 (data not shown). The larger diatom T. punctigera showed an opposing pattern of growth responses to photoperiod; μ increased as photoperiod decreased, and μ reached higher values at 150 μmol photons · m−2 · s−1 or above (Fig. 1B).
Figure 1.

Cell specific exponential growth rate (μ, d−1) as a function of culture growth light intensity during the photoperiod (μmol photons · m−2 · s−1) (A, B) or of daily cumulative photons (μmol photons · m−2 · d−1) (C, D) for a small diatom Thalassiosira pseudonana (A, C) or a large diatom Thalassiosira punctigera (B, D) at light:dark (L:D) cycles of 24:0 (filled circles), 16:8 (open circles), 8:16 (open triangles), and 4:20 (filled triangles). Points show average growth rate determinations from two or three independently grown cultures; the range of replicated points falls within the symbol size. Solid lines in A and B show light intensity response curves of growth rate fitted with the equation of (Peeters and Eilers 1978, Eilers and Peeters, 1988). Bold line in C shows linear regression of pooled μ to daily cumulative photons under subsaturating growth light conditions; thin dashed lines show 95% confidence intervals on the fitted curves.
We chose combinations of growth light intensities and photoperiods to achieve equivalent cumulative photons per day from multiple combinations of light intensity and photoperiod. At subsaturating growth light intensities, T. pseudonana showed a positive, linear response of μ to cumulative photons per day (r 2 = 0.90; F 1,12 = 106.4; slope significantly greater than 0, P < 0.0001; Fig. 1C). But at a given cumulative photon dose such as ~4 or ~8 mol photons · m−2 · d−1, μ varied widely, depending upon whether the light intensity was sub‐ or super‐saturating for growth, which in turn depended upon the photoperiod over which, the photons were applied (Fig. 1C). In contrast, in T. punctigera μ responded primarily to photoperiod, with only modest growth rate responses to daily cumulative photon dose (Fig. 1D).
We used the curve fits in Figure 1, A and B to extract estimates of μmax, and then plotted them with 95% confidence intervals versus photoperiod (Fig. 2A). For T. pseudonana μmax showed a non‐linear increase with increasing photoperiod (r 2 = 0.99, Absolute Sum of Squares 6.467 × 10⁻⁶. Standard deviation of residuals = 0.002543, df = 1). In T. punctigera μmax under the shortest photoperiods overlapped with t μmax from T. pseudonana, but as photoperiod increased μmax decreased for T. punctigera (r 2 = 0.86; F 1,2 = 12.24; slope not significantly less than 0, P < 0.09) to levels well below the confidence intervals for μmax for T. pseudonana measured at equivalent photoperiods (Fig. 2A). Thus, the general pattern of decreasing maximal growth rates with increasing cell size within a taxonomic group (Finkel et al. 2004, Beardall et al. 2009) can actually reverse, depending upon the photoperiod. In both diatoms, the light saturation parameter KL decreased with increasing photoperiod (two‐way ANOVA, F 3,8 = 496.5, P < 0.0001), but across the photoperiods T. punctigera showed consistently higher KL (two‐way ANOVA, F 1,8 = 234.2, P < 0.0001) and thus required a higher light intensity to saturate growth rate. The smaller and larger diatoms thus show contrasting growth responses: T. pseudonana showed growth rate advantages under long photoperiods and light intensities below 150 μmol photons · m−2 · s−1 (Fig. 1A); whereas T. punctigera showed growth advantages under short photoperiods and light intensities at or above 150 μmol photons · m−2 · s−1 (Fig. 1B).
Figure 2.

Maximum cell specific exponential growth rate (A, μmax, d−1) and saturation growth light (KL) (B, μmol photons · m−2 · s−1) derived from the growth versus irradiance curves (Fig. 1, A and B), plotted as a function of photoperiod for T. pseudonana (open circles) and T. punctigera (filled circles). Solid lines in A show single phase exponential rise to a plateau for T. pseudonana, and a linear decrease for T. punctigera; thin dashed lines show 95% confidence intervals on the fitted curves. Error bars on points show the 95% confidence intervals on the fitted parameters, derived from the curves in Figure 1.
We sought to understand the mechanisms for these contrasting responses to light intensity and photoperiod by analyzing cell C and N, PSII, and carbon metabolism. The cell volume of T. pseudonana showed only limited responses to instantaneous growth light intensity or to photoperiod (Fig. S1A in the Supporting Information), but in T. punctigera cell volume increased under 24:0 L:D when growth was slowest (Fig. S1B). In T. pseudonana, average cellular carbon content increased at the lowest light intensity (Fig. S1C), but there was no obvious pattern of changing carbon content with instantaneous growth light intensity, nor with photoperiod in T. punctigera (Fig. S1D). These determinations of carbon contents represent averages over multiple determinations made across the diel cycles (Table 1). Interestingly, the combination of treatments that provoked the largest variation in diel C:N was the 4:20 L:D 600 μmol photons · m−2 · s−1 treatment of T. pseudonana (Fig. S2G in the Supporting Information), the highest growth light intensity condition for the smaller cells.
Table 1.
Cellular contents (mean ± SD) of carbon (C, pg · cell−1 or ng · cell−1), nitrogen (N, pg · cell−1 or ng · cell−1), mole C:N, chlorophyll a (Chl a, pg · cell−1 or ng · cell−1) and proteins (pg · cell−1 or ng · cell−1) for T. pseudonana and T. punctigera. These determinations represent averages over multiple determinations made across the diel cycles from two separate culture replicates for each condition. n = 4–8 depending upon condition
| Species | L:D cycles | Growth light (μmol photons · m−2 · s−1) | N (pg · cell−1) | C (pg · cell−1) | Mole C:N | Chl a (pg · cell−1) | Protein (pg · cell−1) |
|---|---|---|---|---|---|---|---|
| T. pseudonana | 24:0 | 25 | 16.3 ± 3.76 | 124 ± 25 | 8.90 ± 0.29 | 0.67 ± 0.025 | 7.74 ± 0.12 |
| 75 | 10.3 ± 0.04 | 69.4 ± 4.6 | 7.85 ± 0.48 | 0.28 ± 0.010 | 4.96 ± 0.25 | ||
| 150 | 10.0 ± 0.54 | 63.7 ± 2.1 | 7.40 ± 0.14 | 0.18 ± 0.015 | 4.19 ± 0.64 | ||
| 300 | 10.5 ± 1.19 | 65.2 ± 1.7 | 7.26 ± 0.62 | 0.13 ± 0.009 | 4.23 ± 0.53 | ||
| 16:8 | 75 | 10.7 ± 1.93 | 87.4 ± 21.3 | 9.51 ± 0.63 | 0.34 ± 0.071 | 5.04 ± 1.04 | |
| 150 | 11.0 ± 3.11 | 72.7 ± 1.4 | 8.01 ± 2.12 | 0.21 ± 0.031 | 3.79 ± 0.28 | ||
| 300 | 7.53 ± 0.08 | 60.1 ± 1.6 | 9.28 ± 0.17 | 0.12 ± 0.001 | 4.03 ± 0.09 | ||
| 8:16 | 75 | 13.0 ± 0.77 | 85.4 ± 1.3 | 7.66 ± 0.31 | 0.46 ± 0.001 | 5.95 ± 0.01 | |
| 150 | 14.0 ± 0.60 | 83.4 ± 4.6 | 6.93 ± 0.06 | 0.38 ± 0.004 | 5.63 ± 0.62 | ||
| 300 | 11.1 ± 0.03 | 65.9 ± 0.4 | 6.87 ± 0.07 | 0.23 ± 0.011 | 4.47 ± 0.04 | ||
| 4:20 | 75 | 16.3 ± 0.76 | 95.6 ± 9.2 | 6.81 ± 0.32 | 0.50 ± 0.012 | 7.50 ± 0.29 | |
| 150 | 13.1 ± 0.80 | 83.5 ± 6.3 | 7.45 ± 1.02 | 0.37 ± 0.001 | 6.06 ± 0.03 | ||
| 300 | 11.6 ± 0.49 | 74.1 ± 3.6 | 7.43 ± 0.41 | 0.33 ± 0.007 | 6.01 ± 0.19 | ||
| 600 | 11.8 ± 0.54 | 90.1 ± 0.8 | 8.76 ± 0.52 | 0.34 ± 0.003 | 7.29 ± 0.96 | ||
| T. punctigera | 24:0 | 25 | 8.45 ± 0.34 | 42.5 ± 3.8 | 5.04 ± 0.65 | 0.53 ± 0.015 | 45.3 ± 8.63 |
| 75 | 10.4 ± 0.14 | 48.1 ± 0.1 | 4.66 ± 0.06 | 0.90 ± 0.097 | 44.3 ± 5.94 | ||
| 150 | 12.1 ± 0.23 | 58.6 ± 1.2 | 4.85 ± 0.02 | 1.21 ± 0.010 | 48.2 ± 0.03 | ||
| 300 | 10.2 ± 0.99 | 47.8 ± 4.7 | 0.69 ± 0.00 | 0.48 ± 0.044 | 35.3 ± 0.75 | ||
| 16:8 | 75 | 7.76 ± 0.09 | 34.9 ± 0.3 | 4.50 ± 0.02 | 1.03 ± 0.022 | 28.4 ± 0.68 | |
| 150 | 8.55 ± 0.66 | 39.1 ± 1.0 | 4.58 ± 0.22 | 1.28 ± 0.031 | 39.0 ± 1.77 | ||
| 300 | 10.3 ± 0.18 | 52.3 ± 0.6 | 5.10 ± 0.15 | 1.11 ± 0.012 | 50.0 ± 3.75 | ||
| 8:16 | 75 | 9.44 ± 0.44 | 41.4 ± 0.2 | 4.38 ± 0.22 | 1.49 ± 0.092 | 43.5 ± 3.82 | |
| 150 | 8.83 ± 0.33 | 39.7 ± 1.3 | 4.49 ± 0.02 | 1.10 ± 0.039 | 39.1 ± 4.17 | ||
| 300 | 8.80 ± 0.21 | 43.2 ± 0.7 | 4.89 ± 0.19 | 0.95 ± 0.033 | 32.3 ± 0.66 | ||
| 4:20 | 75 | 9.39 ± 0.25 | 39.1 ± 1.4 | 4.17 ± 0.03 | 0.50 ± 0.014 | 27.0 ± 4.78 | |
| 150 | 10.0 ± 0.10 | 45.1 ± 1.3 | 4.50 ± 0.18 | 1.39 ± 0.164 | 45.3 ± 1.03 | ||
| 300 | 10.7 ± 0.01 | 50.0 ± 0.4 | 4.68 ± 0.04 | 1.24 ± 0.108 | 47.3 ± 1.37 | ||
| 600 | 10.4 ± 0.98 | 45.2 ± 0.9 | 4.36 ± 0.34 | 0.72 ± 0.036 | 38.5 ± 0.17 |
We next examined the function and content of PSII, to assess the generation of reductant in the cells across diel cycles and light intensities. In T. pseudonana, the reductant generation rate per PSII showed a smooth response to instantaneous light intensity, peaking under 300 μmol photons · m−2 · s−1, with only modest effects of photoperiod on the pattern (Fig. 3A). T. punctigera, in contrast, showed a strong response of the reductant generation rate per PSII to photoperiod with suppression of reductant generation per PSII across all growth light intensities under a 24:0 L:D cycle, and accelerated reductant generation per PSII under the 4:20 L:D cycle and high light (Fig. 3B). The content of PSIIactive generally decreased with increasing growth light in T. pseudonana (Fig. 3C), but not in T. punctigera (Fig. 3D), with scattered effects of photoperiod in each species. Thus, PSII function and content respond primarily to instantaneous growth light intensity in T. pseudonana, and to both growth light intensity and photoperiod in T. punctigera (Fig. 3).
Figure 3.
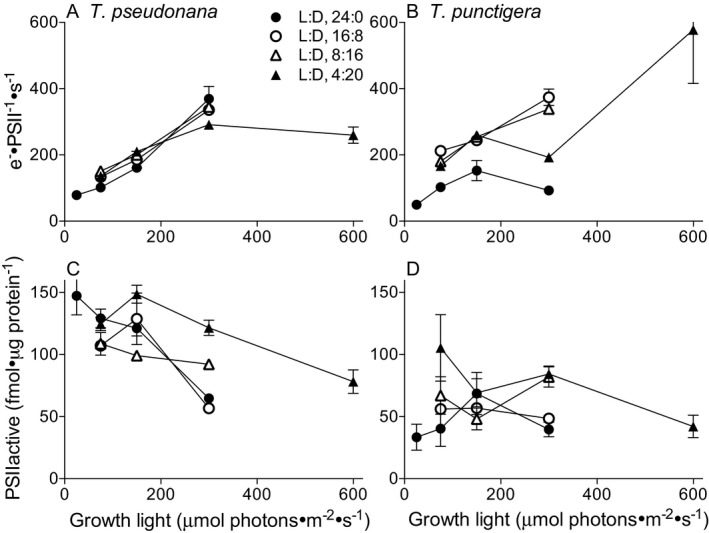
Photosystem II electron transport rate (e− · PSII −1 · s−1) under illumination (A, B) and PSII active content (fmol · μg protein−1) (C, D) versus growth light (μmol photons · m−2 · s−1) for T. pseudonana (A, C) and T. punctigera (B, D) at L:D cycles of 24:0 (filled circles), 16:8 (open circles), 8:16 (open triangles), and 4:20 (filled triangles). Points show averages from each of 2 or 3 independently grown cultures; error bars show range of 2 replicated points and standard deviation of 3 replicated points, often within symbols. Each replicate was in turn each based upon an average of 5–9 repeated determinations taken within a diel cycle from a culture.
To assess the performance of assimilation of carbon into biomass we used cellular carbon content, cell specific growth rate (s−1) and RbcL content to estimate a lower bound on achieved RUBISCO turnover rate. This lower bound estimator neglects any carbon that is fixed through RUBISCO but then respired or released to the media as dissolved organic carbon, which we did not measure. In both T. pseudonana (Fig. 4A) and particularly in T. punctigera (Fig. 4B) as photoperiod decreased to 4:20 L:D achieved RUBISCO performance increased. To our surprise, the achieved RUBISCO turnover rate for T. punctigera under 4:20 L:D cycle was 8 times higher than under 24:0 L:D cycle, with little effect of growth light intensity (Fig. 4B). The content of intact RbcL protein varied across growth conditions with photoperiod generally showing more effect than instantaneous growth light intensity, particularly for the smaller T. pseudonana (Fig. 4, C and D). T. punctigera also showed a significant accumulation of RbcL fragments and larger products consistent with reactive oxygen stress (Wilson et al. 1995, Gerhardt et al. 1999, Nakano et al. 2010; Fig. S3 in the Supporting Information), particularly under the 24 h photoperiod.
Figure 4.
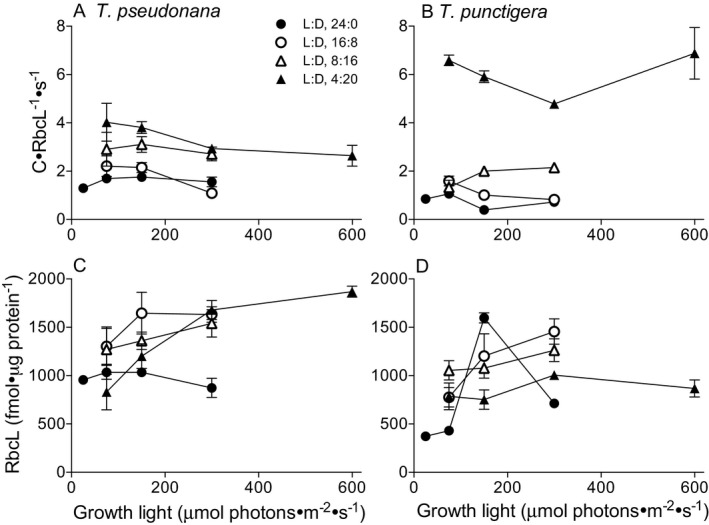
Apparent carbon assimilation per RUBISCO active site (C · RbcL−1 · s−1) under illumination (A, B) and RbcL content (fmol · μg protein−1) (C, D) versus growth light (μmol photons · m−2 · s−1) for T. pseudonana (A, C) and T. punctigera (B, D) at L:D cycles of 24:0 (filled circles), 16:8 (open circles), 8:16 (open triangles), and 4:20 (filled triangles). Points show averages from each of 2 or 3 independently grown cultures; error bars show range of 2 replicated points and standard deviation of 3 replicated points, often within symbols. Each replicate was in turn each based upon an average of 5–9 repeated determinations taken within a diel cycle from a culture.
To integrate these complex patterns, we compared retained carbon assimilation with reductant generation. To do so, we needed a common basis of normalization. Our estimates of protein · cell−1 did not vary significantly through the diel cycle, and allowed comparison of patterns between the small T. pseudonana and the large T. punctigera. In this study and in related papers (Wu et al. 2014b, Li et al. 2015), protein content proved our most reliable and general basis for comparison of different data types across the samples and species. Normalization to chlorophyll is common in the oceanographic literature, but chlorophyll is a major component of PSII and its associated pigment protein complexes, while chlorophyll is not present within RUBISCO. So normalization of carbon assimilation and electron generation to total protein avoided co‐variance of chlorophyll and PSII content. We therefore plotted the retained carbon assimilation rate per total cellular protein versus electron transport rate per total protein (Fig. 5, A and B) to show the instantaneous coupling of reductant generation at PSII to carbon assimilation (Halsey et al. 2010, 2013, Lawrenz et al. 2013), across the range of growth light intensities and photoperiods. In Figures 5, A and B the fine dotted line shows the theoretical maximum of one carbon to four electrons (1C: 4 e−), assuming no diversion of electrons to other metabolic pathways and a 4 e− reduction of CO2 to (CH2O), with no accumulation of more reduced (CH2) compounds.
Figure 5.

Carbon fixation rate per cellular total protein (pmol C · μg protein−1 · s−1) as a function of electron transport rate per total protein (pmol e− · μg protein−1 · s−1) for T. pseudonana (A) or T. punctigera (B) under L:D cycles of 24:0 (filled circles), 16:8 (open circles), 8:16 (open triangles), and 4:20 (filled triangles). The fine dotted line shows the theoretical maximum of 1C: 4 e−, assuming the 4 e− reduction in CO 2 to (CH 2O) and no diversion of electrons to other metabolic pathways. Cell specific exponential growth rate (μ, d−1) as a function of daily cumulative electron transport rate per total protein (μmol e− · μg protein−1 · d−1) for T. pseudonana (C) or T. punctigera (D). Solid lines: fitted curve with the growth‐irradiance equation (A, C) or linear regression (B, D); thin dashed lines show 95% confidence intervals on the fitted curves. Oval in A outlines T. pseudonana measures from 24:0 L:D cycle at 300 μmol photons · m−2 · d−1 excluded from the curve fit. Measurements from the same samples in the oval in C were included in the curve fit. Ovals in B and D outline T. punctigera under 4:20 L:D cycles, excluded from the linear regression.
Thalassiosira pseudonana (Fig. 5A) showed a saturating response of carbon assimilation rate to photochemical electron generation rate, with an initial slope of ~0.1 at low electron generation rates. The carbon assimilation rate per cellular total protein for T. pseudonana reached a maximum of 3.7 pmol C · μg protein−1 · s−1 when the electron transport rate saturated at 37 pmol e− · μg protein−1 · s−1, derived from a fitted P‐E curve (Peeters and Eilers 1978, Eilers and Peeters 1988, Macedo et al. 1998). Thalassiosira pseudonana cultures growing under 24:0 L:D and high instantaneous light intensity (closed circles, enclosed in oval) fell below the 95% confidence interval for the trend line fit to the rest of the data set and so were excluded from this curve fit. For 8:16, 16:8, and 24:0 L:D photoperiods T. punctigera showed a near linear response of carbon fixation to increasing photochemical electron generation (r 2 = 0.73; F 18 = 47.63; slope significantly different from 0, P < 0.0001), with no indication of saturation (Fig. 5B). The slope of the regression was, however, only 0.07 ± 0.01 C · e−1, far below the 0.25 slope of the 1 C: 4 e− line. Therefore in T. punctigera under most growth light intensities and photoperiods, the coupling of photochemical reductant generation to retained carbon assimilation was significantly lower than in T. pseudonana based upon the confidence intervals of the fitted data. Thalassiosira punctigera growing under 4:20 L:D was a notable exception. Under this short photoperiod, T. punctigera achieved a coupling of photochemical generation of reductant to retained carbon at or near the theoretical maximum of 1 C: 4 e− (Fig. 5B), and well above the upper 95% CI for the fitted regression for the other photoperiods. This unexpectedly strong coupling of electron transport to retained carbon fixation then underpins the strong growth performance of T. punctigera under the shortest photoperiod.
To extend these measures of instantaneous photochemical performance, we plotted cell specific growth rate versus the cumulative diel photochemically generated reductant, normalized to total protein content. In T. pseudonana, μ shows a smoothly saturating response to increasing cumulative photochemical electrons per day across all combinations of growth light and photoperiod, with growth saturation of 0.64 d−1 determined from the curve fit, achieved at ~1.26 μmol e− · μg protein−1 · d−1 (Fig. 5C). This plot of μ versus cumulative electron generation largely reconciles the complex interacting effects of growth light and photoperiod upon growth (Fig. 1).
In T. punctigera under 8:16, 16:8, and 24:0 L:D photoperiods μ responds linearly to increasing cumulative photochemical electron generation (r 2 = 0.53; F 18 = 19.8; slope significantly different from 0, P < 0.0003; Fig. 5D), but with a significantly lower growth rate yield of reductant than in T. pseudonana (Fig. 5C) based upon the confidence intervals of the fitted data. The 4:20 L:D condition is again a notable exception (dotted oval; Fig. 5D), where T. punctigera achieves a growth yield per reductant higher than T.pseudonana at comparable daily reductant generation (Fig. 5C). We can thus largely reconcile the complex growth responses of T. pseudonana and T. punctigera to light intensity and photoperiod as driven by cumulative daily photochemical reductant generation, with higher performance in T. punctigera under short day/long night conditions because of high coupling of generated reductant to retained C under that combination of conditions.
We summarized these responses by plotting the retained carbon: electron ratio (C:e−) versus cumulative daily photons (Fig. 6, A and B). Thalassiosira pseudonana shows the highest C:e− at lower daily photon doses, with some scatter depending upon the photoperiod over which the photons were delivered. Thalassiosira punctigera also shows maximal C:e− at the lowest daily photon dose (Fig. 6B), with C:e− values at the 4:20 L:D growth condition remarkably close to the theoretical maximum of 0.25 C:e−.
Figure 6.

Carbon fixation per PSII transported electron (C/e−) versus daily cumulative photons (μmol photons · m−2 · d−1) for (A) T. pseudonana and (B) T. punctigera under L:D cycles of 24:0 (filled circles), 16:8 (open circles), 8:16 (open triangles), and 4:20 (filled triangles). Points show averages from 2 or 3 independently grown cultures; error bars show range of duplicated points and standard deviation of triplicated points, many bars fall within the size of the symbols. Horizontal dotted line shows 0.25 theoretical maximum 1C: 4 e−.
Discussion
We found systematic differences in the growth rate responses of two coastal marine centric diatoms differing by ~4 orders of magnitude in cell biovolume, cultured under a matrix of light intensities and photoperiods. We selected these related species as representatives from a wider panel of marine centric diatoms, which have shown consistent patterns of cell‐size dependencies in their responses to light, photoinactivation, ocean acidification, and growth rates (Finkel 2001, Finkel et al. 2004, Key et al. 2010, Wu et al. 2014a,b).
The two diatoms showed complex and contrasting growth and photophysiological responses to light and photoperiod, which were not readily reconciled by separately examining their PSII activity (Fig. 3) nor their RUBISCO turnover (Fig. 4). Their overall growth responses were, however, largely reconciled by comparing their growth rate to cumulative photochemical reductant generation, which we were able to track using a new approach to quantitate the pool of active PSII contributing to reductant generation (Oxborough et al. 2012, Silsbe et al. 2015), in combination with an established approach to estimate the photochemical generation of electrons per PSII (Suggett et al. 2009, Huot and Babin 2010). In T. pseudonana growth showed a saturating response to increasing cumulative photochemical electrons, because the growth return per electron decreases as photoinhibition (Key et al. 2010) and dissimilatory electron flows (Waring et al. 2010) accelerate under high light (Fig. 5C). In T. punctigera, growth showed a linear response to increase cumulative photochemical electrons, albeit at a lower growth yield per electron than in T. pseudonana (Fig. 5D). Growth under 4:20 L:D in T. punctigera proved the exception to the linear trend, with the strain achieving much higher growth yields per electron under this short photoperiod.
The smaller diatom T. pseudonana grew slowly under the shortest photoperiod, and fastest under 24:0 L:D (Fig. 1A), consistent with a pattern established for coastal strains (Brand and Guillard 1981). Thalassiosira pseudonana thus shows no need for a dark period to achieve maximum growth rate. In contrast, the larger coastal diatom T. punctigera achieved maximum growth rate under 4:20 L:D, while longer photoperiods slowed growth (Fig. 1B), consistent with a pattern common in offshore phytoplankton species (Brand and Guillard 1981). As noted by (Brand and Guillard 1981) for temperate strains, there is no direct selective pressure for exploitation of continuous 24:0 L:D, so the capacity to achieve maximum growth under 24:0 L:D suggests the absence of a requirement for a dark period, or absence of requirement for a regular photoperiod, rather than selection for exploitation of 24:0 L:D per se. Brand and Guillard (1981) argued that coastal strains are selected to exploit instantaneous light, of whatever duration, to cope with fluctuating light and nutrients in coastal environments (MacIntyre et al. 2000, Litchman et al. 2009), leading to a pleiotropic result of a capacity for rapid growth under continuous light. Indeed, T. pseudonana exploits rapidly fluctuating light regimes in part through an up‐regulation of its light harvesting capacity (Grouneva et al. 2016) to exploit low light periods, which is feasible because of the rapid regulation of counter‐balancing excitation dissipation in diatoms (Lavaud 2007, Lavaud and Lepetit 2013) after shifts to higher light.
In contrast to T. pseudonana, we noted that T. punctigera accumulated a ~118 kDa product that reacts with anti‐RbcL antibody, consistent with an RbcL‐RbcL cross‐link product, in parallel with accumulation of smaller fragments of 26 and 45 kDa that are immuno‐reactive with the anti‐RbcL antibody (Fig. S3, A and B). None of these products were apparent in the protein extracts from T. pseudonana from any growth condition. Proteins form di‐tyrosine cross‐links triggered by reactive oxygen species (ROS) (Berlett and Stadtman 1997, Larios et al. 2001, Yamamoto 2001) in a range of systems. The large subunit of RUBISCO, RbcL, indeed forms covalent cross‐links with the smaller RbcS subunit under UV stress (Wilson et al. 1995, Gerhardt et al. 1999). Under ROS stress RbcL also fragments (Nakano et al. 2010) generating detectable products. In T. punctigera, the abundance of these RbcL products correlates with the 24 h continuous photoperiod growth condition, which strongly inhibited the growth rate of T. punctigera. We therefore hypothesize that T. punctigera has limited capacity to counter reactive oxygen toxicity during illumination and uses a daily dark period to allow detoxification or repair processes to catch up with products of light‐driven reactive oxygen stress.
At least two mechanisms could cause cell size dependent changes in growth rate across different photoperiods. First, large cells with high capacity for variation in C:N ratio could be better adapted to long periods in the dark since they can draw upon a large energy reserve to fuel respiratory costs of nutrient assimilation and biosynthesis in the dark (Talmy et al. 2014). The diatom Skeletonema costatum growing under high light indeed showed large diurnal changes in C:N ratio (Anning et al. 2000, Ross and Geider 2009), consistent with respiratory consumption of organic C reserves over dark periods. Synchronized cultures of the green algae Dunaliella bioculata (Halsey et al. 2013, Halsey and Jones 2015) show diel fluctuations in allocations of photosynthetic production to proteins or polysaccharides, generating detectable changes in C:N through the day in synchrony with progression through the cell cycle. Over our range of photoperiods and low to moderately high growth light intensities, we observed only limited changes in C:N ratio over the diurnal cycle (Fig. S2), although our experimental design only tracked C:N through a single diel cycle, with limited temporal resolution so we lacked signal averaging to detect small or transient changes. Furthermore, we did not systematically establish synchronized cell cycles (Huysman et al. 2014), so cell‐cycle dependent changes in C:N could be dampened in our cultures. The only combination of treatments where we detected a clear diel variation in C:N was the 4:20 L:D, 600 μmol photons · m−2 · s−1 treatment of the smaller T. pseudonana (Fig. S2). Thus, for the diatoms and moderate growth light conditions considered here, diel variation in carbon reserves was not sufficient to cause large diel changes in C:N ratio, and so do not appear to explain the cell size related differences in growth rate responses.
Alternately, cell size dependent changes in growth rate under different photoperiods could result from differential coupling of photosynthetically generated reductant to retained carbon assimilation (Suggett et al. 2009, Halsey et al. 2010, 2011, 2013, Lawrenz et al. 2013). In T. pseudonana and T. punctigera assimilated C:e− generally declined under increasing cumulative photon doses (Fig. 6). In contrast, short photoperiod allowed T. punctigera to convert reductant to retained carbon with remarkable efficiency (Fig. 6) across a range of daily cumulative photon doses. We did not track levels of excreted organic carbon in our experiments, which could vary across conditions or species. Therefore, the high ratio of retained C:e− in T. punctigera under short photoperiods could result from a down‐regulation of excretion of organic carbon under those particular conditions.
Tight coupling of photochemical reductant to retained carbon (Fig. 5B), along with the limited detected variation in C:N (Figs. S1 and S2) showed that the light‐dependent metabolic activity needed for T. punctigera to maintain rapid growth can take place in as little as 4 h, and indeed that longer photoperiods (or shorter dark periods) were inhibitory to growth of T. punctigera. We used a maximum light intensity of 600 μmol photons · m−2 · s−1, but the full ability of large diatoms to utilize short photoperiods may only be observed at yet higher light intensities, e.g., the 1,180 μmol photons · m−2 · s−1 used by (Anning et al. 2000). This capacity for rapid burst exploitation of transient light periods likely relates to the tight metabolic coupling between diatom chloroplasts and mitochondria (Prihoda et al. 2012, Bailleul et al. 2015). On the other hand, the inhibition of growth of T. punctigera under longer photoperiods was surprising to us. Intrinsic susceptibility to photoinactivation of PSII decreases with increasing cell size across centric diatoms (Key et al. 2010), so we initially hypothesized that T. punctigera would show good resilience to prolonged photoperiods, since slower photoinactivation theoretically lowers the metabolic running costs needed to maintain the pool of active PSII (Wu et al. 2011, 2012, Campbell et al. 2013). We aim to pursue this finding in future work by analyzing the actual costs to sustain repair of PSII in smaller versus larger diatoms, and by confirming whether high generation or low detoxification of ROS leads to growth inhibition of T. punctigera under prolonged illumination.
To conclude, we found large differences in the growth and photosynthetic responses of two related diatoms of different cell sizes to a matrix of photoperiods and light intensities. The range of growth responses could be largely reconciled in terms of a saturable response of growth to photochemical reductant generation per diel cycle (Lawrenz et al. 2013). Short photoperiods specifically favor the larger diatom, which achieved a high coupling of photochemical reductant to retained C assimilation under short photoperiods. In addition to length of photoperiod diatoms respond strongly to the pattern of light oscillation (Orefice et al. 2016) with sinuisoidal oscillations generating responses distinct from the square‐wave oscillations we imposed. We therefore sound a note of caution on meta‐analytical extrapolations of photophysiological responses using data from studies applying different photoperiods or oscillation patterns to different taxa (Edwards et al. 2015), since different taxa show differential, even opposing, interactions between photoperiod and the light intensity responses of growth and photosynthesis. Pre‐adapted capacities to exploit differing photoperiods (Brand and Guillard 1981) may prove important factors in the growth and biogeography of diatoms, even between two temperate coastal strains of the same genus.
Jessica Grant‐Burt did cell count determinations for T. punctigera. Miranda Corkum and Dr. Ina Benner assisted with the CN analyses. Amy Woroch and Dr. Amanda Cockshutt provided the quantitations and analyses of RbcL products for Figure S3. This work was supported by a Canada Research Chair (DC) using equipment supported by the Canada Foundation for Innovation, New Brunswick Innovation Foundation and the Natural Sciences and Engineering Research Council of Canada. GL was supported by National Natural Science Foundation of China (41206132) and Natural Science Foundation of Guangdong Province, China (2015A030313826). DT was supported by NSF grant NSF/OCE/153795 and by the Gordon and Betty Moore Foundation through grant GBMF3778 to M.J. Follows. The authors thank Dr. H. MacIntyre for stimulating discussions on these topics, and an anonymous reviewer for extensive and constructive comments.
Author Contributions
G.L. did the culturing and experimental work, assembled the underlying database, generated the draft figures, wrote drafts of the Materials & Methods and Results and contributed to the Introduction and Discussion. D.T. contributed to planning the experiments on the influences of photoperiod on diatom physiology, contributed to discussions of the data interpretation and plotting of the data, wrote a draft of the Introduction and contributed to the Discussion. D.A.C. planned the experiments with G.L., contributed to ongoing discussions of experimental progress and data analyses with G.L. & D.T., assisted with generation of figures, wrote the draft of the Discussion and assembled the submitted version of the manuscript.
Supporting information
Figure S1. Cell volume (μm3) (A, B) and carbon content per cell (pg · cell−1) (C, D) versus growth light (μmol photons · m−2 · s−1) for T. pseudonana (A, C) and T. punctigera (B, D) at L:D cycles of 24:0 (filled cycles), 16:8 (open cycles), 8:16 (open triangles), and 4:20 (filled triangles). Points show averages of data from 2 or 3 independently grown cultures, averaged over five to nine repeated determinations from each culture within a diel cycle; error bars show range of two replicated points or standard deviation of three replicated points, often within symbols.
Figure S2. Diel changes of mole C:N ratios of T. pseudonana (A, C, E, G) and T. punctigera (B, D, F, H) at L:D cycles of 24:0 (A, B), 16:8 (C, D), 8:16 (E, F) and 4:20 (G, H), under growth light of 25 (reversed dark triangles), 75 (gray triangles), 150 (gray squares), 300 (open cycles) or 600 (open diamonds) μmol photons · m−2 · s−1. Points show averages of 2 or 3 determinations on independently grown cultures; error bars show range of 2 replicated points or standard deviation of 3 replicated points, often falling within symbol size.
Figure S3. RbcL products as an index of reactive oxygen species stress correlate with growth inhibition in Thalassiosira punctigera. (A) Representative Immunoblot of RbcL (52 kDa) in total protein extracted from Thalassiosira pseudonana. (B) Representative Immunoblot of RbcL (52 kDa) and RbcL products (26, 45, and 118 kDa) in total protein extracted from T. punctigera. The immunoblots were set to equivalent exposures. The anti‐RbcL antibody used for the immunoblots binds to a single conserved peptide region in the protein, so one RbcL protein offers only one potential antibody binding site. An RbcL product therefore derives from a single RbcL (in the case of 26 or 45 kDa fragments) or from one or more RbcL cross‐linked together or to other proteins (in the case of 118 kDa product). (C) The sum of T punctigera RbcL Products normalized to the RbcL band (52 kDa), averaged from samples from each photoperiod; 4, 8, 16, and 24 h. A one‐way ANOVA with Tukey multiple comparisons of means shows that T punctigera cultures growing under 24 h photoperiod (c) accumulate significantly more RbcL products than do cultures growing under 4, 8 (P = 0.003) (a) or 16 h (P = 0.000) (b) photoperiods. Error bars show one standard deviation of replicated points.
References
- Anning, T. , MacIntyre, H. L. , Pratt, S. M. , Sammes, P. J. , Gibb, S. & Geider, R. J. 2000. Photoacclimation in the marine diatom Skeletonema costatum . Limnol. Oceanogr. 45:1807–17. [Google Scholar]
- Bailleul, B. , Berne, N. , Murik, O. , Petroutsos, D. , Prihoda, J. , Tanaka, A. , Villanova, V. et al. 2015. Energetic coupling between plastids and mitochondria drives CO2 assimilation in diatoms. Nature 524:366–9. [DOI] [PubMed] [Google Scholar]
- Beardall, J. , Allen, D. , Bragg, J. , Finkel, Z. V. , Flynn, K. J. , Quigg, A. , Alwyn, T. et al. 2009. Allometry and stoichiometry of unicellular, colonial and multicellular phytoplankton. New Phytol. 181:295–309. [DOI] [PubMed] [Google Scholar]
- Berlett, B. S. & Stadtman, E. R. 1997. Protein oxidation in aging, disease, and oxidative stress. J. Biol. Chem. 272:20313–6. [DOI] [PubMed] [Google Scholar]
- Brand, L. E. & Guillard, R. R. L. 1981. The effects of continuous light and light intensity on the reproduction rates of twenty‐two species of marine phytoplankton. J. Exp. Mar. Biol. Ecol. 50:119–32. [Google Scholar]
- Brown, C. , MacKinnon, J. , Cockshutt, A. , Villareal, T. & Campbell, D. 2008. Flux capacities and acclimation costs in Trichodesmium from the Gulf of Mexico. Mar. Biol. 154:413–22. [Google Scholar]
- Campbell, D. A. , Hossain, Z. , Cockshutt, A. M. , Zhaxybayeva, O. , Wu, H. & Li, G. 2013. Photosystem II protein clearance and FtsH function in the diatom Thalassiosira pseudonana . Photosynth. Res. 115:43–54. [DOI] [PubMed] [Google Scholar]
- Chisholm, S. W. & Costello, J. C. 1980. Influence of environmental factors and population composition on the timing of cell division in Thalassiosira fluviatilis (bacillariophyceae) grown on light/dark cycles. J. Phycol. 16:375–83. [Google Scholar]
- Edwards, K. F. , Thomas, M. K. , Klausmeier, C. A. & Litchman, E. 2015. Light and growth in marine phytoplankton: allometric, taxonomic, and environmental variation. Limnol. Oceanogr. 60:540–52. [Google Scholar]
- Eilers, P. H. C. & Peeters, J. C. H. 1988. A model for the relationship between light intensity and the rate of photosynthesis in phytoplankton. Ecol. Model. 42:199–215. [Google Scholar]
- Falkowski, P. G. , Dubinsky, Z. & Wyman, K. 1985. Growth‐irradiance relationships in phytoplankton. Limnol. Oceanogr. 30:311–21. [Google Scholar]
- Falkowski, P. G. & Raven, J. A. 2007. Aquatic Photosynthesis, 2nd edn Princeton University Press, Princeton, NJ, USA. [Google Scholar]
- Finkel, Z. V. 2001. Light absorption and size scaling of light‐limited metabolism in marine diatoms. Limnol. Oceanogr. 46:86–94. [Google Scholar]
- Finkel, Z. V. , Irwin, A. J. & Schofield, O. 2004. Resource limitation alters the 3/4 size scaling of metabolic rates in phytoplankton. Mar. Ecol. Prog. Ser. 273:269–79. [Google Scholar]
- Geider, R. J. , MacIntyre, H. J. & Kana, T. M. 1998. A dynamic regulatory model of phytoplankton acclimation to light, nutrients and temperature. Limnol. Oceanogr. 43:679–94. [Google Scholar]
- Geider, R. J. & Osborne, B. A. 1989. Respiration and microalgal growth: a review of the quantitative relationship between dark respiration and growth. New Phytol. 112:327–41. [Google Scholar]
- Gerhardt, K. E. , Wilson, M. I. & Greenberg, B. M. 1999. Tryptophan photolysis leads to a UVB‐induced 66 kDa photoproduct of ribulose‐1,5 bisphosphate carboxylase/oxygenase (RUBISCO) in vitro and in vivo. Photochem. Photobiol. 70:49–56. [Google Scholar]
- Grouneva, I. , Muth‐Pawlak, D. , Battchikova, N. & Aro, E.‐M. 2016. Changes in relative thylakoid protein abundance induced by fluctuating light in the diatom Thalassiosira pseudonana . J. Proteome Res. 15:1649–58. [DOI] [PubMed] [Google Scholar]
- Guillard, R. R. L. & Ryther, J. H. 1962. Studies of marine planktonic diatoms: I. Cyclotella nana Hustedt and Detonula confervacea (Cleve) Gran. Canadian Journal of Microbiology 8:229–39. [DOI] [PubMed] [Google Scholar]
- Halsey, K. H. & Jones, B. M. 2015. Phytoplankton strategies for photosynthetic energy allocation. Annu. Rev. Mar. Sci. 7:265–97. [DOI] [PubMed] [Google Scholar]
- Halsey, K. H. , Milligan, A. J. & Behrenfeld, M. J. 2010. Physiological optimization underlies growth rate‐independent chlorophyll‐specific gross and net primary production. Photosynth. Res. 103:125–37. [DOI] [PubMed] [Google Scholar]
- Halsey, K. H. , Milligan, A. J. & Behrenfeld, M. J. 2011. Linking time‐dependent carbon‐fixation efficiencies in Dunaliella tertiolecta (Chlorophyceae) to underlying metabolic pathways. J. Phycol. 47:66–76. [DOI] [PubMed] [Google Scholar]
- Halsey, K. H. , O'Malley, R. T. , Graff, J. R. , Milligan, A. J. & Behrenfeld, M. J. 2013. A common partitioning strategy for photosynthetic products in evolutionarily distinct phytoplankton species. New Phytol. 198:1030–8. [DOI] [PubMed] [Google Scholar]
- Huisman, J. , Jonker, R. R. , Zonneveld, C. & Weissing, F. J. 1999a. Competition for light between phytoplankton species: experimental tests of mechanistic theory. Ecology 80:211–22. [Google Scholar]
- Huisman, J. , Oostveen, P. V. & Weissing, F. J. 1999b. Species dynamics in phytoplankton blooms: incomplete mixing and competition for light. Am. Nat. 154:46–68. [DOI] [PubMed] [Google Scholar]
- Huot, Y. & Babin, M. 2010. Overview of fluorescence protocols: theory, basic concepts, and practice In Suggett D. J., Prášil O. & Borowitzka M. A. [Eds.] Chlorophyll a Fluorescence in Aquatic Sciences: Methods and Applications. Springer, Dordrecht, the Netherlands, pp. 31–74. [Google Scholar]
- Huysman, M. J. J. , Vyverman, W. & De Veylder, L. 2014. Molecular regulation of the diatom cell cycle. J. Exp. Bot. 65:2573–84. [DOI] [PubMed] [Google Scholar]
- Jeffrey, S. & Humphrey, G. 1975. New spectrophotometric equations for determining chlorophylls a1, b1, c1 and c2 in higher plants, algae and natural phytoplankton. Biochem. Physiol. Pflanz. 167:191–4. [Google Scholar]
- Key, T. , McCarthy, A. , Campbell, D. A. , Six, C. , Roy, S. & Finkel, Z. V. 2010. Cell size trade‐offs govern light exploitation strategies in marine phytoplankton. Environ. Microbiol. 12:95–104. [DOI] [PubMed] [Google Scholar]
- Kolber, Z. S. , Prá___, O. & Falkowski, P. G. 1998. Measurements of variable chlorophyll fluorescence using fast repetition rate techniques: defining methodology and experimental protocols. Biochimica et Biophysica Acta (BBA) ‐ Bioenergetics. 1367:88–106. [DOI] [PubMed] [Google Scholar]
- Kolber, Z. S. , Prášil, O. & Falkowski, P. G. 2010. Cell size trade‐offs govern light exploitation strategies in marine phytoplankton. Environ. Microbiol. 12:95–104. [DOI] [PubMed] [Google Scholar]
- Kooijman, S. A. L. M. 1986. Energy budgets can explain body size relations. J. Theor. Biol. 121:269–82. [Google Scholar]
- Larios, J. M. , Budhiraja, R. , Fanburg, B. L. & Thannickal, V. J. 2001. Oxidative protein cross‐linking reactions involving‐tyrosine in transforming growth factor‐β1‐stimulated fibroblasts. J. Biol. Chem. 276:17437–41. [DOI] [PubMed] [Google Scholar]
- Lavaud, J. 2007. Fast regulation of photosynthesis in diatoms: mechanisms, evolution and ecophysiology. Functional Plant Science and Biotechnology 1:267–87. [Google Scholar]
- Lavaud, J. & Lepetit, B. 2013. An explanation for the inter‐species variability of the photoprotective non‐photochemical chlorophyll fluorescence quenching in diatoms. Biochim. Biophys. Acta Bioenerg. 1827:294–302. [DOI] [PubMed] [Google Scholar]
- Lawrenz, E. , Silsbe, G. , Capuzzo, E. , Ylöstalo, P. , Forster, R. M. , Simis, S. G. H. , Prášil, O. et al. 2013. Predicting the electron requirement for carbon fixation in seas and oceans. PLoS ONE 8:e58137. [DOI] [PMC free article] [PubMed] [Google Scholar]
- Laws, E. A. & Bannister, T. T. 1980. Nutrient‐ and light‐limited growth of Thalassiosira fluviatilis in continuous culture, with implications for phytoplankton growth in the ocean. Limnol. Oceanogr. 25:457–73. [Google Scholar]
- Li, G. , Brown, C. M. , Jeans, J. , Donaher, N. , McCarthy, A. & Campbell, D. A. 2015. The nitrogen costs of photosynthesis in a diatom under current and future pCO2 . New Phytol. 205:533–43. [DOI] [PubMed] [Google Scholar]
- Litchman, E. 2000. Growth rates of phytoplankton under fluctuating light. Freshw. Biol. 44:223–35. [Google Scholar]
- Litchman, E. 2003. Competition and coexistence of phytoplankton under fluctuating light: experiments with two cyanobacteria. Aquat. Microb. Ecol. 31:241–8. [Google Scholar]
- Litchman, E. & Klausmeier, C. A. 2001. Competition of phytoplankton under fluctuating light. Am. Nat. 157:170–87. [DOI] [PubMed] [Google Scholar]
- Litchman, E. , Klausmeier, C. A. & Bossard, P. 2004. Phytoplankton nutrient competition under dynamic light regimes. Limnol. Oceanogr. 49:1457–62. [Google Scholar]
- Litchman, E. , Klausmeier, C. A. & Yoshiyama, K. 2009. Contrasting size evolution in marine and freshwater diatoms. Proc. Natl. Acad. Sci. USA 106:2665–70. [DOI] [PMC free article] [PubMed] [Google Scholar]
- Loebl, M. , Cockshutt, A. M. , Campbell, D. A. & Finkel, Z. V. 2010. Physiological basis for high resistance to photoinhibition under nitrogen depletion in Emiliania huxleyi . Limnol. Oceanogr. 55:2150–60. [Google Scholar]
- Macedo, M. , Ferreira, J. & Duarte, P. 1998. Dynamic behaviour of photosynthesis‐irradiance curves determined from oxygen production during variable incubation periods. Mar. Ecol. Prog. Ser. 165:31–43. [Google Scholar]
- MacIntyre, H. L. & Cullen, J. J. 2005. Using cultures to investigate the physiological ecology of microalgae In Andersen R. A. [Ed.] Algal Culture Techniques. Academic Press, New York, pp. 287–326. [Google Scholar]
- MacIntyre, H. L. , Kana, T. M. & Geider, R. J. 2000. The effect of water motion on short‐term rates of photosynthesis by marine phytoplankton. Trends Plant Sci. 5:12–7. [DOI] [PubMed] [Google Scholar]
- Mackenzie, T. & Campbell, D. 2005. Cyanobacterial acclimation to rapidly fluctuating light is constrained by inorganic carbon status. J. Phycol. 41:801–11. [Google Scholar]
- Marañón, E. , Cermeño, P. , López‐Sandoval, D. C. , Rodríguez‐Ramos, T. , Sobrino, C. , Huete‐Ortega, M. , Blanco, J. M. et al. 2013. Unimodal size scaling of phytoplankton growth and the size dependence of nutrient uptake and use. Ecol. Lett. 16:371–9. [DOI] [PubMed] [Google Scholar]
- Marañón, E. , Cermeno, P. , Rodriquez, J. , Zubkov, M. V. & Harris, R. P. 2007. Scaling of phytoplankton photosynthesis and cell size in the ocean. Limnol. Oceanogr. 52:2190–8. [Google Scholar]
- McMahon, T. A. & Bonner, J. T. 1983. On size and life. New York, Scientific American Library xiii, 255 p.
- Nakano, R. , Ishida, H. , Kobayashi, M. , Makino, A. & Mae, T. 2010. Biochemical changes associated with in vivo RbcL fragmentation by reactive oxygen species under chilling‐light conditions. Plant Biol. 12:35–45. [DOI] [PubMed] [Google Scholar]
- Nielsen, M. V. 1997. Growth, dark respiration and photosynthetic parameters of the coccolithophorid Emiliania huxleyi (Prymnesiophyceae) acclimated to different day length‐irradiance combinations. J. Phycol. 33:818–22. [Google Scholar]
- Orefice, I. , Chandrasekaran, R. , Smerilli, A. , Corato, F. , Caruso, T. , Casillo, A. , Corsaro, M. M. et al. 2016. Light‐induced changes in the photosynthetic physiology and biochemistry in the diatom Skeletonema marinoi . Algal Res. 17:1–13. [Google Scholar]
- Oxborough, K. & Baker, N. R. 1997. Resolving chlorophyll a fluorescence images of photosynthetic efficiency into photochemical and non‐photochemical components – calculation of qP and Fv’/Fm’; without measuring Fo’. Photosynth. Res. 54:135–42. [Google Scholar]
- Oxborough, K. , Moore, C. M. , Suggett, D. J. , Lawson, T. , Chan, H. G. & Geider, R. J. 2012. Direct estimation of functional PSII reaction center concentration and PSII electron flux on a volume basis: a new approach to the analysis of Fast Repetition Rate fluorometry (FRRf) data. Limnol. Oceanogr. Methods 10:142–54. [Google Scholar]
- Pahlow, M. 2005. Linking chlorophyll – nutrient dynamics to the Redfield N:C ratio with a model of optimal phytoplankton growth. Mar. Ecol. Prog. Ser. 287:33–43. [Google Scholar]
- Peeters, J. C. H. & Eilers, P. 1978. The relationship between light intensity and photosynthesis—A simple mathematical model. Hydrobiol. Bull. 12:134–6. [Google Scholar]
- Peters, R. H. 1983. The Ecological Implications of Body Size. Cambridge University Press, Cambridge, UK. [Google Scholar]
- Platt, T. & Jassby, A. 1976. The relationship between photosynthesis and light for natural assemblages of coastal marine phytoplankton. J. Phycol. 12:421–30. [Google Scholar]
- Prézelin, B. B. 1992. Diel periodicity in phytoplankton productivity In Berman T., Gons H. J. & Mur L. R. [Eds.] The Daily Growth Cycle of Phytoplankton. Springer, Dordrecht, the Netherlands, pp. 1–35. [Google Scholar]
- Prihoda, J. , Tanaka, A. , de Paula, W. B. M. , Allen, J. F. , Tirichine, L. & Bowler, C. 2012. Chloroplast‐mitochondria cross‐talk in diatoms. J. Exp. Bot. 63:1543–57. [DOI] [PubMed] [Google Scholar]
- Ross, O. N. & Geider, R. J. 2009. New cell‐based model of photosynthesis and photo‐acclimation: accumulation and mobilisation of energy reserves in phytoplankton. Mar. Ecol. Prog. Ser. 383:53–71. [Google Scholar]
- Sakshaug, E. , Andresen, K. & Kiefer, D. A. 1989. A steady state description of growth and light absorption in the marine planktonic diatom Skeletonema costatum . Limnol. Oceanogr. 34:198–205. [Google Scholar]
- Shuter, B. 1979. A model of physiological adaptation in unicellular algae. J. Theor. Biol. 78:519–52. [DOI] [PubMed] [Google Scholar]
- Silsbe, G. M. , Oxborough, K. , Suggett, D. J. , Forster, R. M. , Ihnken, S. , Komárek, O. , Lawrenz, E. et al. 2015. Toward autonomous measurements of photosynthetic electron transport rates: an evaluation of active fluorescence‐based measurements of photochemistry. Limnol. Oceanogr. Methods 13:138–55. [Google Scholar]
- Suggett, D. , MacIntyre, H. , Kana, T. & Geider, R. 2009. Comparing electron transport with gas exchange: parameterising exchange rates between alternative photosynthetic currencies for eukaryotic phytoplankton. Aquat. Microb. Ecol. 56:147–62. [Google Scholar]
- Talmy, D. , Blackford, J. , Hardman‐Mountford, N. J. , Polimene, L. , Follows, M. J. & Geider, R. J. 2014. Flexible C:N ratio enhances metabolism of large phytoplankton when resource supply is intermittent. Biogeosciences 11:4881–95. [Google Scholar]
- Tang, E. & Vincent, W. 2000. Effects of daylength and temperature on the growth and photosynthesis of an Arctic cyanobacterium, Schizothrix calcicola (Oscillatoriaceae). Eur. J. Phycol. 35:263–72. [Google Scholar]
- Tilzer, M. M. & Dubinsky, Z. 1987. Effects of temperature and day length on the mass balance of Antarctic phytoplankton. Polar Biol. 7:35–42. [Google Scholar]
- Wagner, A. H. , Jakob, T. , Wilhelm, C. & Wagner, H. 2005. Balancing the energy captured under fluctuating light conditions. New Biotechnol. 169:95–108. [DOI] [PubMed] [Google Scholar]
- Walter, B. , Peters, J. , van Beusekom, J. E. E. & St. John, M. A. 2015. Interactive effects of temperature and light during deep convection: a case study on growth and condition of the diatom Thalassiosira weissflogii . ICES J. Mar. Sci. J. Cons. 72:2061–71. [Google Scholar]
- Ware, M. A. , Belgio, E. & Ruban, A. V. 2015. Photoprotective capacity of non‐photochemical quenching in plants acclimated to different light intensities. Photosynth. Res. 126:261–74. [DOI] [PubMed] [Google Scholar]
- Waring, J. , Klenell, M. , Bechtold, U. , Underwood, G. J. C. & Baker, N. R. 2010. Light‐induced responses of oxygen photoreduction, reactive oxygen species production and scavenging in two diatom species. J. Phycol. 46:1206–17. [Google Scholar]
- West, G. B. , Brown, J. H. & Enquist, B. J. 1997. A general model for the origin of allometric scaling laws in biology. Science 276:122–6. [DOI] [PubMed] [Google Scholar]
- Wilson, M. I. , Ghosh, S. , Gerhardt, K. E. , Holland, N. , Babu, T. S. , Edelman, M. , Dumbroff, E. B. et al. 1995. In vivo photomodification of ribulose‐1,5‐bisphosphate carboxylase/oxygenase holoenzyme by ultraviolet‐B radiation (formation of a 66‐kilodalton variant of the large subunit). Plant Physiol. 109:221–9. [DOI] [PMC free article] [PubMed] [Google Scholar]
- Wu, Y. , Campbell, D. A. , Irwin, A. J. , Suggett, D. J. & Finkel, Z. V. 2014a. Ocean acidification enhances the growth rate of larger diatoms. Limnol. Oceanogr. 59:1027–34. [Google Scholar]
- Wu, H. , Cockshutt, A. M. , McCarthy, A. & Campbell, D. A. 2011. Distinctive photosystem II photoinactivation and protein dynamics in marine diatoms. Plant Physiol. 156:2184–95. [DOI] [PMC free article] [PubMed] [Google Scholar]
- Wu, Y. , Jeans, J. , Suggett, D. J. , Finkel, Z. V. & Campbell, D. A. 2014b. Large centric diatoms allocate more cellular nitrogen to photosynthesis to counter slower RUBISCO turnover rates. Front. Mar. Sci. doi: 10.3389/fmars.2014.00068. [Google Scholar]
- Wu, H. , Roy, S. , Alami, M. , Green, B. R. & Campbell, D. A. 2012. Photosystem II photoinactivation, repair, and protection in marine centric diatoms. Plant Physiol. 160:464–76. [DOI] [PMC free article] [PubMed] [Google Scholar]
- Yamamoto, Y. 2001. Quality control of photosystem II. Plant Cell Physiol. 42:121–8. [DOI] [PubMed] [Google Scholar]
Associated Data
This section collects any data citations, data availability statements, or supplementary materials included in this article.
Supplementary Materials
Figure S1. Cell volume (μm3) (A, B) and carbon content per cell (pg · cell−1) (C, D) versus growth light (μmol photons · m−2 · s−1) for T. pseudonana (A, C) and T. punctigera (B, D) at L:D cycles of 24:0 (filled cycles), 16:8 (open cycles), 8:16 (open triangles), and 4:20 (filled triangles). Points show averages of data from 2 or 3 independently grown cultures, averaged over five to nine repeated determinations from each culture within a diel cycle; error bars show range of two replicated points or standard deviation of three replicated points, often within symbols.
Figure S2. Diel changes of mole C:N ratios of T. pseudonana (A, C, E, G) and T. punctigera (B, D, F, H) at L:D cycles of 24:0 (A, B), 16:8 (C, D), 8:16 (E, F) and 4:20 (G, H), under growth light of 25 (reversed dark triangles), 75 (gray triangles), 150 (gray squares), 300 (open cycles) or 600 (open diamonds) μmol photons · m−2 · s−1. Points show averages of 2 or 3 determinations on independently grown cultures; error bars show range of 2 replicated points or standard deviation of 3 replicated points, often falling within symbol size.
Figure S3. RbcL products as an index of reactive oxygen species stress correlate with growth inhibition in Thalassiosira punctigera. (A) Representative Immunoblot of RbcL (52 kDa) in total protein extracted from Thalassiosira pseudonana. (B) Representative Immunoblot of RbcL (52 kDa) and RbcL products (26, 45, and 118 kDa) in total protein extracted from T. punctigera. The immunoblots were set to equivalent exposures. The anti‐RbcL antibody used for the immunoblots binds to a single conserved peptide region in the protein, so one RbcL protein offers only one potential antibody binding site. An RbcL product therefore derives from a single RbcL (in the case of 26 or 45 kDa fragments) or from one or more RbcL cross‐linked together or to other proteins (in the case of 118 kDa product). (C) The sum of T punctigera RbcL Products normalized to the RbcL band (52 kDa), averaged from samples from each photoperiod; 4, 8, 16, and 24 h. A one‐way ANOVA with Tukey multiple comparisons of means shows that T punctigera cultures growing under 24 h photoperiod (c) accumulate significantly more RbcL products than do cultures growing under 4, 8 (P = 0.003) (a) or 16 h (P = 0.000) (b) photoperiods. Error bars show one standard deviation of replicated points.