Abstract
Background
In the US, African Americans have a high death rate from triple-negative breast cancer (TNBC), characterized by lack of hormone receptors (ER, PR, HER2/ERRB2) which are otherwise valuable targets of chemotherapy. There is a need to identify novel targets that negatively impact TNBC tumorigenesis. TNBCs release an abundance of lactic acid, under normoxic, hypoxic and hyperoxic conditions; this referred to as the Warburg effect. Accumulated lactic acid sustains peri-cellular acidity which propels metastatic invasion and malignant aggressive transformation. The source of lactic acid is believed to be via conversion of pyruvate by lactate dehydrogenase (LDH) in the last step of glycolysis, with most studies focusing on the LDHA isoform.
Materials and Methods
In this study, LDHA was silenced using long-term MISSION® shRNA lentivirus in human breast cancer MDA-MB-231 cells. Downregulation of LDHA transcription and protein expression was confirmed by Western Blot, immunocytochemistry and qPCR. A number of parameters were measured in fully viable vector controls versus knockdown (KD) clones, including levels of lactic acid produced, glucose consumed, ATP and basic metabolic rates.
Results
The data show lentivirus V-165 generated a knock-down clone most effective in reducing both gene and protein levels to less than 1% of vector controls. Stable KD showed absolutely no changes in cell viability, lactic acid production, ATP, glucose consumption or basic metabolic rate. Given the complete absence of impact on any observed parameter by LDH-A KD and this being somewhat contrary to findings in the literature, further analysis was required to determine why. Whole-transcriptome analytic profile on MDA-MB-231 for LDH subtypes using Agilent Human Genome 4×44k microarrays, where the data show the following component breakdown.
Transcripts
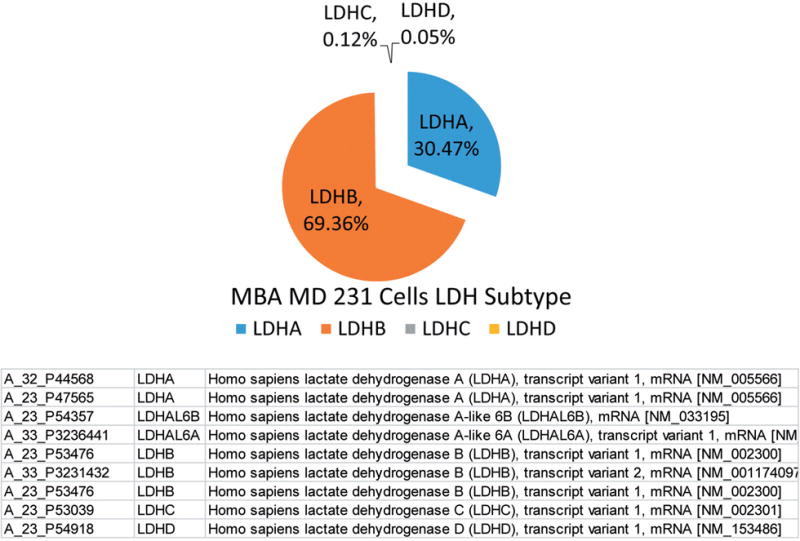
30.47 % LDHA, 69.36% LDHB, 0.12% LDHC and 0.05% LDHD.
Conclusion
These findings underscore the importance of alternative isoforms of LDH in cancer cells to produce lactic acid, when LDHA is silenced or inhibited. LDHA silencing alone is not effective in hampering or inducing changes in survival, metabolism or lactic acid produced in a cell line with high concentrations of LDHB. Future research will be required to confirm effects of dual LDHA/B knockdown and further confirm that the sole source of lactic acid produced occurs through LDH (all isoforms) in breast cancer cells.
In the U.S., African Americans experience high death rates from triple-negative breast cancer (TNBC) breast cancer, in part due to limited treatment options excluding hormone based chemotherapy. Metastatic aggression of TNBC is associated with overexpression of lactic acid dehydrogenase (LDH), production of lactate and a subsequent acidic pH which circumscribes tumors in the absence or presence of oxygen (Warburg effect). TNBC cells convert pyruvate to lactic acid via LDHA (Figure 1), the extent of which is associated with metastatic invasiveness, Ki-67 proliferation marker and poor clinical outcome (1, 2). Elevated glycolytic production of lactate is observed in diverse cancers where greater LDHA expression correlates to poor survival rates, greater tumor size, advanced clinical stage, Gleason scores, histological grade and relapse (3, 4).
Figure 1. Conversion of pyruvate to lactic acid.

Experimental knockdown of LDHA in diverse malignant cell types has been reported to reduce glycolytic activity (5, 6), attenuate extruded lactate and ATP, tantamount to hampered cell proliferation, migration, invasion (7–10) and radio sensitization (11). Further, a number of studies are showing LDHA mRNA as being degraded by miRNAs: miR34a, miR-34c, miR-369-3p, miR-374a, and miR-4524a/b where overexpression of some of these can prevent resistance to radiation (8, 12) and chemotherapeutic drugs (13, 14). These findings are evident in both animal and cell culture models where lower protein or enzyme function of LDHA inhibits tumorigenesis (15), conversely overexpression corresponding to rapid tumor growth (16).
Previously, we conducted a high through put screening of natural products to identify human LDHA inhibitors, of which Chinese gallnut was a lead herb (17). Further analysis showed that 1,2,3,4,6-Penta-O-galloylglucose was the compound in Chinese gallnut with capacity to inhibit LDHA in the nM range (18). The latter study confirmed that LDHA inhibitors seem to slow the growth or cell division of TNBC cells, but we did not find concrete evidence to show that production of lactate was hampered, nor did we find evidence of toxicity. For this reason, here we evaluate for the consequences of stable LDHA knockdown in MDA- MB- 231 cells on various metabolic parameters including lactate production. The findings in this and the previous studies clarify an important element, in that multiple isoforms such as LDHA/B are likely compensatory elements to maintain production of lactic acid through glycolysis in tumor cells.
Materials and Methods
Materials used such as Hanks Balanced Salt Solution, 4-(2-hydroxyethyl)-1-piperazineethanesulfonic acid (HEPES), ethanol, 96-well plates, silencing reagents, ATP quantification kits, general reagents and supplies purchased from Sigma Aldrich (St. Louis, MO, USA) and VWR International (Suwanee, GA, USA). Antibodies and immunological assay reagents were purchased from Abcam (Cambridge, MA, USA). Qiagen miRNeasy Micro Kits (Germantown, MD, USA) and RT-PCR supplies were purchased from Bio-Rad Laboratories (Hercules, CA, USA).
Cell culture
MDA-MB-231 cells were purchased from American Type Culture Collection (Manassas, VA). Cells were brought up according to the manufacturers instruction, then sub-cultured in DMEM high glucose media [glucose 4,500 mg/L] containing 5% FBS, 4 mM L-glutamine, and penicillin/streptomycin (100 U/0.1 mg/ml). Culture conditions: maintained at 37°C in 5% CO2/atmosphere. For experiments, plating media consisted of DMEM [glucose 4500mg/L], 2.5% FBS and penicillin/streptomycin (100 U/0.1 mg/ml).
Lentiviral transduction
The MISSION lentiviral based shRNA vector collections from Sigma Aldrich (St. Louis, MO, USA) were used for long-term silencing. Briefly, 1.6×10⁴ cells were cultured in 96-well plates, incubated for 18–20 hours. Media was removed, hexadimethrine bromide (8 μg/ml) was added, followed by various volumes of lentiviral particles. (V-165) [TRCN0000165175] and (V-591) [TRCN0000159591] were effective KD clones. After incubation for 18–20 hours at 37°, puromycin was added and resistant colony selected and grown.
Cell viability
Cell Viability was quantified using resazurin [7-Hydroxy-3H-phenoxazin-3-one 10-oxide] (Alamar Blue) indicator dye (19). A working solution of resazurin was prepared in sterile HBSS -phenol red (0.5 mg/ml) and added (15% v/v) to each sample. Samples were returned to the incubator for 2–4 hr, and reduction of the dye by viable cells (to resorufin, a fluorescent compound) was quantitatively analyzed using a Synergy HTX multi-mode reader (Bio-Tek, Winooski, VT) with settings at [550/580], [excitation/emission].
qPCR
Qiagen miRNeasy Micro Kit (Germantown, MD, USA) was utilized for the isolation and cleanup of RNA, which was converted to cDNA using the script cDNA synthesis kit from Bio-Rad Laboratories (Hercules, CA,USA). Amplification was generated with advanced universal SYBR Green Supermix and Bio-Rad primers for LDHA and β-Actin. The Bio-Rad CFX96 touch PCR detection system was utilized for cDNA synthesis, amplification and data analysis.
Somatic ATP
ATP was determined using the Adenosine 5′-triphosphate (ATP) bioluminescent somatic cell assay kit (Catalog Number FLASC) Sigma Aldrich (St. Louis, MO, USA) according the manufacturer’s instructions. Briefly, cells were lysed with ATP releasing reagent, transferred to a flat white bottom 96 well plate and quantified on a Synergy HTX multi-mode reader (Bio-Tek, Winooski, VT) using luminescence settings.
Western blotting
LDHA protein expression was determined by Western Blot. Briefly, cell samples were washed in ice cold sterile PBS at 4°C., centrifuged and the supernatant discarded. The pellet was re-suspended and homogenized/sonicated in a lysis buffer containing protease inhibitors. The supernatant was assessed for protein concentration and added to 1:1 of Laemmli sample buffer (Bio-Rad #161-0737) + fresh β-ME and boiled for 5 min. The proteins were run, transferred to polyvinylidene fluoride membranes (100V for 60 min), placed in a blocking buffer consisting of 5% milk w/v in Tween/BS buffer (TTBS), pH 7.4 and incubated with 1° antibody [polyclonal anti-LDHA produced in rabbit (1:500), Monoclonal Anti-β-Actin antibody (1:2,000). The membranes were washed in TTBS and incubated in 2° anti-mouse/or rabbit IgG (Fc specific) peroxidase conjugate (1:4,000) in 2% non-fat dried milk in TTBS for 1 h at room temperature. Detection was obtained by ECL substrate, using a Versadoc Imaging Platform.
Whole-genomic profiling
Whole genome expression profiling was carried out using Agilent Human Genome 4×44k Microarrays on total RNA samples. In brief, RNA was isolated from each sample. The quantity of each of the total RNA samples was determined by spectrophotometry and the size distribution were assessed using an Agilent Bioanalyzer. For profiling two hundred ng of total RNA was converted into labeled cRNA with nucleotides coupled to fluorescent dye Cy3 using the Low Input Quick Amp Kit (Agilent Technologies, Palo Alto, CA, USA). Cy3-labeled cRNA (1.65 mg) from each sample was hybridized to an Agilent Genome 4×44k Microarray. The hybridized array was scanned and data was extracted from the scanned image using Feature Extraction version 10.7 (Agilent Technologies).
Lactic acid colorimetric assay
Lactate was determined using a colorimetric enzymatic assay, procedure 675 Sigma Assay (Lactate reagent). The reagent was added to the samples and incubated for 8 min at 37 degrees. Lactate was quantified at 490 nm on the uQuant microplate reader (Bio-tek instruments, Inc). Experimental media for this assay was DMEM high glucose media [glucose 4500mg/L] containing 1% FBS, 4 mM L-glutamine, and penicillin/streptomycin (100 U/0.1 mg/ml) (minus phenol red).
Lactic acid HPLC
Determination of lactate was also acquired using a Shimadzu HPLC system equipped with an SPD-20A UV detector (set at 210 nm), and a workstation containing EZSTART version 7.4 software and an SS420X instrument interface docked to a Waters autosampler Model 717 Plus (Shimadzu Scientific Instruments, Columbia, MD, USA; Waters, Milford, MA, USA). The flow rate was isocratic, being controlled by a Waters Model 510 pump at 0.6 mL/min. The mobile phase contained 5 mM sulfuric acid and the column used was an Aminex HPX-87H 300×7.8 mm with 9 μm particle size (Bio-Rad, Hercules, CA, USA). The run time was 16 min and injection volume was 25 μl. Samples were prepared by placing 35 μL cell supernatant into 200 μL of 5 mM sulfuric acid, immediately stored at −80°C. Prior to analysis, samples were thawed and 125 μL was added to 275 μL of 5 mM sulfuric acid.
Glucose consumption
Briefly, glucose was quantified as previously described, (20) using an enzymatic assay using glucose oxidase (20U/mL) and a chromogenic solution, then quantified at 490 nm on the Synergy/HTX multi-mode reader (Bio-tek Instruments, Inc). Experimental media for this assay was DMEM high glucose media [glucose 4500 mg/L] containing 5% FBS, 4 mM L-glutamine, and penicillin/streptomycin (100 U/0.1 mg/ml) (minus phenol red).
Imaging
Alexa Fluor® 488 phalloidin and Hoechst® 33342 nucleic acid stain were used to demarcate the cell nucleus and cytoskeleton F-actin, where protein expression of LDHA and β-actin was determined using immunocytochemistry. Briefly, cells were fixed in 4% paraformaldehyde/permeabilized in 0.2% Triton X 100 in phosphate buffered saline (PBS) and incubated anti-human anti-LDHA or β-actin antibodies, produced in rabbit for 24 h at 4°C in a casein blocking buffer. Samples were washed in PBS, then incubated with anti-rabbit Alexa Fluor® 488 or 555 conjugate for 2 h at RT. Samples were imaged using a fluorescent/inverted microscope, CCD camera and data acquisition using ToupTek View; ToupTek Photonics Co (Zhejiang, P.R.China).
Data analysis
Statistical analysis was performed using Graph Pad Prism (version 3.0; Graph Pad Software Inc. San Diego, CA, USA) with significance of difference between the groups assessed using a Student’s t-test. (OriginLab, Northampton, MA, USA).
Results
Silencing of LDHA involved establishing a preliminary puromycin kill curve with growth/sub culturing of KD and vector control colonies. It was determined that V-165 was the most effective lentiviral particle to induce a stable silencing of LDHA. Figure 2A (V-165), 2B (V-591) shows attenuated protein expression by immunocytochemistry using rabbit-anti human LDHA, then goat anti-rabbit Alexa Fluor® 555 (Right) with morphological F-actin imaging using phalloidin Alex Fluor® 488, then nuclear counterstained with Hoechst dye (Left). These findings confirm a reduction in LDHA protein which is further validated by Western blot using β-actin as a loading control (Figure 3). RT-PCR was then used to confirm transcript knockdown (Figure 4A), which was normalized to β-actin as the housekeeping gene, where protein levels are displayed in Figure 4B. Lactic acid released by vector controls and KD clones (V-165 and V-591) was unaffected (Figure 5A) despite the significant reduction in the LDHA protein. In order to validate these effects, dual detection methods involved cross-confirmation of the lactate colorimetric assay validated by HPLC (Figure 5B). The data show absolutely no change in the production of lactic acid (despite the large drop in LDHA) of the most effective clone V-165. Next, we evaluate multiple parameters on vector controls vs. KDs (Figure 6). All data was normalized to Vector control 1, and there was no change in lactic acid produced, glucose consumed, ATP produced or viable cell count. These findings were not expected, and warrant further explanation. A whole-transcriptome analysis was run on MDA-MB-231 cells to establish the transcript presence for all isoforms of LDH (Figure 7). These findings show a dominant presence of both LDHA and B. The high concentration of LDHB is likely the reason why silencing LDHA was insufficient in espousing changes in metabolism of glucose, production of lactic acid or somatic ATP.
Figure 2. A. Stable knockdown of LDHA in puromycin resistant MDA-MB-231 cells by lentiviral particles V-165. The images show F-actin/nuclear counterstained with Hoechst dye (Left) and LDHA protein expression by immunocytochemistry in fixed permeabilized cells (Right). Top (Control) Bottom (KD). B. Stable knockdown of LDHA in puromycin resistant MDA-MB-231 cells by lentiviral particles V-591. The images show F-actin/nuclear counterstain with Hoechst dye (Left) and LDHA protein expression by immunocytochemistry in fixed permeabilized cells (Right). Top (Control) Bottom (KD).
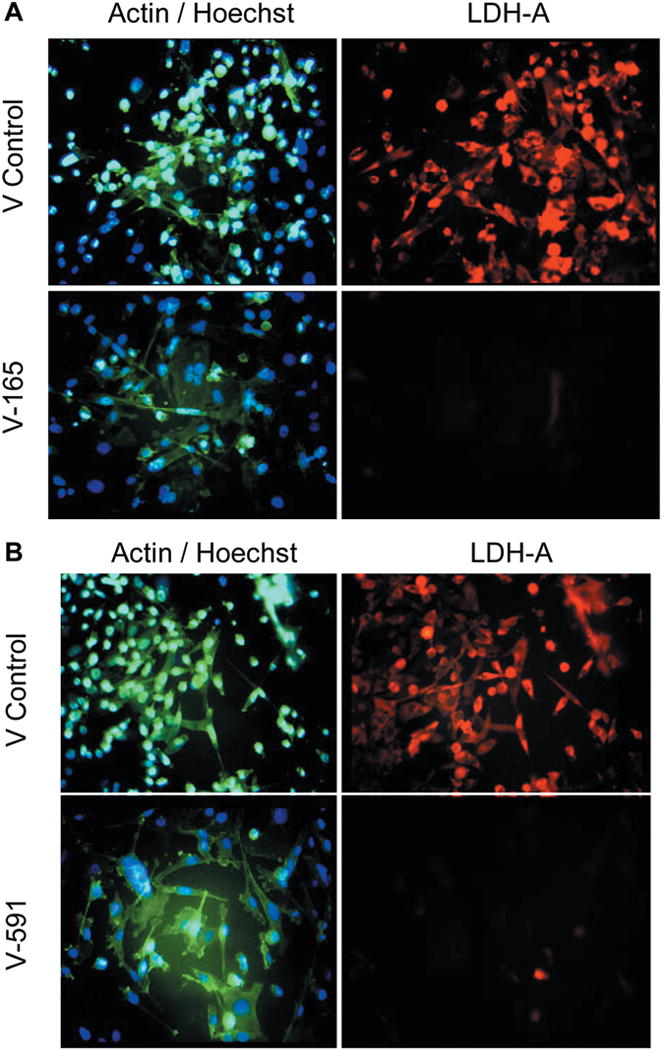
Figure 3. Western blot confirmation of stable LDHA knockdown in puromycin resistant MDA-MB-231 cells by lentiviral particles V-165 and V-591. The blot includes β-actin loading controls (45 kD) and LDHA (37 kD) bands.
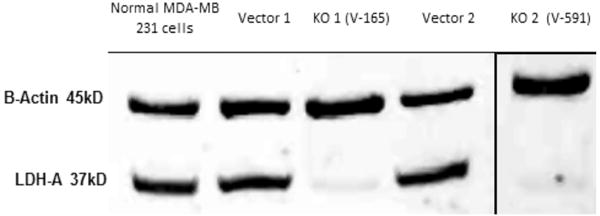
Figure 4. A. qPCR confirmation of stable LDHA knockdown in puromycin resistant MDA-MB-231 cells by lentiviral particles V-165 vs. Vector control using β-actin housekeeping gene as a control. The data show fold change (KD1/V1), and p-value=0.0136 (n=3). B. Equal distribution of β-actin protein expression in vector controls vs. lentiviral particles V-165, with morphology shown for samples (left) and β-actin (right): validation of β-actin housekeeping gene used for qPCR.
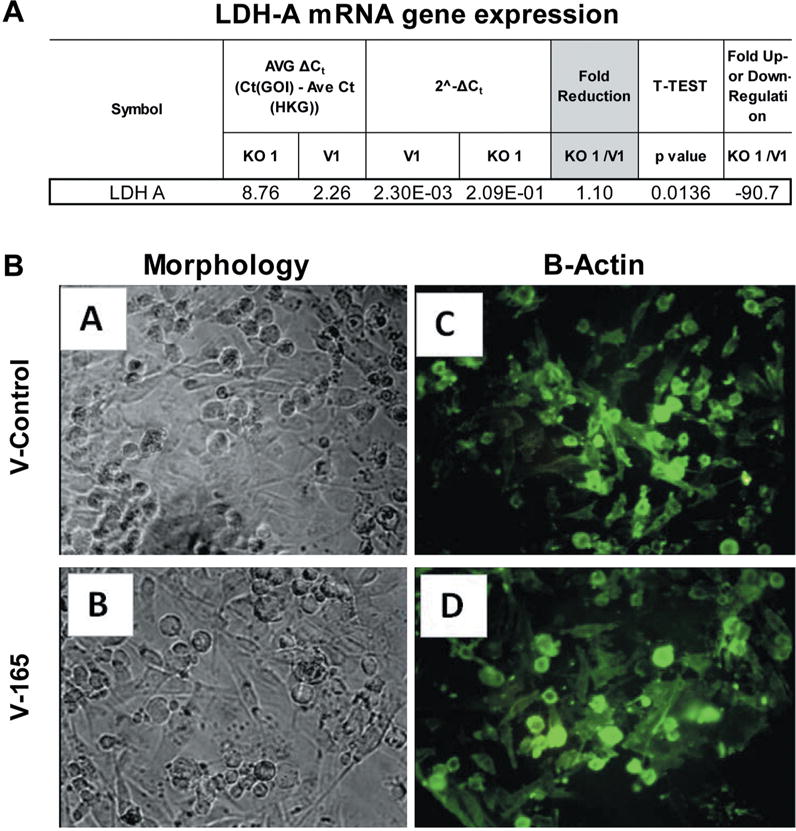
Figure 5. A. Lactic Acid produced by Vector controls vs. LDH-A KDs. The data represents lactic acid produced per cell for vector controls (V1, V2) and knockdowns (KD1, KD2) and are presented as the Mean±S.E.M., n=4. Significance of difference between vector controls and Knockdowns was determined by students’t-test, N.S. (no significant differences were found). B. HPLC determination of lactic acid. The data (Top) are presented as average peak area (211 nM) for vector controls vs. V-165 KD clone and are expressed as the Mean±S.E.M., n=4. Statistical difference between the groups were determined by a student’s t-test, N.S at p<0.05. Peaks are presented (Bottom) in Vector vs. V-165 KD clone.
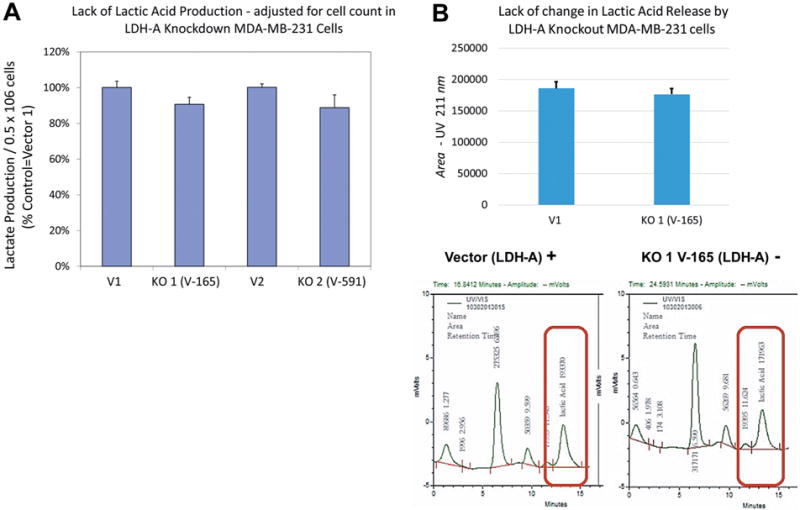
Figure 6. Metabolic variation in vector controls (V1,V2) vs. stable KD (V-165 and V-591). The data is presented as viable cell count, lactic acid produced, somatic ATP produced and glucose consumed (% control normalized to V1). Statistical difference between the vector controls vs. KD were analyzed by a Student’s t-test, (n=4) p<0.05. N.S.
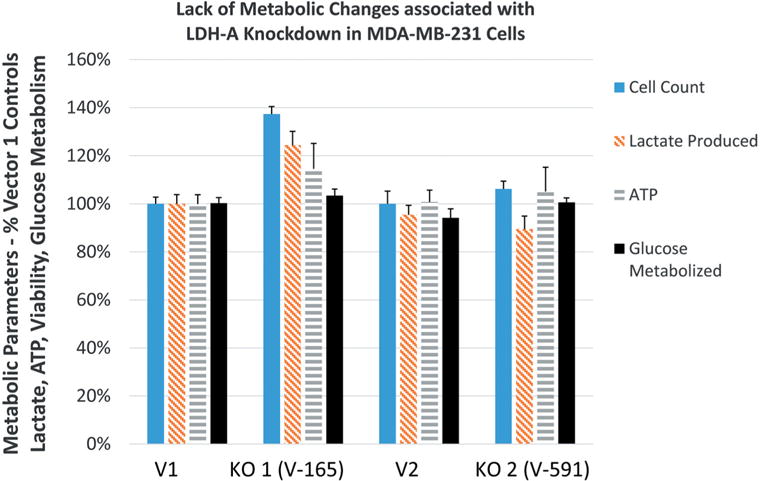
Figure 7. Whole-transcriptome analysis for LDH transcripts in MDA-MB-231 cells. The data is presented as number, gene symbol, and description of mRNA.
Discussion
The high glycolytic flux in tumor cells is carried out by a number of enzymes including LDH, glucose transporter types 1/3, hexokinases and pyruvate kinase type M. The findings in this study demonstrate that stable long-term knockdown of LDHA has no effect on production of lactic acid, glycolysis, or energy production in MDA-MB-231 cells. While this was not expected, whole-transcriptome analysis provided the reason for such effect, being that a high expression of the LDHB gene, would likely to carry out the major functions associated with the loss of LDHA.
There are meager studies on the role of LDHB in TNBC, however LDH isozymes in particular LDHB have been implicated as influential controlling elements in aggressive breast tumors, (21) including TNBC where its attenuation renders mitotic arrest in vitro and arrested tumor growth in in vivo (22, 23). Heightened expression of LDHB may contribute to tumor acidity, and growth (24) known to occur in parallel to activated RTK-PI3K-AKT-mTOR signaling (25) and is observed in various types of cancer including bladder (26) merkel cell carcinoma (27) lung cancer (28) glioma (29) or maxillary sinus squamous cell carcinoma, most reporting its association with poor survival rates (30).
From the existing data, it was not predicted that we should see absolutely no change in any metabolic parameter tested by a near complete silencing of LDHA, however this could account for similar observation in our previous work in which we identified PGG as a potent LDHA inhibitor, having no influence on the production of lactic acid itself (18). Future studies must be carried out to determine the effects of a double knockdown of LDHA/B to find out specifically how this protein (all isoforms) controls pivotal events in metabolism and production of acid.
Acknowledgments
This research was supported by the National Institute of Minority Health and Health Disparities of the National Institutes of Health through Grant Number 8 G12MD007582-28 and Grant Number 1P20 MD006738-01.
Footnotes
Conflicts of Interest
There are no conflicts of interest.
References
- 1.Mohammad GH, Olde Damink SW, Malago M, Dhar DK, Pereira SP. Pyruvate kinase M2 and lactate dehydrogenase A are overexpressed in pancreatic cancer and correlate with poor outcome. PLoS One. 2016;11:e0151635. doi: 10.1371/journal.pone.0151635. [DOI] [PMC free article] [PubMed] [Google Scholar]
- 2.Xiao X, Huang X, Ye F, Chen B, Song C, Wen J, Zhang Z, Zheng G, Tang H, Xie X. The miR-34a-LDHA axis regulates glucose metabolism and tumor growth in breast cancer. Sci Rep. 2016;6:21735. doi: 10.1038/srep21735. [DOI] [PMC free article] [PubMed] [Google Scholar]
- 3.Girgis H, Masui O, White NM, Scorilas A, Rotondo F, Seivwright A, Gabril M, Filter ER, Girgis AH, Bjarnason GA, Jewett MA, Evans A, Al-Haddad S, Siu KM, Yousef GM. Lactate dehydrogenase A is a potential prognostic marker in clear cell renal cell carcinoma. Mol Cancer. 2014;13:101. doi: 10.1186/1476-4598-13-101. [DOI] [PMC free article] [PubMed] [Google Scholar]
- 4.Koukourakis MI, Giatromanolaki A, Panteliadou M, Pouliliou SE, Chondrou PS, Mavropoulou S, Sivridis E. Lactate dehydrogenase 5 isoenzyme overexpression defines resistance of prostate cancer to radiotherapy. Br J Cancer. 2014;110:2217–2223. doi: 10.1038/bjc.2014.158. [DOI] [PMC free article] [PubMed] [Google Scholar]
- 5.Chang CC, Zhang C, Zhang Q, Sahin O, Wang H, Xu J, Xiao Y, Zhang J, Rehman SK, Li P, Hung MC, Behbod F, Yu D. Up-regulation of lactate dehydrogenase a by 14-3-3zeta leads to increased glycolysis critical for breast cancer initiation and progression. Oncotarget. 2016;7:35270–35283. doi: 10.18632/oncotarget.9136. [DOI] [PMC free article] [PubMed] [Google Scholar]
- 6.Gao S, Tu DN, Li H, Jiang JX, Cao X, You JB, Zhou XQ. Pharmacological or genetic inhibition of LDHA reverses tumor progression of pediatric osteosarcoma. Biomed Pharmacother. 2016;81:388–393. doi: 10.1016/j.biopha.2016.04.029. [DOI] [PubMed] [Google Scholar]
- 7.Wang X, Xu L, Wu Q, Liu M, Tang F, Cai Y, Fan W, Huang H, Gu X. Inhibition of LDHA deliver potential anticancer performance in renal cell carcinoma. Urol Int. 2016 doi: 10.1159/000445125. [DOI] [PubMed] [Google Scholar]
- 8.Wang J, Wang H, Liu A, Fang C, Hao J, Wang Z. Lactate dehydrogenase A negatively regulated by miRNAs promotes aerobic glycolysis and is increased in colorectal cancer. Oncotarget. 2015;6:19456–19468. doi: 10.18632/oncotarget.3318. [DOI] [PMC free article] [PubMed] [Google Scholar]
- 9.Zhou X, Chen R, Xie W, Ni Y, Liu J, Huang G. Relationship between 18F-FDG accumulation and lactate dehydrogenase A expression in lung adenocarcinomas. J Nucl Med. 2014;55:1766–1771. doi: 10.2967/jnumed.114.145490. [DOI] [PubMed] [Google Scholar]
- 10.Xian ZY, Liu JM, Chen QK, Chen HZ, Ye CJ, Xue J, Yang HQ, Li JL, Liu XF, Kuang SJ. Inhibition of LDHA suppresses tumor progression in prostate cancer. Tumour Biol. 2015;36:8093–8100. doi: 10.1007/s13277-015-3540-x. [DOI] [PMC free article] [PubMed] [Google Scholar]
- 11.Koukourakis MI, Kakouratos C, Kalamida D, Bampali Z, Mavropoulou S, Sivridis E, Giatromanolaki A. Hypoxia-inducible proteins HIF1alpha and lactate dehydrogenase LDH5, key markers of anaerobic metabolism, relate with stem cell markers and poor post-radiotherapy outcome in bladder cancer. Int J Radiat Biol. 2016;92:353–363. doi: 10.3109/09553002.2016.1162921. [DOI] [PubMed] [Google Scholar]
- 12.Li X, Lu P, Li B, Yang R, Chu Y, Zhang Z, Wan H, Niu C, Wang C, Luo K. Sensitization of hepatocellular carcinoma cells to irradiation by miR34a through targeting lactate dehydrogenaseA. Mol Med Rep. 2016;13:3661–3667. doi: 10.3892/mmr.2016.4974. [DOI] [PubMed] [Google Scholar]
- 13.Li X, Zhao H, Zhou X, Song L. Inhibition of lactate dehydrogenase A by microRNA-34a resensitizes colon cancer cells to 5-fluorouracil. Mol Med Rep. 2015;11:577–582. doi: 10.3892/mmr.2014.2726. [DOI] [PubMed] [Google Scholar]
- 14.Maiso P, Huynh D, Moschetta M, Sacco A, Aljawai Y, Mishima Y, Asara JM, Roccaro AM, Kimmelman AC, Ghobrial IM. Metabolic signature identifies novel targets for drug resistance in multiple myeloma. Cancer Res. 2015;75:2071–2082. doi: 10.1158/0008-5472.CAN-14-3400. [DOI] [PMC free article] [PubMed] [Google Scholar]
- 15.Yao F, Zhao T, Zhong C, Zhu J, Zhao H. LDHA is necessary for the tumorigenicity of esophageal squamous cell carcinoma. Tumour Biol. 2013;34:25–31. doi: 10.1007/s13277-012-0506-0. [DOI] [PubMed] [Google Scholar]
- 16.Rong Y, Wu W, Ni X, Kuang T, Jin D, Wang D, Lou W. Lactate dehydrogenase A is overexpressed in pancreatic cancer and promotes the growth of pancreatic cancer cells. Tumour Biol. 2013;34:1523–1530. doi: 10.1007/s13277-013-0679-1. [DOI] [PubMed] [Google Scholar]
- 17.Deiab S, Mazzio E, Messeha S, Mack N, Soliman KF. High-throughput screening to identify plant derived human LDH-A inhibitors. European J Med Plants. 2013;3:603–615. doi: 10.9734/ejmp/2013/5995. [DOI] [PMC free article] [PubMed] [Google Scholar]
- 18.Deiab S, Mazzio E, Eyunni S, McTier O, Mateeva N, Elshami F, Soliman KF. 2,3,4,6-Penta-O-galloylglucose within galla chinensis inhibits human LDH-A and attenuates cell proliferation in MDA-MB-231 breast cancer cells. Evid Based Complement Alternat Med. 2015;2015:276946. doi: 10.1155/2015/276946. [DOI] [PMC free article] [PubMed] [Google Scholar]
- 19.Evans SM, Casartelli A, Herreros E, Minnick DT, Day C, George E, Westmoreland C. Development of a high throughput in vitro toxicity screen predictive of high acute in vivo toxic potential. Toxicology in vitro: an international journal published in association with BIBRA. 2001;15:579–584. doi: 10.1016/s0887-2333(01)00064-9. [DOI] [PubMed] [Google Scholar]
- 20.Mazzio EA, Soliman YI, Soliman KF. Variable toxicological response to the loss of OXPHOS through 1-methyl-4-phenylpyridinium-induced mitochondrial damage and anoxia in diverse neural immortal cell lines. Cell Biol Toxicol. 2010;26:527–539. doi: 10.1007/s10565-010-9161-7. [DOI] [PMC free article] [PubMed] [Google Scholar]
- 21.Nam K, Oh S, Shin I. Ablation of CD44 induces glycolysis-to-oxidative phosphorylation transition via modulation of the c-Src-Akt-LKB1-AMPKalpha pathway. Biochem J. 2016;473:3013–3030. doi: 10.1042/BCJ20160613. [DOI] [PubMed] [Google Scholar]
- 22.McCleland ML, Adler AS, Shang Y, Hunsaker T, Truong T, Peterson D, Torres E, Li L, Haley B, Stephan JP, Belvin M, Hatzivassiliou G, Blackwood EM, Corson L, Evangelista M, Zha J, Firestein R. An integrated genomic screen identifies LDHB as an essential gene for triple-negative breast cancer. Cancer Res. 2012;72:5812–5823. doi: 10.1158/0008-5472.CAN-12-1098. [DOI] [PubMed] [Google Scholar]
- 23.Wang S, Xie J, Li J, Liu F, Wu X, Wang Z. Cisplatin suppresses the growth and proliferation of breast and cervical cancer cell lines by inhibiting integrin beta5-mediated glycolysis. Am J Cancer Res. 2016;6:1108–1117. [PMC free article] [PubMed] [Google Scholar]
- 24.Brisson L, Banski P, Sboarina M, Dethier C, Danhier P, Fontenille MJ, Van Hee VF, Vazeille T, Tardy M, Falces J, Bouzin C, Porporato PE, Frederick R, Michiels C, Copetti T, Sonveaux P. Lactate dehydrogenase B controls lysosome activity and autophagy in cancer. Cancer Cell. 2016;30:418–431. doi: 10.1016/j.ccell.2016.08.005. [DOI] [PubMed] [Google Scholar]
- 25.Zha X, Wang F, Wang Y, He S, Jing Y, Wu X, Zhang H. Lactate dehydrogenase B is critical for hyperactive mTOR-mediated tumorigenesis. Cancer Res. 2011;71:13–18. doi: 10.1158/0008-5472.CAN-10-1668. [DOI] [PubMed] [Google Scholar]
- 26.Yang X, Cheng Y, Li P, Tao J, Deng X, Zhang X, Gu M, Lu Q, Yin C. A lentiviral sponge for miRNA-21 diminishes aerobic glycolysis in bladder cancer T24 cells via the PTEN/PI3K/AKT/mTOR axis. Tumour Biol. 2015;36:383–391. doi: 10.1007/s13277-014-2617-2. [DOI] [PubMed] [Google Scholar]
- 27.Shao Q, Byrum SD, Moreland LE, Mackintosh SG, Kannan A, Lin Z, Morgan M, Stack BC, Jr, Cornelius LA, Tackett AJ, Gao L. A proteomic study of human Merkel cell carcinoma. J Proteomics Bioinform. 2013;6:275–282. doi: 10.4172/jpb.1000291. [DOI] [PMC free article] [PubMed] [Google Scholar]
- 28.McCleland ML, Adler AS, Deming L, Cosino E, Lee L, Blackwood EM, Solon M, Tao J, Li L, Shames D, Jackson E, Forrest WF, Firestein R. Lactate dehydrogenase B is required for the growth of KRAS-dependent lung adenocarcinomas. Clin Cancer Res. 2013;19:773–784. doi: 10.1158/1078-0432.CCR-12-2638. [DOI] [PubMed] [Google Scholar]
- 29.Kounelakis MG, Zervakis ME, Giakos GC, Postma GJ, Buydens LM, Kotsiakis X. On the relevance of glycolysis process on brain gliomas. IEEE J Biomed Health Inform. 2013;17:128–135. doi: 10.1109/TITB.2012.2199128. [DOI] [PubMed] [Google Scholar]
- 30.Kinoshita T, Nohata N, Yoshino H, Hanazawa T, Kikkawa N, Fujimura L, Chiyomaru T, Kawakami K, Enokida H, Nakagawa M, Okamoto Y, Seki N. Tumor suppressive microRNA-375 regulates lactate dehydrogenase B in maxillary sinus squamous cell carcinoma. Int J Oncol. 2012;40:185–193. doi: 10.3892/ijo.2011.1196. [DOI] [PubMed] [Google Scholar]


