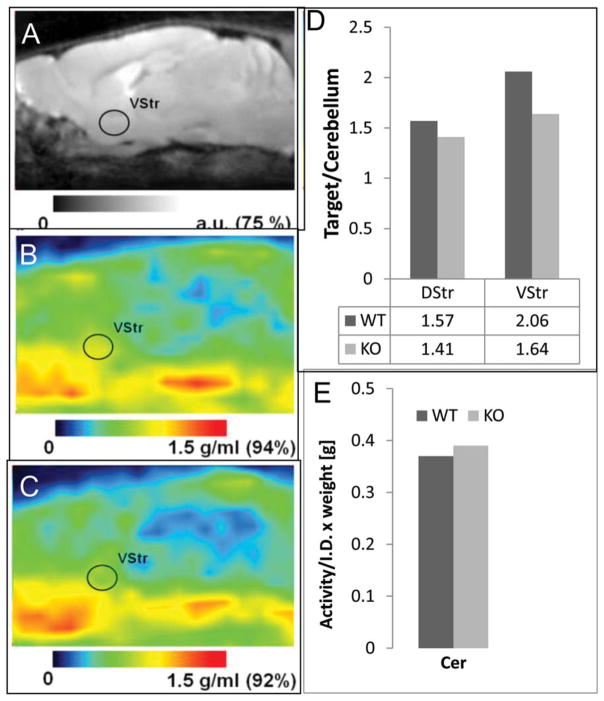
FIGURE 8.
In Vivo Mice PET with 18F-7-OH-FHXPAT. (a) Sagital sections of the MR mouse brain template. (b) 18F-7-OH-FHXPAT images of the WT mouse. (c). D2 knock out (KO) mouse. Right VStr is indicated on all three images. Color bars show the scale of the images presented in arbitrary units (a.u., MR) and standard uptake value units (g/mL, PET). Mice were injected with 2.0 MBq of 18F-7-OH-FHXPAT and scanned for 30 min starting at 30 min post tracer injection. Anesthesia was maintained with 2.5% isoflurane. (d) Target to cerebellum ratios of 18F-7-OH-FHXPAT for DStr, VStr in both WT (n=2), and KO (n=2) mouse. (e). Cerebellum activity normalized to injected activity and animal weight (in grams) in both WT and KO mice

