Abstract
Daily living activity monitoring is important for early detection of the onset of many diseases and for improving quality of life especially in elderly. A wireless wearable network of inertial sensor nodes can be used to observe daily motions. Continuous stream of data generated by these sensor networks can be used to recognize the movements of interest. Dynamic Time Warping (DTW) is a widely used signal processing method for time-series pattern matching because of its robustness to variations in time and speed as opposed to other template matching methods. Despite this flexibility, for the application of activity recognition, DTW can only find the similarity between the template of a movement and the incoming samples, when the location and orientation of the sensor remains unchanged. Due to this restriction, small sensor misplacements can lead to a decrease in the classification accuracy. In this work, we adopt DTW distance as a feature for real-time detection of human daily activities like sit to stand in the presence of sensor misplacement. To measure this performance of DTW, we need to create a large number of sensor configurations while the sensors are rotated or misplaced. Creating a large number of closely spaced sensors is impractical. To address this problem, we use the marker based optical motion capture system and generate simulated inertial sensor data for different locations and orientations on the body. We study the performance of the DTW under these conditions to determine the worst-case sensor location variations that the algorithm can accommodate.
Keywords: Human-Activity Recognition, Dynamic Time Warping, Sensor Positioning, Wearable computers, Optical Motion Capture
1. INTRODUCTION
Human-activity recognition has become a task of high interest within the field, especially for medical, military, and security applications. For instance, patients with diabetes, obesity, or heart diseases are often required to follow a well defined exercise routine as part of their treatment [1] [2]. Therefore, recognizing activities such as walking, running, or cycling becomes quite useful to provide feedback to the caregiver about the patient’s behavior. A continuous stream of data in particular is a sequence of real numbers generated naturally in many applications, such as real-time network measurements, medical devices, sensor networks, and manufacturing processes. Matching patterns in continuous data streams is important for monitoring and mining stream data [3]. For example, if the real-time stream of data from the electrocardiogram is found similar to a pattern of ischemia, the physician can be alerted for assistance [4].
Various signal processing and classification techniques are employed to achieve high accuracies in Human-Activity recognition such as hidden Markov model (HMM), principle component analysis (PCA), support vector machines (SVM), linear discriminant analysis (LDA), artificial neural networks (ANN) and dynamic time warping (DTW) [5]. In this paper, we focus on DTW.
Euclidean distance is a traditionally used technique to measure the similarity between two sequences [6]. However, a more robust technique is needed that allows an elastic shifting of the time axis, to hold valid for sequences that are similar but out of phase(Figure (1)). Dynamic time warping (DTW) is a technique that allows variations in the time axis to be accommodated for a fair comparison between them [7].
Figure 1.
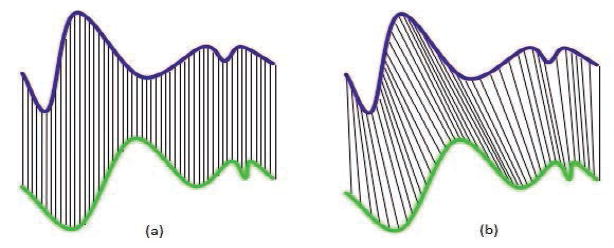
(a) Euclidean distance (b) DTW distance
Dynamic time warping (DTW) is an algorithm for measuring the similarity between two sequences which may vary in their time or speed. For instance, similarities in walking patterns can be detected, even if the person was walking slowly or if he or she were walking more quickly. DTW has been applied to video and audio signal processing and indeed to any data which can be turned into a time-series representation. A well-known application for DTW to cope with speed variations is automatic speech recognition. DTW is also employed in Human-Activity recognition for pattern matching of a previously stored template of a data stream from a body-worn sensor corresponding to a movement and the real-time incoming sample data [8]. However, DTW has a disadvantage that in order to have a precise match, the position and orientation of the sensor when the template of movement was recorded should be the same when using it in real-time detection, which might be difficult to retain. Body-worn sensors might be slightly misplaced or accidentally moved. In this paper, we attempt to study the performance of DTW under the misplaced sensor stream of data. For determining the acceleration values from all possible misplacements, we need closely spaced infinite number of sensors placed on the body which is practically very difficult. Creating all different configurations and the experimental study associated with it can be tedious. To facilitate this, we make use of an optical motion capture to create a human skeleton model and reconstruct the simulated inertial measurements values which can be manipulated to produce the equivalent of misplaced or disorientated sensor.
The rest of the paper is organized as follows: In Section 2 we review the related works and discuss the Dynamic Time Warping Algorithms. In Section 3, we introduce the system components and the generation of accelerations from motion capture and its validity. We introduce the methods to generate the shift in orientations and translations in the sensor data in Section 4. In Section 5, we provide the results of experiment. Section 6 and 7 gives a brief introduction to our future direction.
2. BACKGROUND
2.1 Related Work
Dynamic Time Warping is used as a feature classification technique in variety of applications such as speech recognition [9], character recognition [10], etc. Researchers have employed methods like normalization of DTW, matching distance [1] for speech recognition or clustering algorithms to estimate high quality templates [11]. Normalization techniques cannot be utilized in human activity recognition as under sensor misplacement, the acceleration values are distributed among other axes by a factor that is dependent on the degree of misplacement. It is also difficult to employ correcting techniques to the templates in Human-Activity recognition where there are variations in the templates due to accidental misplacements of the sensor. These variations can be in the form of rotations or translations by an unknown factor which make them difficult to predict [12]. Therefore, we attempt to determine the boundary limits of misplacements and disorientations under which the DTW will perform with satisfactory results.
2.2 Review of Dynamic Time Warping
Suppose we have two time series, R and T, of length M and N, respectively, where
| (1) |
To align two sequences using DTW, we construct an n-by-m matrix where the (ith, jth) element of the matrix contains the distance between the two points ri and tj (i.e. d(ri, tj) = (ri – tj)2). As shown in Figure (2), each matrix element (i, j) corresponds to the alignment between the points ri and tj. A warping path W is a contiguous (in the sense that is stated below) set of matrix elements that defines a mapping between R and T. The kth element of W is defined as wk = (i, j)k. Therefore, we have
| (2) |
The warping path is typically subject to several constraints.
Figure 2.
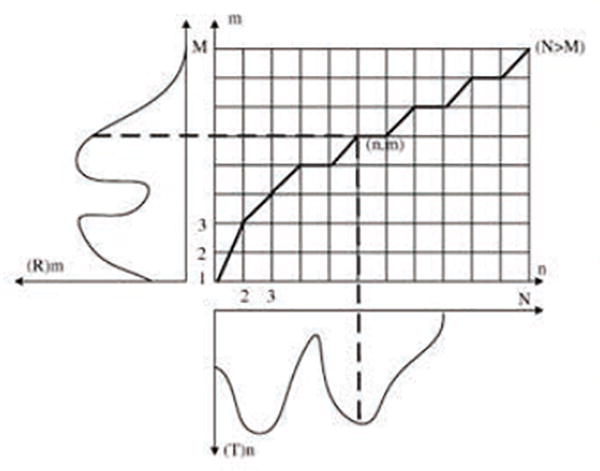
An example of a DTW path
Boundary conditions
w1 = (1, 1) and wk = (m, n). This requires the warping path to start and finish in diagonally opposite corner cells of the matrix.
Continuity
Given wk = (a, b), then wk-1 = (a′, b′), where a-a′ ≤ 1 and b –b′ ≤ 1. This constraint restricts the allowable steps in the warping path to the adjacent cells (including diagonally adjacent cells).
Monotonicity
Given wk = (a, b), then wk-1 = (a′ , b′), where a –a′ ≥ 0 and b –b′ ≥ 0. This forces the points in W to be monotonically spaced in time.
There are exponentially many warping paths that satisfy the above conditions. However, we are only interested in the path that minimizes the warping cost:
| (3) |
This path can be found using dynamic programming to evaluate the following recurrence, which defines the cumulative distance γ(i, j) as the distance d(i, j) found in the current cell and the minimum of the cumulative distances of the adjacent elements:
| (4) |
The Euclidean distance between two sequences can be seen as a special case of DTW where the kth element of W is constrained such that wk = (i, j)k and i = j = k. Note that it is only defined in the special case where the two sequences have the same length. The time and space complexity of DTW is O(nm).
3. METHODOLOGY
3.1 System Components
Inertial Measurement Units
Figure 3 shows the sensor node used in the system. Each sensor node consists of commercially available Motiv TelosB with a custom designed sensor board. The sensor board consists of a tri-axial accelerometer and a bi-axial gyroscope and is powered by a rechargeable battery. Sensor nodes that are placed on the body sample the data at 100 Hz perform limited local computations and transmit the data wirelessly to a base-station. In our experiments, the base-station is a sensor node connected to a PC via the USB port. During the experiment, we also use a Logitech® camera to record the video of the movement trials. The video frames and data samples are recorded and synchronized in MATLAB®.
Figure 3.
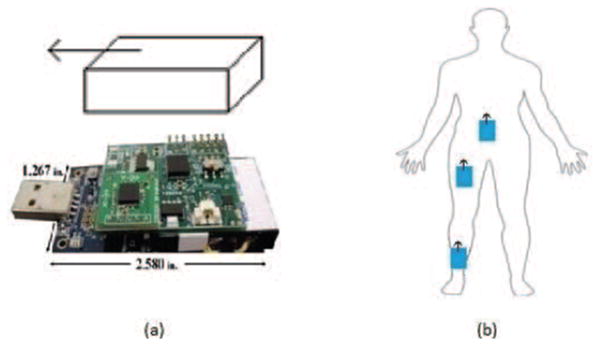
(a) TelsoB mote (b) Placement of the motes
Optical Motion Capture System
We use a commercial Vicon® system [13] that comes with eight cameras. Each camera consists of a distinct video camera, a strobe head unit, a suitable lens, an optical filter and cables. The Vicon® is supported by the Nexus 1.7 software which works as the core motion capture and processing software. The Nexus software samples the data at 100 Hz and measures the rotations and translations at each with respect to the predefined Vicon® axes, which later can be used to reconstruct the accelerations due to random movements.
3.2 Data Collection
The Vicon® markers are placed on the IMU locations on the body, as shown in Figure 3. A replica of the IMU is generated in Vicon-Nexus® which records the rotations in Euler angles and translations in the Vicon® axes. The IMU sensor data and Vicon® data is synchronized using the ViconDataStream® software development kit for MATLAB® by which we validate the reconstruction of accelerations to the actual IMU readings.
For continuous stream of data from the Vicon®, all the markers placed on the body should be visible to at-least 4 out of the 8 cameras present in the system, which restricts on the variety of movements that can be tested. We collected data on an average of 20 trials by placing IMU on the right thigh, waist and ankle for the movements sit-to-stand, stand-to-sit, walking, turn right 90° and back, kneeling forward and back, turn left 90° and back with each movement being the target movement for each trial.
By using the video file available, we annotate the data to its corresponding movement, with which we can generate the template file for a particular movement. These template files are later used for evaluating the DTW distance over the sample data. As these templates have a particular position and orientation, misplacement in the sensor position can lead to more error.
For the sake of simplicity, we assume that the human limb is a perfect spherical cylinder. We induce variations in the position of the sensor by adding a constant rotation and translation factor in a particular axis. Due to this assumption, the regenerated accelerations lack the influence of muscle or tissue flexibility that is produced by any human limb when in motion. Therefore, the correlation between accelerations generated by the Vicon® and the IMU may be slightly less than the ideal cases.
3.3 IMU data generation with motion-capture
Let the rotation about the X, Y and Z axes be denoted as ϕ, θ and ψ respectively [14]. The rotation matrices Rx, Ry and Rz with the Euler angles known in degrees are given as:
| (5) |
An orthogonal matrix producing a combined rotation effect corresponding to clockwise rotation with x-y-z convention is formed as:
| (6) |
The translations are converted to accelerations by differentiating and then post-multiplied to the matrix R at each sample to provide the accelerations of the IMU replica in the IMU frame. The samples received from Vicon® carry noise and therefore the translations are needed to be smoothed which is done initially using a median filter before filtering it with a second order low-pass filter to remove the spurious changes in the data collected.
The sample at any instant is given by a six columns matrix including rotations in degrees and translations. The sample changes at any instant can be denoted by a space vector S(t):
| (7) |
| (8) |
| (9) |
| (10) |
| (11) |
| (12) |
| (13) |
The computations show the conversion of translations in the Vicon® frame to IMU frame. The accelerations obtained in m/s2 lack the gravity component. The influence of the gravity is determined by using the same rotation matrices obtained in Equation (7) and then subtracted to reconstruct the accelerations that are equivalent to IMU tri-axial accelerometer values. The negative sign in Equation (13) symbolizes the counteracting forces against gravity. Figure 4 shows a comparison between the IMU acceleration recordings and the reconstructed accelerations from the Vicon® or IMU replica.
Figure 4.
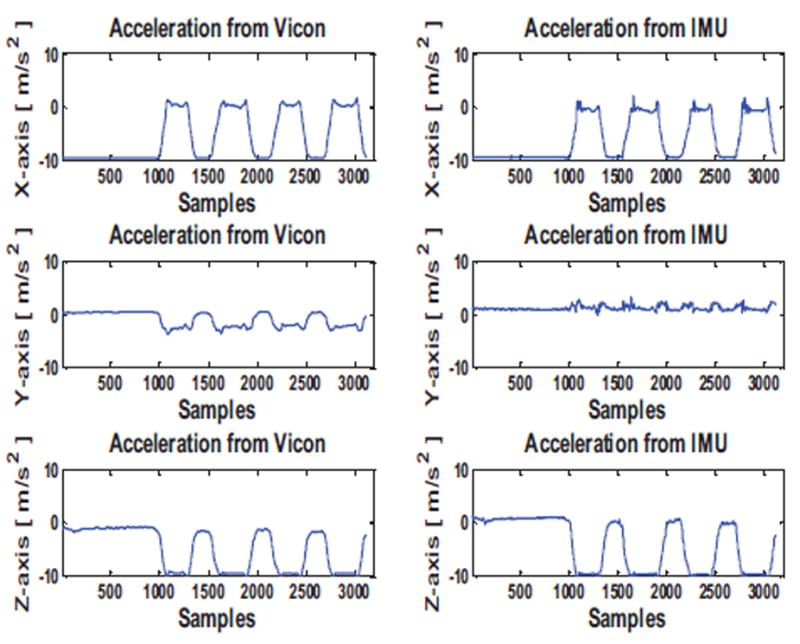
Comparison of accelerations along the X, Y, Z axis between IMU and reconstructed accelerations from Vicon®
The angles obtained from Vicon® at each instant, need to be converted to the sensor (body) frame from the Vicon® (global) frame.
| (14) |
With the x-y-z rotation convention the rotation matrix for the same are obtained by Equation (15)
| (15) |
Converting the combined rotation matrix from Vicon® (global) frame to sensor (body) frame, we can determine the local angles
| (16) |
Differentiating with respect to time, the angles are converted to obtain the angular velocities (gyroscope readings).
| (17) |
| (18) |
Figure 5 shows a comparison between the IMU gyroscope recordings and the reconstructed angular velocities from the Vicon® or IMU replica.
Figure 5.
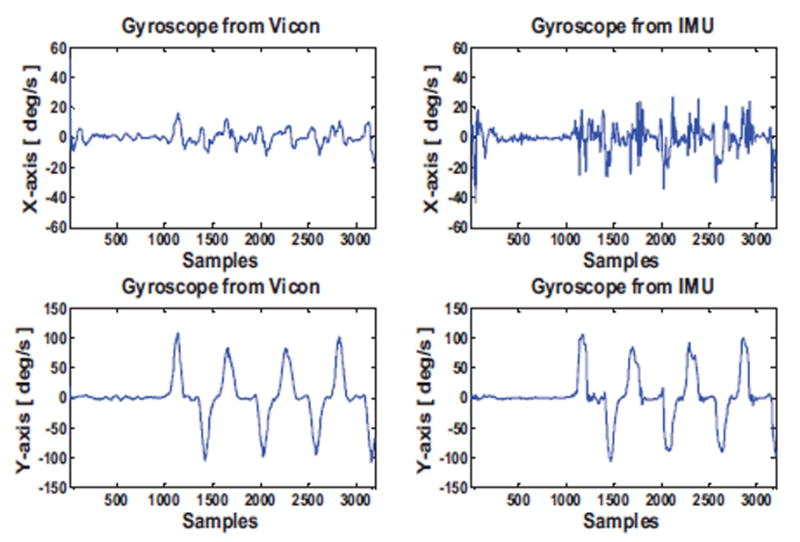
Comparison of gyroscope along the X, Y axis between IMU and reconstructed angular velocities from Vicon®
The two sensor values have a satisfactory correlation factor of 0.84. The primary source of inconsistency is due to sporadic noise that can be well handled in DTW.
4. GENERATION OF MISPLACEMENT
The misplacement of the sensor can be due to change either in rotation or in translations. The pure translation is invoked in the sensor accelerations using backward transformations and pure rotation by post multiplying with constant angle rotation matrix.
4.1 Orientation
As shown if Figure 6, a sensor placed on the body can rotate along its own axis in any direction. Therefore, we generate the rotated acceleration values by post-multiplying the accelerations generated from optical motion capture by a constant angle rotation matrix, in the range of -90° to +90°along the X, Y and Z axis individually. The constant angle rotation matrix, denoted by Rdeviation, is generated by using the rotation matrices in Equation (5) along the respective axis. If there is a rotation along the z-axis by an angle ω the equations will be of form
| (19) |
Figure 6.
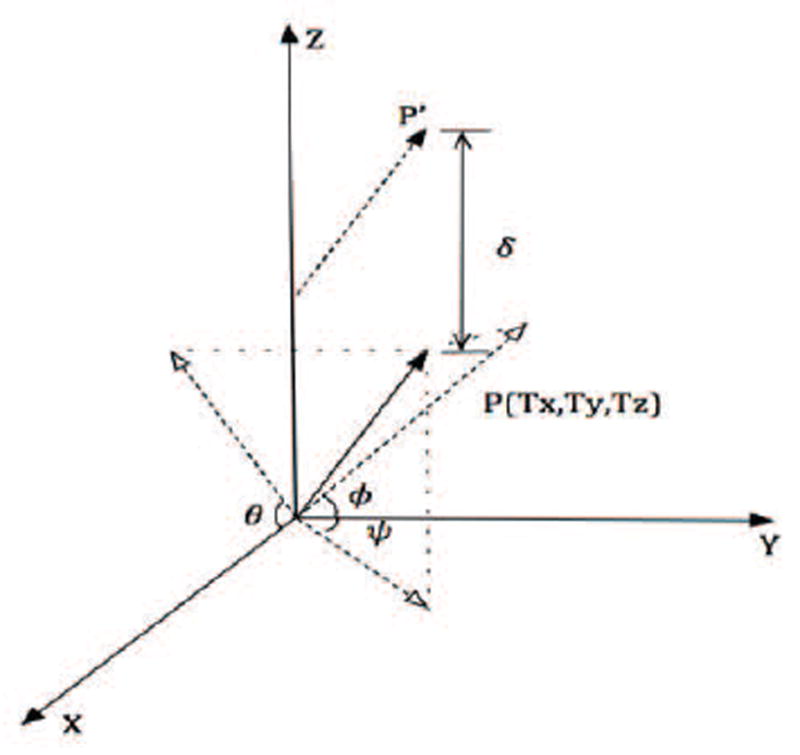
A space vector P showing the position and angles along Vicon® axis. Space vector P′ denotes the shifted version of the original vector.
Using the total acceleration generated from Equation (13), we denote the final acceleration due to rotation by:
| (20) |
When we obtain these disoriented acceleration values, using the original position templates we compute the DTW distance for these simulated rotated sample data.
4.2 Translation
A sensor placed positioned on the body can have pure translations only along the vertical axis as in other direction will involve a combination of both translation and rotation along its own axis. If the sensor is supposed to be displaced along vertical axis, it is denoted by a vector (0 0 δ) where δ denotes the displacement along the vertical axis. The motion of this vector in the Vicon® co-ordinate system is determined by post-multiplying it to the rotation matrix R from Equation (6) at each sample. The vector position matrix at each instant is added to the translations in Equation (7) which produces the effect of displaced sensor position values in the Vicon® co-ordinate system. We then process these values to convert them into accelerations and use them as sample values for DTW processing.
| (21) |
| (22) |
| (23) |
| (24) |
| (25) |
| (26) |
| (27) |
| (28) |
| (29) |
The accelerations recorded from the sensor have a prominent gravity component and the actual accelerations due to human motions are very low. As illustrated in Figure 8, the translations do not produce significant changes in the values that the DTW can accommodate.
Figure 8.
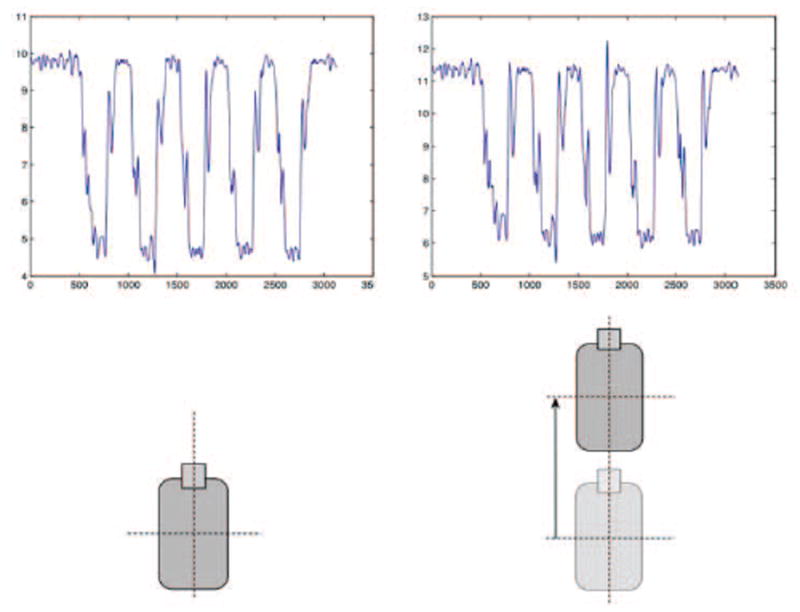
Effects of translation on accelerations of Z-axis
Using the results from the translated and rotated data, we try to determine the range of misplaced sensor locations that the DTW can accommodate for a movement.
5. RESULTS
The acceleration values from the sensor are dependent on the subject performing the motion. Therefore, acceleration values from two different subjects might be dissimilar from each other. For investigating the effects of sensor misplacement, we need to avoid the variances caused by using templates from different subjects. Therefore in this study, we primarily focus on a single-subject scenario and sensor misplacements. With the sensor devices placed on the body along with reflective markers, we perform the set of movements.
We make the use of the simulated sensor data from the various body positions to establish threshold limits for the detection of each of the target movements. With the help of the Vicon® system, we generate 20 data sets of simulated sensor values for each of the target movements that we randomly divide into two equal parts: one for training and the other for testing. Using the training templates and data sets, we compute the DTW distance values for all the recorded movements. We determine the closest non-target movement to each target movement. To differentiate between these two movements, we need a threshold distance value, served as the margin to ensure the separability of target and non-target movements.
Figure 9 shows the distribution of the DTW distance values for thigh sensor with sit-to-stand movement as the target movement. We can determine the walking to be the closest non-target movement to sit-to-stand movement.
Figure 9.
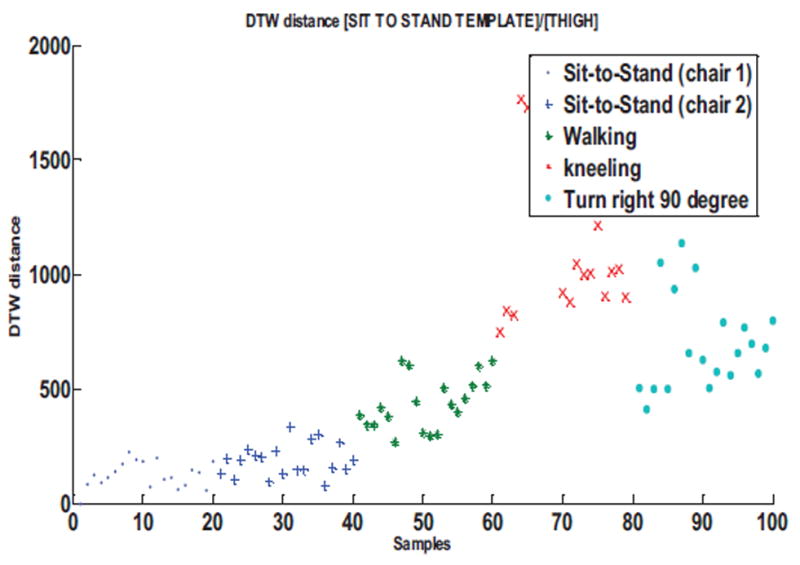
DTW distance distribution for sit-to-stand movement template for thigh sensor compared to various non-target movements
We determine similar plots of the DTW distance values for each of the target movement and its closest non-target movement. Figure 10 shows the distribution of the DTW distance values for the kneeling movement with the ankle sensor and Figure 11 for turn right 90°. Figure 12 is the DTW distance distribution for the kneeling movement with the waist sensor.
Figure 10.
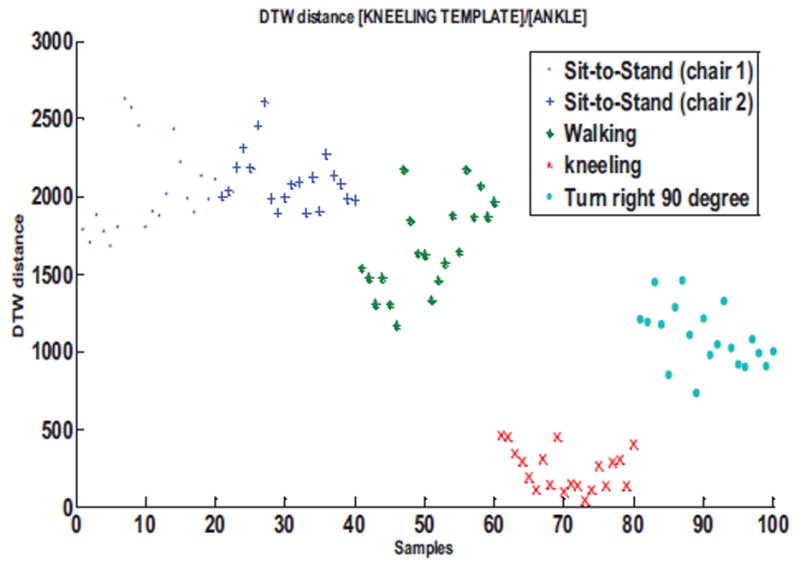
DTW distance distribution for kneeling movement template for ankle sensor compared to various non-target movements
Figure 11.
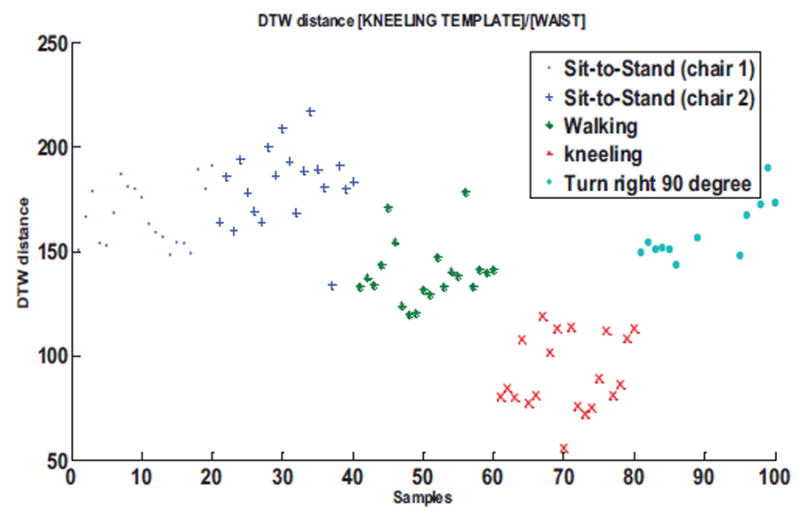
DTW distance distribution for kneeling movement template for ankle sensor compared to various non-target movements
Figure 12.
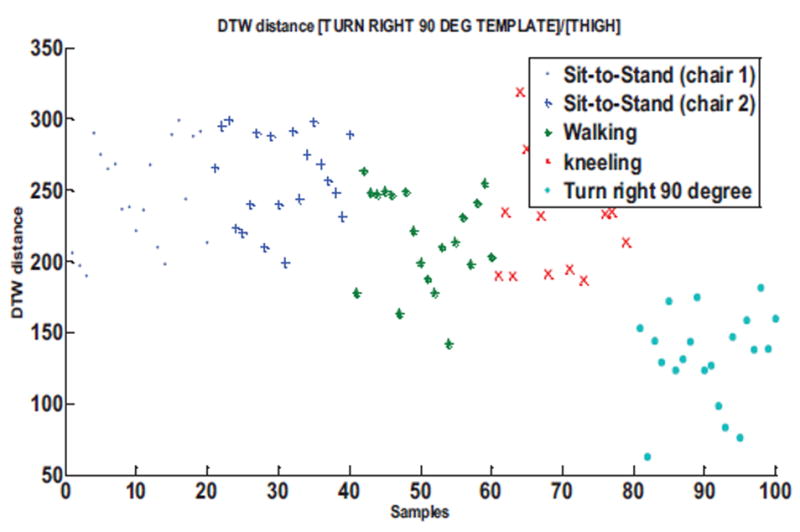
DTW distance distribution for turn right 90° template movement for thigh sensor compared to various non-target movements
Having established a threshold on the DTW distance values for Sit-to-Stand movement, using the testing data, we check the robustness of the algorithm. The established DTW threshold distance misclassifies the walking movement as sit-to-stand on three instances and sit-to-stand as walking on one instance giving an accuracy of 98% where we choose 100 maximum DTW distances (worst-case) for target movement and 100 minimum DTW distances (best-case) for non-target movement. Figure 13 shows the comparison of the sit-to-stand and walking DTW distance values for thigh sensor with the horizontal line denoting the threshold for target movement. Figure 14 shows the comparison of kneeling and walking distance values for the waist sensor.
Figure 13.
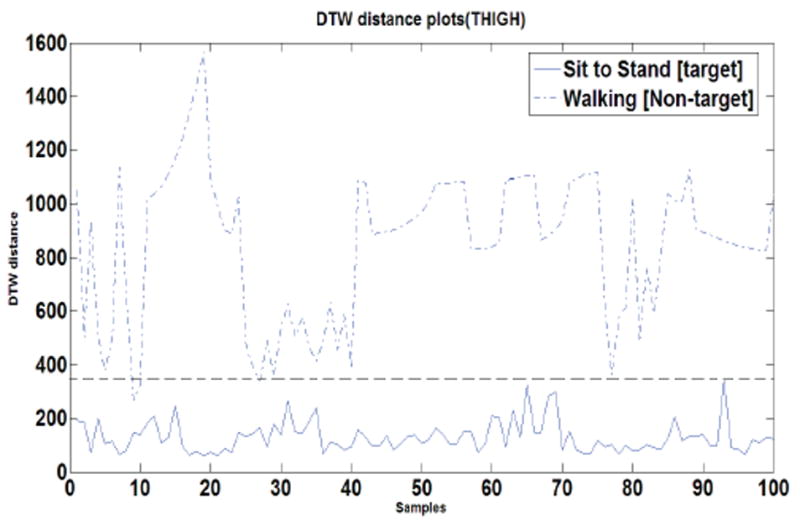
Comparison between Sit-to-Stand and Walking DTW distances for thigh sensor. The dotted horizontal line denotes the threshold.
Figure 14.
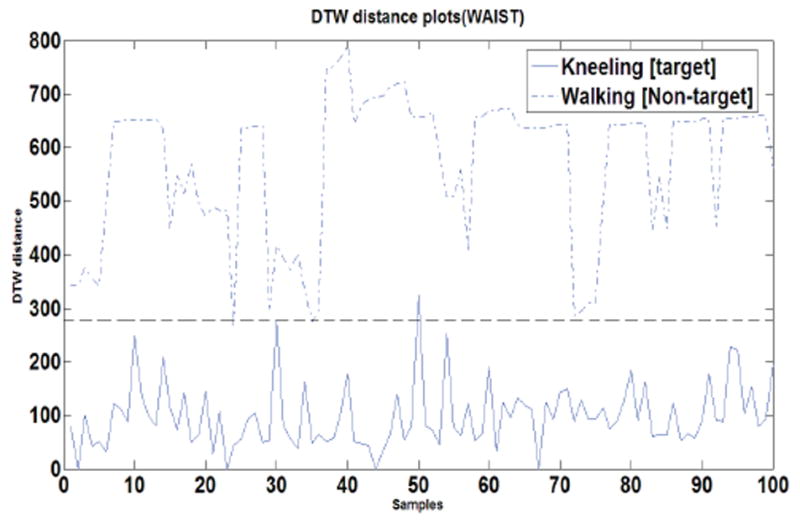
Comparison between kneeling and Walking DTW distances for waist sensor. The dotted horizontal line denotes the threshold.
In the similar fashion, we obtain the threshold value for detection of each of the target movements.
Orientation
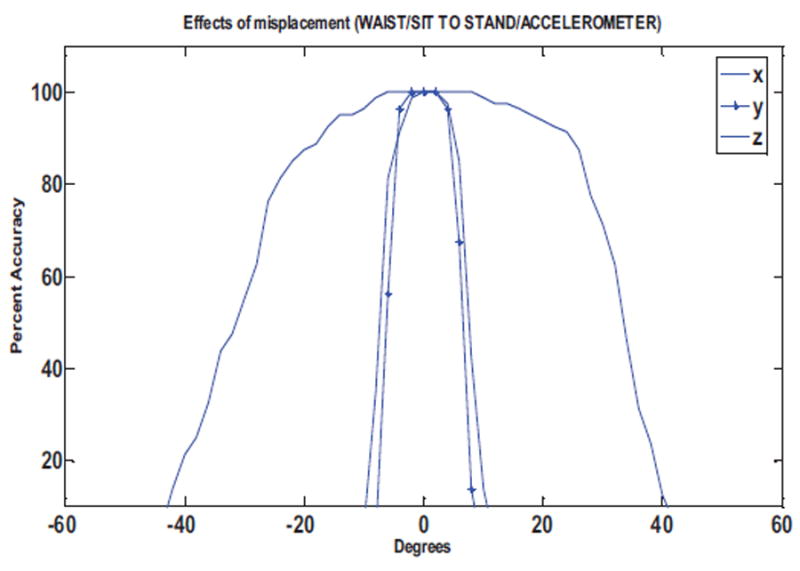
The sensor on the body has the freedom to be rotated in two axes, though for the purpose of analysis, we try and learn the impact of sensor misplacement in all the three axes. For generating the hypothetical misplaced IMU acceleration values, we induce a constant degree of rotation along the axes in the original position. We achieve these misplaced sensor accelerations by rotating it from a range of -90° to +90° in steps of 2 degrees and for each step evaluate the performance of DTW. With the same threshold limit we used for the testing data, we perform the DTW comparison between the testing templates for target movement and the misplaced sensor accelerations. The DTW distance is computed on 80 misplaced sit-to-stand trials for each degree of rotation and their accuracies are measured.
Accuracy is defined as the ratio of correctly classified rotated target movements to the total number of target movements. Figure 15 shows the influence of the sensor rotation along the X, Y and Z axes on the accuracy of the DTW distance values for sit-to-stand movement for the thigh sensor.
Figure 15.
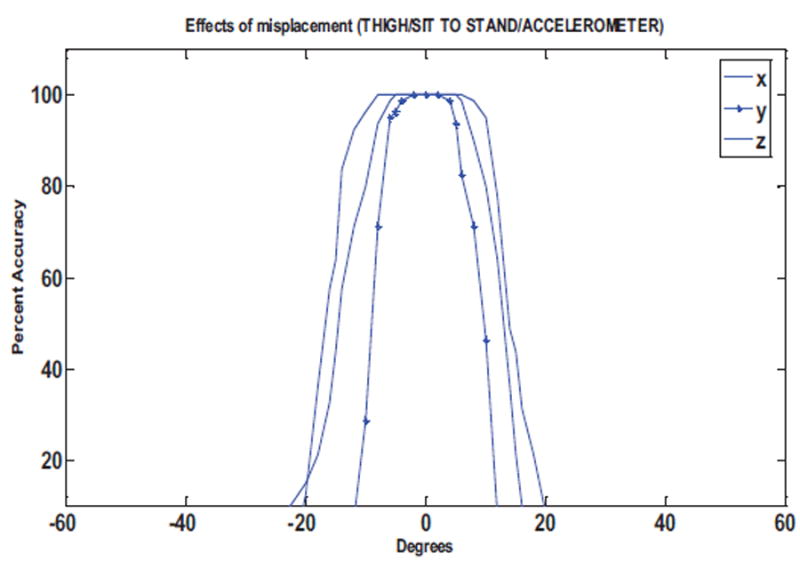
Accuracy against degree of rotation for thigh sensor for detection of sit-to-stand movement
Figure 16 and Figure 17 show the effects of the sensor rotations on the accuracy for detection of kneeling and turn left 90° movements, respectively. We obtain similar plots for the performance of sensor disorientation on the DTW based gyroscope evaluations. Figure 19 and Figure 20 show the performance of the gyroscope in terms of percent accuracy for the detection of sit-to-stand and kneeling movements.
Figure 16.
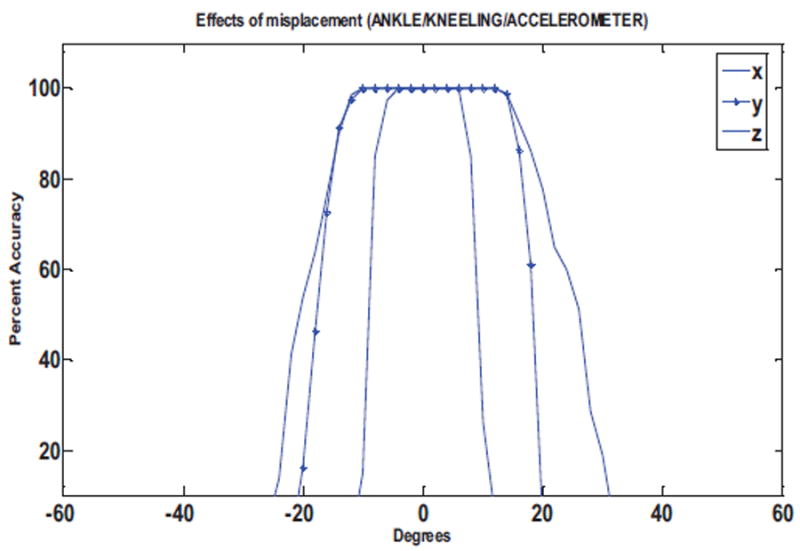
Accuracy against degree of rotation for ankle sensor for detection of kneeling movement
Figure 17.
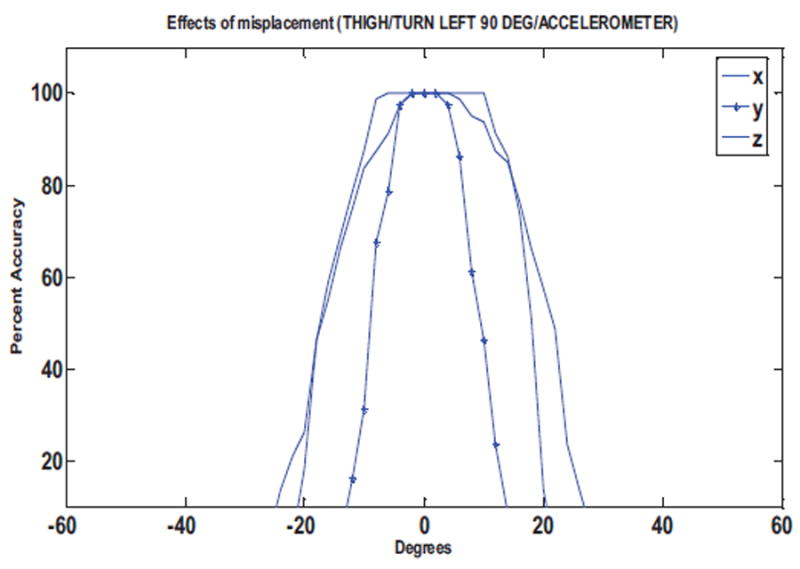
Accuracy against degree of rotation for waist sensor for detection of turn left 90° movement
Figure 19.
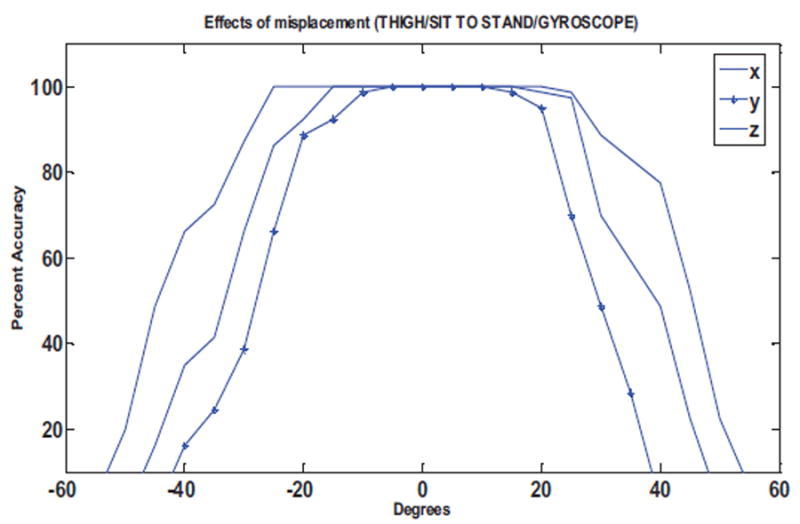
Accuracy against degree of rotation for thigh sensor (gyroscope) for detection of sit-to-stand movement
Figure 20.
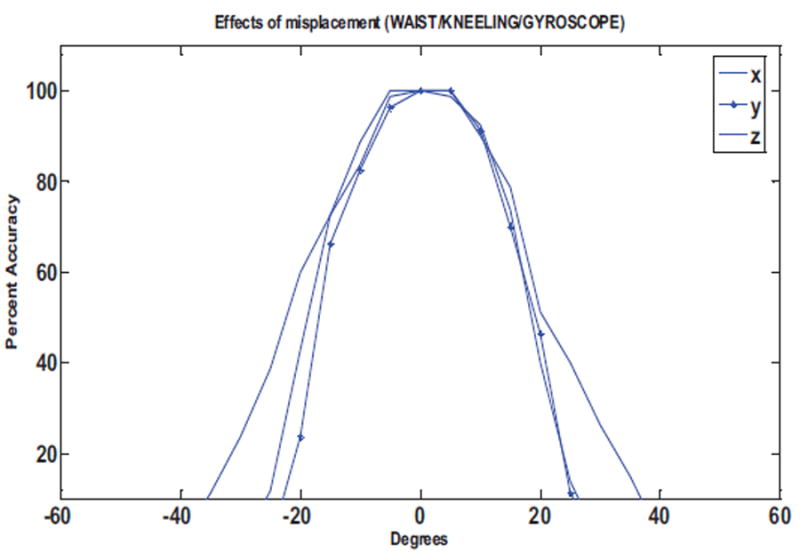
Accuracy against degree of rotation for waist sensor (gyroscope) for detection of kneeling movement
Translation
The accelerations from the accelerometers are the results of both motions and the counteracting forces against the gravity. In particular, for wearable computing applications, acceleration changes are primarily resulted by the gravity rather than the motion itself. Provided that the body segment on which the accelerometer is placed is relatively rigid, and the distance of the accelerometers from the rotation center of the body is not severely changed, the effects of gravity forces will not be affected. Therefore, a displacement or pure translations along the vertical axis should not have drastic effects on the measured accelerations which we confirmed from our conducted experiments. The DTW distance values for these purely translated sensor accelerations gives 99.9% accuracy for a range of -20cm to 20cm displacement along the vertical axis with only one misclassified movement. Figure 21 confirms that pure translation along the vertical axis does not have drastic impacts on the DTW computations. Assuming a human limb to be an almost spherical cylinder, there cannot be pure translations along other axes.
Figure 21.
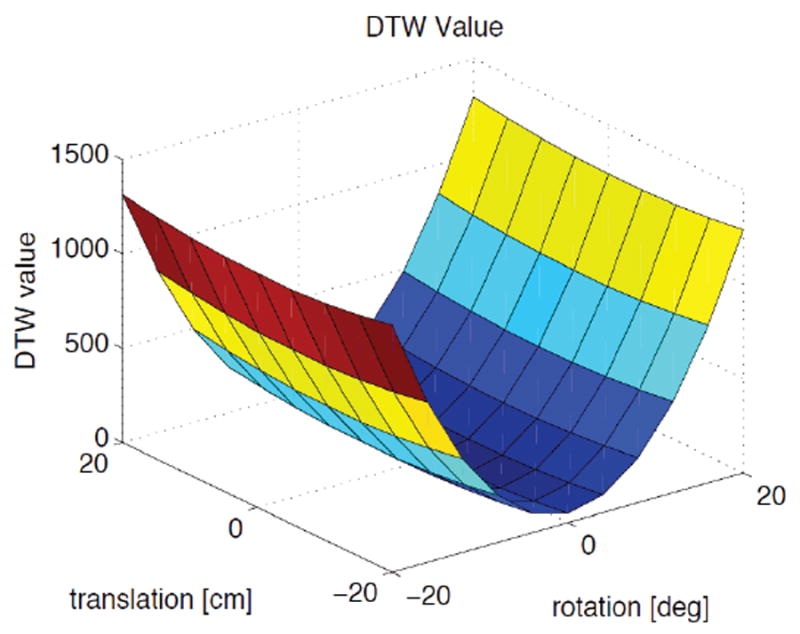
The tradeoff of rotation and translation along the vertical axis on the DTW distance value.
6. CONCLUSION
The tradeoff between the accuracy and the degrees of rotation confirms that -15° to 15° misplacements in each axis can be tolerated and does not affect the signal processing adversely. A displacement in the form of pure translation of the sensor along the vertical axis can be accommodated in DTW.
If the sensor is placed within these limits of sensor placement in which originally the template was generated, the movement is detected. If a match found, Dynamic Time Warping algorithm provides the added advantage of generating new templates (or training sets) that are specific to the new positioning of sensor. Therefore, the algorithm can learn and self-correct itself. By utilizing this, we can continue achieving higher accuracies with higher degrees of misplacement in sensor positions.
7. FUTURE WORK
For comparison between complex movements, we will take into consideration data from two or more sensors as sensor from one limb is not sufficient to differentiate between all movements. When using the changes in the accelerations from the thigh for the sit-to-stand movement the values can be similar to movements like kneeling-to-stand, so to differentiate between these two movements we need to analyze the results from two or more sensors placed at different locations on the body such as on the ankle. To study the impact of sensor misplacements for differentiating between such similar movements, we need to formulate an effective technique. We will further consider other sensors and their corresponding replica and simulated data such as magnetometers.
Figure 7.
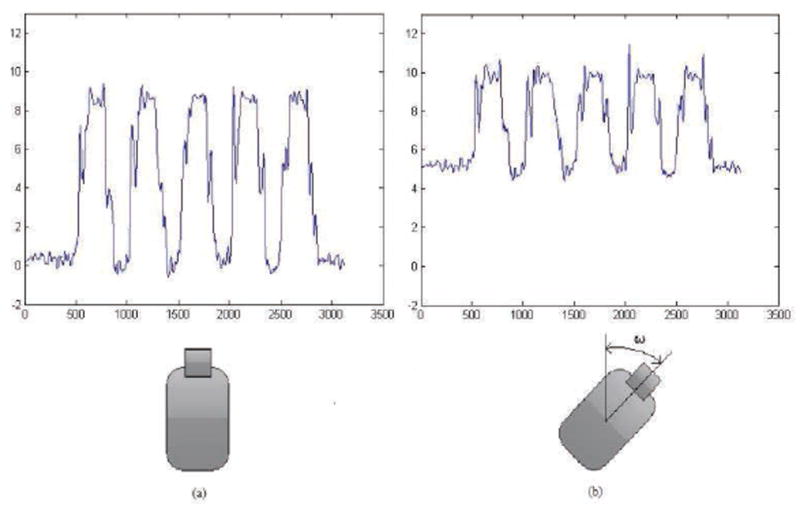
Effect on the accelerations of Z-axis.
Figure 18.
Accuracy against degree of rotation for waist sensor for detection of stand to sit movement
Acknowledgments
This work was supported in part by the National Science Foundation, under grants CNS-1138396, CNS-1150079 and CNS-1012975 and the National Institute of Health, under grant R15AG037971. Any opinions, findings, conclusions, or recommendations expressed in this material are those of the authors and do not necessarily reflect the views of the funding organizations.
Footnotes
Publisher's Disclaimer: Permission to make digital or hard copies of all or part of this work for personal or classroom use is granted without fee provided that copies are not made or distributed for profit or commercial advantage and that copies bear this notice and the full citation on the first page. To copy otherwise, or republish, to post on servers or to redistribute to lists, requires prior specific permission and/or a fee.
References
- 1.Jia Y. Diatetic and exercise therapy against diabetes mellitus. Intelligent Networks and Intelligent Systems, 2009; ICINIS’09. Second International Conference on; IEEE; 2009. pp. 693–696. [Google Scholar]
- 2.Raveendranathan N, Galzarano S, Loseu V, Gravina R, Giannantonio R, Sgroi M, Jafari R, Fortino G. From modeling to implementation of virtual sensors in body sensor networks. Sensors Journal, IEEE. 2012;12(3):583–593. [Google Scholar]
- 3.Zhou M, Wong M. Efficient online subsequence searching in data streams under dynamic time warping distance. Data Engineering, 2008; ICDE 2008. IEEE 24th International Conference on; IEEE; 2008. pp. 686–695. [Google Scholar]
- 4.Smrdel A, Jager F. Automated detection of transient st-segment episodes in 24h electrocardiograms. Medical and Biological Engineering and Computing. 2004;42(3):303–311. doi: 10.1007/BF02344704. [DOI] [PubMed] [Google Scholar]
- 5.Turaga P, Chellappa R, Subrahmanian V, Udrea O. Machine recognition of human activities: A survey. Circuits and Systems for Video Technology, IEEE Transactions on. 2008;18(11):1473–1488. [Google Scholar]
- 6.Lewis J. Fast normalized cross-correlation. Vision interface. 1995;10(1):120–123. [Google Scholar]
- 7.Sakoe H, Chiba S. Dynamic programming algorithm optimization for spoken word recognition. Acoustics, Speech and Signal Processing, IEEE Transactions on. 1978;26(1):43–49. [Google Scholar]
- 8.Muscillo R, Conforto S, Schmid M, Caselli P, D’Alessio T. Classification of motor activities through derivative dynamic time warping applied on accelerometer data. Engineering in Medicine and Biology Society, 2007; EMBS 2007. 29th Annual International Conference of the IEEE; IEEE; 2007. pp. 4930–4933. [DOI] [PubMed] [Google Scholar]
- 9.Myers C, Rabiner L, Rosenberg A. Performance tradeoffs in dynamic time warping algorithms for isolated word recognition. Acoustics, Speech and Signal Processing, IEEE Transactions on. 1980;28(6):623–635. [Google Scholar]
- 10.Rath T, Manmatha R. Word image matching using dynamic time warping. Computer Vision and Pattern Recognition, 2003; Proceedings 2003 IEEE Computer Society Conference on; IEEE; 2003. pp. II–521. [Google Scholar]
- 11.Lukowicz P, Ward J, Junker H, Stäger M, Tröster G, Atrash A, Starner T. Recognizing workshop activity using body worn microphones and accelerometers. Pervasive Computing. 2004:18–32. [Google Scholar]
- 12.Kunze K, Lukowicz P. Dealing with sensor displacement in motion-based onbody activity recognition systems. Proceedings of the 10th international conference on Ubiquitous computing; ACM; 2008. pp. 20–29. [Google Scholar]
- 13.Woolard A. Vicon 512 User Manual. Vicon Motion Systems; Tustin CA: Jan, 1999. [Google Scholar]
- 14.Spong M, Hutchinson S, Vidyasagar M. Robot modeling and control. New York: Wiley; 2006. [Google Scholar]


