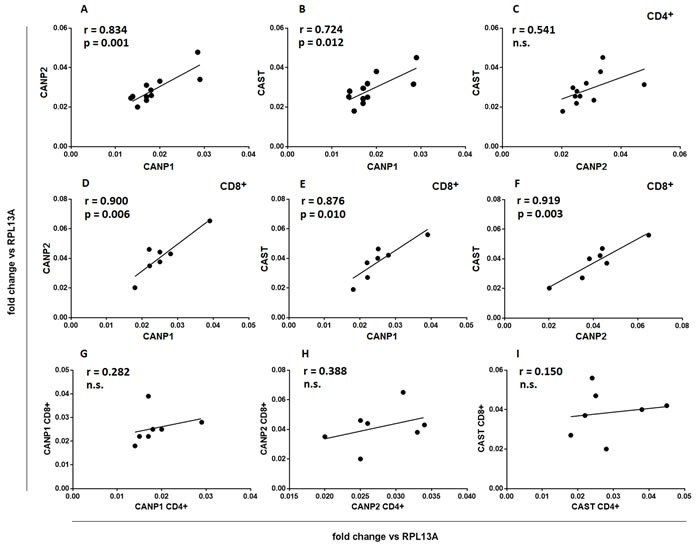
Figure 4. Expression of CCS component genes strongly correlates within, but not between CD4+ and CD8+ lymphocyte populations.

Resting CD4+ a.-c. and CD8+ lymphocytes d.-f. were purified from PBMC by FACS sorting and transcriptional activities of CANP1, CANP2 and CAST genes were quantified against that of constitutively expressed RPL13A gene by real-time PCR as described in Materials and Methods. Each point (•) illustrates coordinated expression of two genes of interest for a single sample. g.-i. - same data as in a.-f., reorganized to show lack of significant correlation between expression of CCS component genes in CD4+ and CD8+ cells of an individual. Pearson's r, regression curves and p values for significant correlations are shown. N.s.- not significant.
