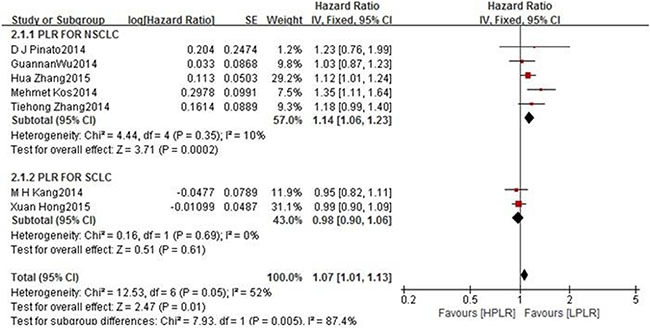
Figure 4. Forest plots of HPLR versus LPLR with OS of all patients in studies and subgroups of patients who are NSCLC or SCLC.

HNLR high neutrophil-to-lymphocyte ratio, LNLR low neutrophil-to-lymphocyte ratio NSCLC non small cell lung cancer, OS overall survival SCLC small cell lung cancer.
