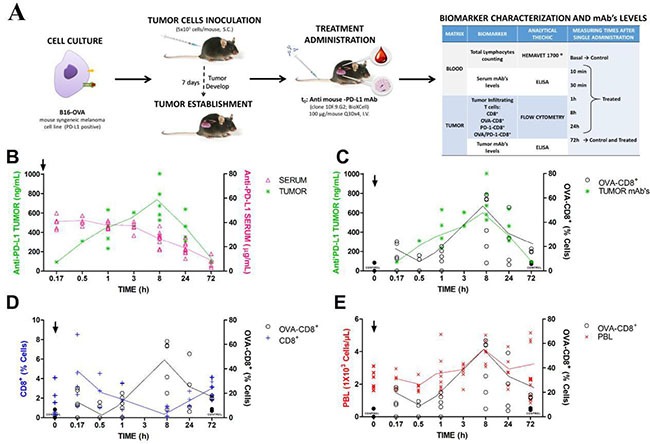
Figure 3. Anti-PD-L1 treatment induces specific biomarkers expression in-vivo.

Observations were individually collected after first mAb dose administration (100 μg/mouse i.v.). (A) experimental design; (B) time profile of mAb concentrations in serum and tumor, respectively; (C) Specific tumor-infiltrating lymphocytes, OVA-CD8+, vs. mAb tumor concentrations throughout 72 h post-dosing; (D) non-specific CD8+ vs. specific, OVA-CD8+ and (E) Individual time profiles of OVA-CD8+ vs. peripheral lymphocytes over 72 h. Symbols represent experimental data, solid lines the mean tendency, arrows dosing time and in panels C, D and E, black circles correspond to control data.
