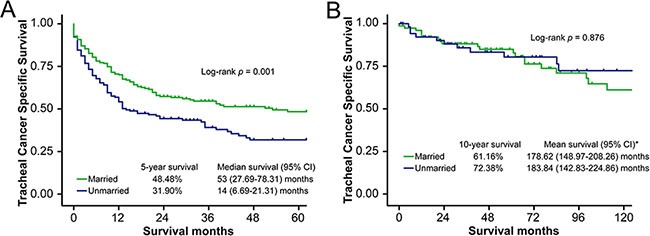
Figure 2. Survival curves in NLGMT and LGMT subgroup patients, married vs. unmarried.

(A) NLGMT subgroup, tracheal cancer specific survival (TCSS): χ2 = 10.60, p = 0.001. (B) LGMT subgroup, tracheal cancer specific survival (TCSS): χ2 = 0.02, p = 0.876. * No “median survival” calculated in LGMT subgroup because event happened in less than 50% patients at the end of follow-up.
