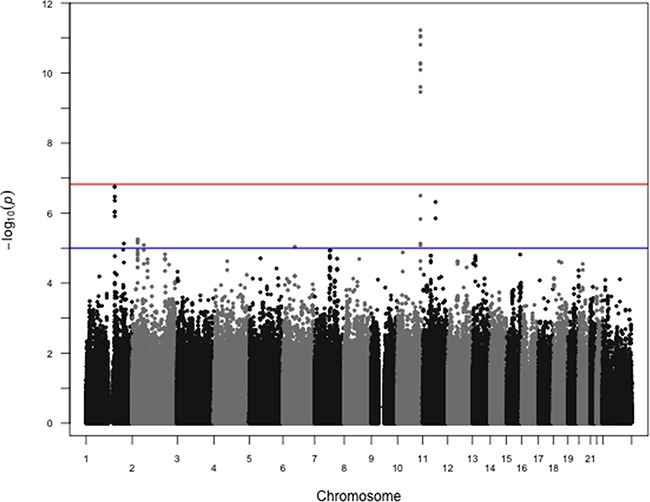
Figure 1. Manhattan plot of associations between SNPs and ER status overall.

P-values from logistic regression comparing estrogen receptor positive cases to estrogen receptor negative cases, controlling for age at diagnosis and first two principal components, are shown. rs3135718 on chromosome 10 at the FGFR2 locus shows the strongest association. 914144 SNPs were included in these analyses, with 6211 ER+ and 2516 ER- cases. The red horizontal line corresponds to the empirical significance threshold of 1.48×10⁻⁷, while the blue horizontal line corresponds to an arbitrary level of 1.0×10⁻⁵. The inflation factor (λ) for these analyses is 1.02.
