
Figure 3. THC alone and THC-CBD combination increase the sub-G1 phase in U266 and RPMI cell lines.
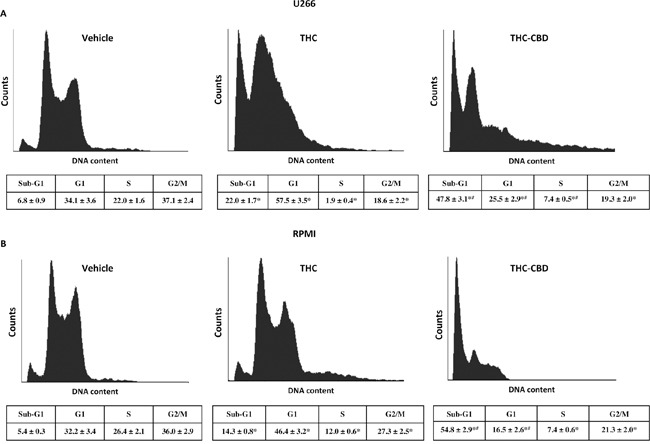
A, B. Cell cycle analysis of U266 and RPMI cell lines treated with THC (12.5 μM) alone or in combination with CBD (12.5 μM). Cell cycle was performed using the PI incorporation assay and FACS analysis, after 48 h post-treatments. Histograms are representative of one of three separate experiments. The values represent the percentage of cells in each phase and are expressed as mean ± SD. *p<0.05 vs vehicle treated cells; #p<0.05 vs THC treated cells.