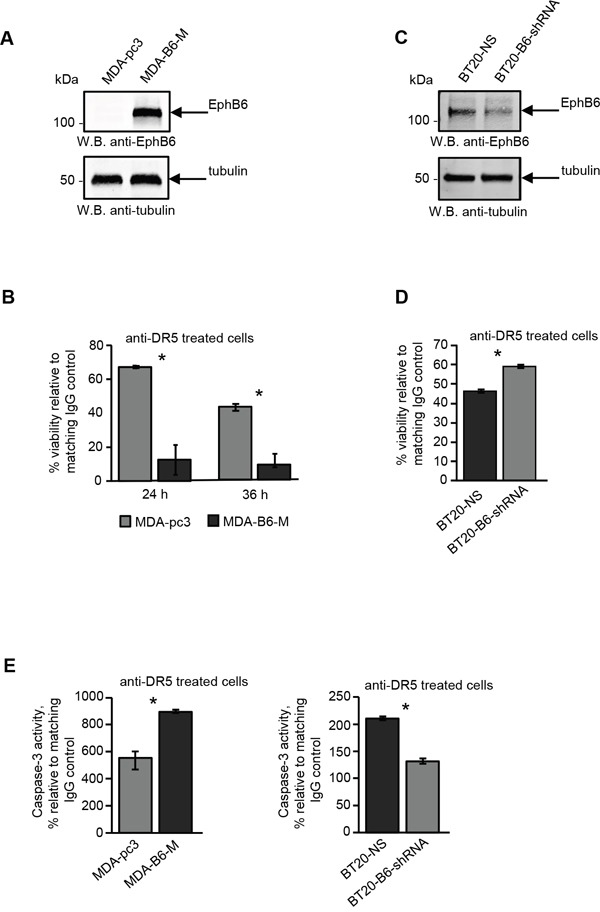
Figure 1. The EPHB6 receptor enhances DR5-induced cell death and CASPASE-3 activation in triple-negative breast cancer cells.

A. Western blot analysis of EPHB6 expression in triple-negative breast cancer (TNBC) cells, MDA-MB-231, stably transfected with the pcDNA3 expression vector encoding myc-tagged EPHB6 (MDA-B6-M) or mock-transfected with the empty vector (MDA-pc3). Western blotting with anti-tubulin was used as a loading control. B. Anti-DR5 activating antibody or matching non-specific IgG (both at 10 μg/mL) were immobilised overnight at 4°C on 96-well plates. MDA-B6-M and MDA-pc3 cells were loaded onto the pre-coated plates (5 × 10⁴ cells/well) in DMEM containing 0.5% FBS, and incubated at 37°C for 24 h or 36 h. To assess cell survival, cells were stained with resazurin and the fluorescence was measured using a SpectraMax M5 plate reader. Each graph represents the analysis of quadruplicates. The graphs present cell viability in DR5-treated cells as percentages relative to matching non-specific IgG controls. C. TNBC cells, BT-20, were transduced with EPHB6-targeting shRNA (BT20-B6-shRNA) or non-silencing shRNA (BT20-NS). EPHB6 expression was analysed by Western blotting as in (A). D. BT20-NS and BT20-B6-shRNA cells were stimulated in 96-well plates (1.5 × 10⁴ cells/well) for 36 h with anti-DR5 pre-immobilised at 20 μg/mL, as in (B). Matching non-specific IgG was used as a control. Cell survival was monitored by the MTT assay. A Spectramax 340PC plate reader was used to measure absorbance. Each graph represents the analysis of five replicates. The graph shows cell survival as a percentage relative to matching IgG controls. E. The indicated cells (1 × 10⁶ cells/well) were incubated in 6-well plates pre-coated with anti-DR5 or matching control IgG (both at 10 μg/mL) for 5 h and CASPASE-3 activity was measured using the EnzChek® CASPASE-3 Assay Kit #1 (Abcam) according to the manufacturer's instructions. Each graph represents the analysis of triplicates. The graphs present CASPASE-3 activity as percentages relative to IgG controls. All experiments were performed at least three times. *, P < 0.05, Student's t-test.
