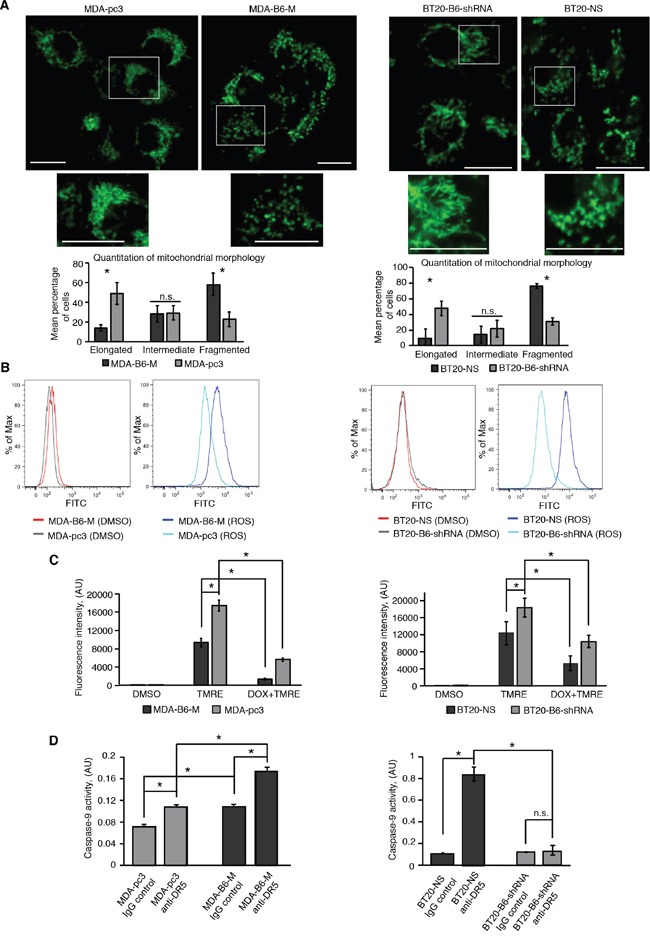
Figure 2. EPHB6 controls mitochondrial behaviour in TNBC cells.

A. To visualise mitochondria, the indicated cells were stained with 70 nM of MitoTracker Green for 20 minutes. Following staining, cells were washed twice with phenol red-free medium and live cell imaging was performed using a LSM 700 confocal microscope equipped with a live cell imaging chamber. Selected areas are shown at higher magnifications. Scale bar, 20 μm. Fluorescence intensity was adjusted using the Fiji software. The ZEN 2012 software was used to quantify mitochondrial morphology in at least 94 cells per experimental condition. Each graph represents the analysis of three independent experiments. B. The indicated cells were incubated with the ROS assay stain (total ROS assay 520 nm kit, affymetrIX eBioscience) or a matching volume of DMSO as a solvent control, and reactive oxygen species production was analysed by flow cytometry. C. To measure mitochondrial membrane potential, cells were incubated with 200 nM TMRE or a matching volume of DMSO for 25 min and fluorescence intensity was quantitated using a SpectraMax M5 plate reader. In addition, some cells were also pre-treated with 80 μM of doxorubicin (DOX) for 24 h to confirm the specificity of the TMRE staining, as DOX is expected to induce a strong intrinsic apoptotic response, causing a drop in mitochondrial membrane potential. Each graph represents the analysis of at least triplicates. D. Cells were treated with anti-DR5 or control IgG for 5 h, as in Figure 1E and CASPASE-9 activity was measured using the Colorimetric CASPASE-9 assay kit (Abcam) according to the manufacturer's instructions. A SpectraMax 340PC plate reader was used to quantitate CASPASE-9 activity. Each graph represents the analysis of triplicates. All experiments were performed at least three times. * p<0.05, Student's t-test. n.s., statistically not significant.
