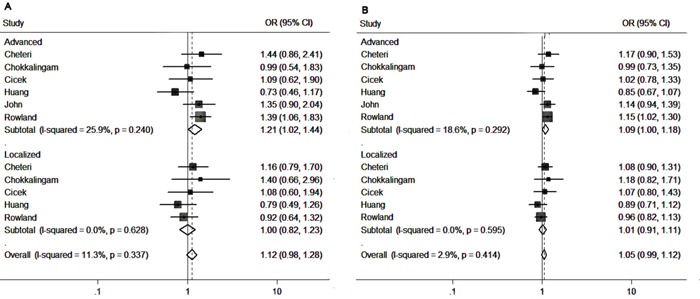
Figure 4. Forest plots to estimate the association of VDR Fok I polymorphism with PCa in the subgroup analysis of tumor stage.

A. Homozygote model (ff vs. FF). B. Allelic frequency model (f vs. F allele).

A. Homozygote model (ff vs. FF). B. Allelic frequency model (f vs. F allele).