Abstract
Intracerebral hemorrhage (ICH) is a devastating form of stroke with high morbidity and mortality. Heme oxygenase-1 (HO-1), the key enzyme in heme degradation, is highly expressed after ICH, but its role is still unclear. In this study, we used an HO-1 inducer and inhibitor to test the role of HO-1 in different stages of ICH in vivo and in vitro. In the early stage of ICH, high HO-1 expression worsened the outcomes of mice subjected to the collagenase-induced ICH model. HO-1 increased brain edema, white matter damage, neuronal death, and neurobehavioral deficits. Furthermore, elevated HO-1 increased inflammation, oxidative stress, matrix metalloproteinase-9/2 activity, and iron deposition. In the later stage of ICH, long-term induction of HO-1 increased hematoma absorption, angiogenesis, and recovery of neurologic function. We conclude that HO-1 activation mediates early brain damage after ICH but promotes neurologic function recovery in the later stage of ICH.
Keywords: Inflammation, angiogenesis, intracerebral hemorrhage, matrix proteins, microglia
Introduction
Intracerebral hemorrhage (ICH) is a devastating type of stroke with high morbidity and mortality. Studies have shown that hemin, the oxidized form of heme, is highly toxic to brain tissue.1–3 Free hemin can induce an inflammatory reaction and disturb the blood–brain barrier (BBB).1,4,5 Because hemin cannot be recycled in the central nervous system (CNS), increasing hemin metabolism may be an effective strategy for improving hematoma clearance.6,7
Heme oxygenase (HO) is the key enzyme in heme metabolism. Two HO isoenzymes are present in mammalian cells: HO-1, the inducible isoform, and HO-2, the constitutive isoform. The HO-1 isoform is expressed mainly in vascular-like structures but at very low levels in normal CNS,8–10 and it can be rapidly induced after acute brain injury.11 HO-1 is strongly induced after cerebral ischemia and is thought to play a neuroprotective role; indeed, overexpression of HO-1 in transgenic mice is protective against permanent middle cerebral artery occlusion.12 Furthermore, pharmacologic treatments that exert neuroprotective and antioxidative effects against ischemic damage are associated with increased HO-1 expression.13–15 However, the role of HO-1 after ICH is controversial. Some studies have reported that overexpression of HO-1 in astrocytes improves outcomes after ICH,16 whereas others have shown that inhibiting HO reduces brain injury in the autologous blood-induced ICH model.17,18 We also have shown that HO-1 deletion improves ICH outcomes.9 Hence, the role and underlying mechanisms of HO-1 after ICH are still unclear. In this study, we used HO-1 inducer cobalt protoporphyrin IX (CoPP) and inhibitor zinc protoporphyrin IX (ZnPP) to investigate the exact role of HO-1 during the early and late stages of collagenase induced mice ICH model.
Materials and methods
Animals
All animal experiments were approved by Institutional Animal Care and Use Committee of Harbin Medical University, Harbin, China, and followed national guidelines of the regulation for the administration of affairs concerning experimental animals of China enacted in 1988. Twelve-month-old C57BL/6 mice (male, 22–27 g) were used in this study. Mice were housed in individual cage under standard laboratory conditions. All efforts were made to minimize suffering and numbers of animals used.
All sections of the manuscript were reported in accordance with ARRIVE (Animal Research: Reporting in Vivo Experiments) guidelines.
ICH models
We used collagenase to construct the ICH model. We injected collagenase VII-S (0.075 U in 500 nL saline, Sigma, St. Louis, MO) at the following stereotactic coordinates: 0.8 mm anterior and 2.2 mm lateral of the bregma, 3.0 mm in depth.19 Rectal temperature of the animals was maintained at 37.0 ± 0.5℃ throughout the experimental and recovery periods.
Experimental groups
Mice were randomly divided into four groups: sham-operated group (n = 8), vehicle-treated ICH group (n = 68), CoPP-pretreated ICH group (n = 68), and ZnPP-post-treated ICH group (n = 68). CoPP and ZnPP (Sigma) were dissolved in 0.2 M NaOH, adjusted to a pH of 7.4, and diluted in saline to stock solutions of 1 mg/mL. CoPP was administered by intraperitoneal injection at 5 mg/kg 24 h before collagenase injection and then once daily for 1, 3, or 7 days.20,21 ZnPP injections22 were administered by intraperitoneal injection at 5 mg/kg 2 h after collagenase injection and then once daily for 1, 3, or 7 days. Sham groups had needle insertion only. The vehicle-treated groups received an intraperitoneal injection of saline once daily for 1, 3, or 7 days after ICH induction.
Tissue processing and histology
Based on our previous protocol of brain tissue processing and histology, we collected three similar brain sections from each mouse to quantify neuronal death and iron deposition.19 We used Fluoro-Jade B (FJB) to detect neuronal death19,23 and Perls staining to evaluate ferric iron deposition.24 We selected 12 locations per mouse (4 fields per section, 3 sections per mouse) to average FJB- or Perls-positive cells per mm2 (n = 8 mice/group). All brain sections were analyzed by an investigator blinded to treatment group.
Brain lesion and hematoma volume
On days 1, 3, 7, 14, and 28 after collagenase-induced ICH, mice were euthanized for assessment of brain lesion and hematoma volume. Each mouse brain was cut with a cryostat into 50 -µm coronal sections. Then the brain sections were stained with Luxol fast blue/Cresyl violet. The brain lesion and hematoma volume were detected by Scan Pro software (LEICA SCN 400, Wetlzar, Germany) and were calculated as described in our previous study (n = 8 mice/group).19,25
Brain water content
Brain edema was determined on day 3 (n = 5 mice/group). It was calculated as: (wet weight − dry weight) / wet weight of brain tissue × 100%.
Spectrophotometric assay for brain tissue hemoglobin
The hemoglobin content in the striatal tissue of brains was detected by Drabkin’s reagent (Sigma) after collagenase-induced ICH (n = 5 mice/group), as we have previously described.19
In situ detection of reactive oxygen species (ROS)
We evaluated ROS after ICH by in situ detection of oxidized hydroethidine.26,27 Hydroethidine (Molecular Probes, Eugene, OR) was dissolved in dimethyl sulfoxide (DMSO) and then diluted in phosphate-buffered saline to an end concentration of 1 mg/mL. We injected 300 µL of the hydroethidine intraperitoneally into experimental mice on day 3 after ICH, 2 h before the brains were harvested. Fluorescence intensity of brain sections was determined in predefined areas of the hemorrhagic striatum (n = 8 mice/group), as we have described previously.19 An investigator blinded to experimental group analyzed the sections using Image J software.
Immunofluorescence
Immunofluorescence was carried out as described previously.19,23,28 The primary antibodies used were mouse monoclonal anti-HO-1 (1:1000, Stressgen, Victoria, BC, Canada); rabbit anti-Iba1 (1:500; Abcam, Cambridge, UK); rat anti-glial fibrillary acidic protein (GFAP, 1:500; Abcam); rabbit anti-myeloperoxidase (MPO, 1:100; Abcam); rabbit anti-degraded myelin basic protein (dMBP, 1:2000; Millipore); rabbit anti-amyloid precursor protein (APP, 1:200; Sigma); rabbit anti-CD34 (1:250; Abcam); mouse monoclonal anti-CD105 (1:200; Abcam), and rabbit anti-NeuN (1:1000; Millipore). We selected 12 locations per mouse (4 fields per section × 3 sections per mouse) to count and average the positive cells (n = 8 mice/group). An investigator blinded to experimental group analyzed the sections using Image J software.
Permeability of BBB
BBB permeability was determined by Evans blue (EB) extravasation on 3d after ICH (n = 5 mice/group), as we have previously described.29
Western blot analysis
Western blot analysis was carried out as in our previous study (n = 5 mice/group).25,29 The primary antibodies used were mouse monoclonal anti-HO-1 (1:1000; Stressgen), rabbit anti-ZO-1 (1:200; Abcam), rabbit anti-occludin (1:500; Abcam), rabbit anti-MMP-3 (1:500; Abcam), and mouse monoclonal anti-β-actin (1: 3000; Abcam).
Gelatin gel zymography
Gelatin gel zymography protocols were carried out as previously described.23,30 Protein samples were extracted from ipsilateral brain containing the striatum at 72 h after the collagenase-induced ICH model (n = 5 mice/group). Purified brain samples (5 µL containing 500 µg of protein) were tested. Areas of protease activity (pro-MMP-9 (98 kDa) and pro-MMP-2 (72 kDa)) appeared as clear bands against a dark blue background. Bands were visualized with a gel-imaging system (iBox Scientia 500/600, Upland, CA), and band intensity was quantified with Image J analysis software.
Magnetic resonance imaging (MRI)
MRI was performed with the same mice at 1, 3, 7, 14, and 28 days after induction of ICH in a 3.0-T MR imaging system (Philips Achiva, Holland) with a mouse brain surface coil. T1-weighted images were used to detect the hematoma. We calculated the hematoma volume (in mm3) by integrating the lesion area in each section image over the section depth (n = 5 mice/group).
Neurologic deficit
Neurologic deficits of the mice were assessed on days 1, 3, 7, 14, and 28 after collagenase-induced ICH (n = 8 mice/group). Six neurologic tests, including body symmetry, gait, climbing, circling behavior, front limb symmetry, and compulsory circling, were assessed by an investigator blinded to treatment group.9 Each test was graded from 0 to 4, and the maximum deficit score was 24.
Cell culture and treatment
The murine microglial cell line BV2 was obtained from Peking Union Medical College (Beijing, China). The cells were authenticated, cultured in Dulbecco’s Modified Eagle Medium and nutrient mixture F12 (DMEM/F12) supplemented with 10% fetal bovine serum (Thermo Scientific Hyclone, Logan, UT), 2 mM glutamine, 100 U/mL penicillin, and 100 mg/mL streptomycin, and incubated at 37℃ in a 5% CO2 humidified atmosphere. The cells were exposed to hemin (10 µM), hemin (10 µM) + CoPP (20 µM), or hemin (10 µM) + ZnPP (20 µM) for 24 h. Cell proteins were extracted and stored at − 80℃ for later measurement of superoxide dismutase (SOD) and malondialdehyde (MDA). SOD activity and MDA content were measured with a kit (purchased from Nanjing Institute of Biomedical Engineering) according to the manufacturer's instructions.
Statistics
All data are shown as mean ± standard deviation. Differences between two groups were compared by two-tailed Student’s t test. The statistical comparisons among multiple groups were made by one-way ANOVA followed by Bonferroni correction. Statistical significance was set at p < 0.05.
Results
HO-1 is expressed in microglia, vascular endothelial cells, and neurons
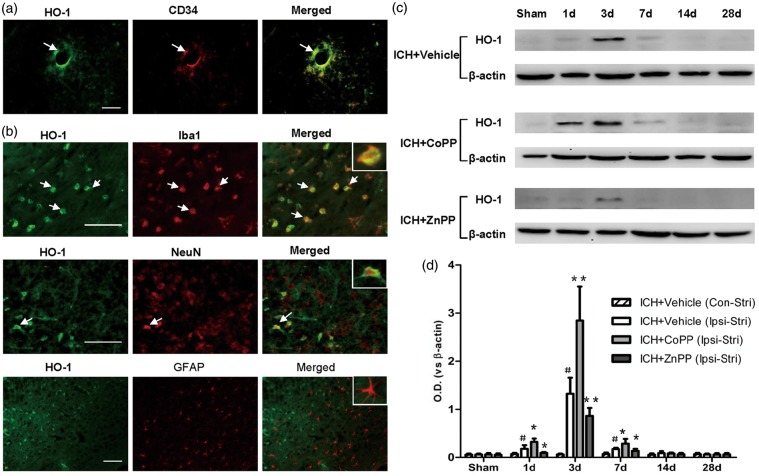
To clarify the expression of HO-1 in cell types, we used double-immunostaining. In normal mouse brain, HO-1 was expressed mainly in vascular endothelial cells (Figure 1a). The results of double-immunostaining showed that HO-1-positive cells around the hematoma were associated mostly with microglia and, to a lesser extent, with neurons (Figure 1b). We observed no co-localization in astrocytes (Figure 1b).
Figure 1.
Identification and expression of HO-1. (a) HO-1 expression in normal brain tissue. Scale bars = 50 µm, n = 3 mice/group. (b) Identification of HO-1 in the perihematomal region on day 3 after collagenase-induced ICH. Scale bars = 50 µm, n = 5 mice/group. Arrows indicate cells with colocalization. Insets represent higher magnification of cells with colocalization. (c) HO-1 protein level in ipsilateral brain after collagenase-induced ICH. (d) Quantification of HO-1 protein level after collagenase-induced ICH. Ipsi-Stri, ipsilateral striatum; Con-Stri, contralateral striatum. n = 5 mice/group. Values are mean ± SD. #p < 0.01 vs. sham group; *p < 0.05, **p < 0.01 vs. vehicle group.
Expression of HO-1 increases after pretreatment with CoPP and decreases after post-treatment with ZnPP
We wanted to ascertain whether HO-1 inducer CoPP or inhibitor ZnPP affects the expression of HO-1 after ICH. Temporal changes of HO-1 expression were detected in mouse brain after collagenase-induced ICH. Compared with that of the sham group, expression of HO-1 protein increased significantly in ipsilateral striatum on day 1 after collagenase-induced ICH (p < 0.01), reached a peak on day 3, and decreased on day 7 (p < 0.01). The expression of HO-1 was no different than that of the sham group in ipsilateral striatum on days 14 and 28 after ICH (n = 5 mice/group; Figure 1c, d). Additionally, no significant differences were detected between the sham group and ICH groups in contralateral striatum (n = 5 mice/group, p > 0.5; Figure 1d). CoPP pretreatment increased HO-1 expression in ipsilateral striatum on days 1, 3, and 7 after ICH, whereas, ZnPP post-treatment inhibited HO-1 expression on those days (n = 5 mice/group, p < 0.05; Figure 1c, d).
Effect of HO-1 on neurologic deficits
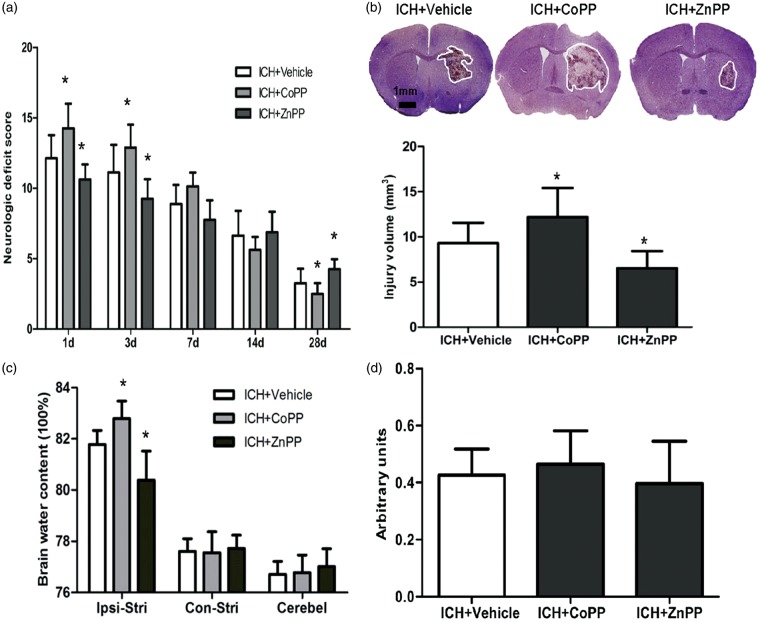
CoPP pretreatment increased neurologic deficits, whereas ZnPP post-treatment decreased neurologic deficits on days 1 and 3 after collagenase-induced ICH compared with neurologic function in the respective vehicle-treated groups (p < 0.05; Figure 2a). In the later stage of ICH, CoPP improved neurologic function of mice on day 28, whereas ZnPP increased neurologic deficits compared with that of the vehicle-treated groups (n = 8 mice/group, p < 0.05; Figure 2a). Thus, HO-1 decreased neurologic deficits in the early stage (1–3 days) but improved neurologic function in the later stage (28 days) after ICH.
Figure 2.
Effect of HO-1 on neurologic deficits, brain injury volume, and brain edema. (a) Neurologic deficits of mice after collagenase-induced ICH; n = 8 mice/group. (b) Brain injury volume on day 3 after collagenase-induced ICH; n = 8 mice/group. (c) Brain water content of mice on day 3 after collagenase-induced ICH. Ipsi-Stri, ipsilateral striatum; Con-Stri, contralateral striatum; Cerebel, cerebellum. (d) Hemoglobin content in ipsilateral striatal tissue of brains was determined by Drabkin’s reagent on day 1 day after ICH. n = 5 mice/group. *p < 0.05 vs. vehicle group. Values are means ± SD.
HO-1 increases brain injury volume and brain edema after ICH
Luxol fast blue and Cresyl violet staining showed that brain injury volume was larger in the CoPP pretreatment group than in the vehicle group after collagenase-induced ICH (n = 8 mice/group, p < 0.05; Figure 2b). ZnPP post-treatment decreased brain injury volume (n = 8 mice/group, p < 0.05; Figure 2b). Furthermore, brain edema in ipsilateral striatum was significantly increased by CoPP pretreatment and decreased by ZnPP post-treatment compared with that in the vehicle-treated group. However, neither drug altered edema in the contralateral striatum or in the cerebellum (n = 5 mice/group, p < 0.05; Figure 2c).
To ascertain whether the observed differences in brain outcome were due to differences in bleeding volume, we further measured hemoglobin content in the ipsilateral striatum at 24 h after collagenase injection. When hematoma reached its maximum in this model, as in our previous study,19 we observed no significant difference in hemoglobin between the CoPP- or ZnPP-treated group and the vehicle-treated group (n = 5 mice/group, p > 0.05; Figure 2d).
Effect of HO-1 on permeability of the BBB
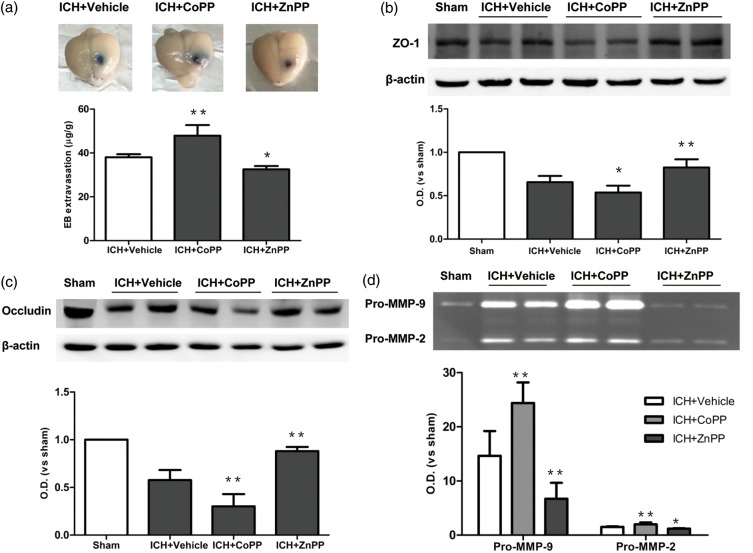
We evaluated permeability of the BBB by EB extravasation. Extravasation of EB was significantly greater in the CoPP-pretreated group than in the vehicle group after collagenase-induced ICH (n = 5 mice/group, p < 0.01; Figure 3a). In contrast, ZnPP post-treatment decreased extravasation of EB (n = 5 mice/group, p < 0.05; Figure 3a). To examine the structural basis for the formation of edema, we examined the expression of tight junction proteins after CoPP and ZnPP administration. Expression of both ZO-1 (p < 0.05; Figure 3b) and occludin (p < 0.01; Figure 3c) was lower in CoPP-pretreated mice than in vehicle-treated mice on day 3 after ICH (n = 5 mice/group). In contrast, both proteins showed an increase in expression after ZnPP treatment (n = 5 mice/group, p < 0.01; Figure 3b, c).
Figure 3.
Effect of HO-1 on blood–brain barrier after collagenase-induced ICH. (a) Evans blue (EB) extravasation on day 3 after ICH. (b, c) Western blot analysis of tight junction proteins ZO-1 (b) and occludin (c) on day 3 after collagenase-induced ICH. (d) Gelatin gel zymography analysis shows activation of matrix metalloproteinase (MMP)-9 and MMP-2 on day 3 after ICH. n = 5 mice/group, *p < 0.05, **p < 0.01 vs. vehicle group. Values are means ± SD.
MMP-9 and MMP-2 activity also contribute to BBB disruption and brain edema after ICH, and MMP-3 is known to be closely linked to hemorrhagic transformations. We examined MMP-9 and MMP-2 gelatinolytic activity in brain tissue by gelatin gel zymography on day 3 after ICH and assessed MMP-3 expression by Western blot. We found that CoPP pretreatment promoted activation of both pro-MMP-9 and pro-MMP-2 (p < 0.01), whereas ZnPP post-treatment inhibited activation of pro-MMP-9 (p < 0.01) and pro-MMP-2 (p < 0.05) compared with that in the vehicle group (n = 5 mice/group; Figure 3d). MMP-3 expression was strongly induced after ICH (p < 0.01), but it did not differ significantly among the groups treated with CoPP, ZnPP, and vehicle (p > 0.05, n = 5 mice/group; Supplementary Figure 1).
Effect of HO-1 on neuroinflammation
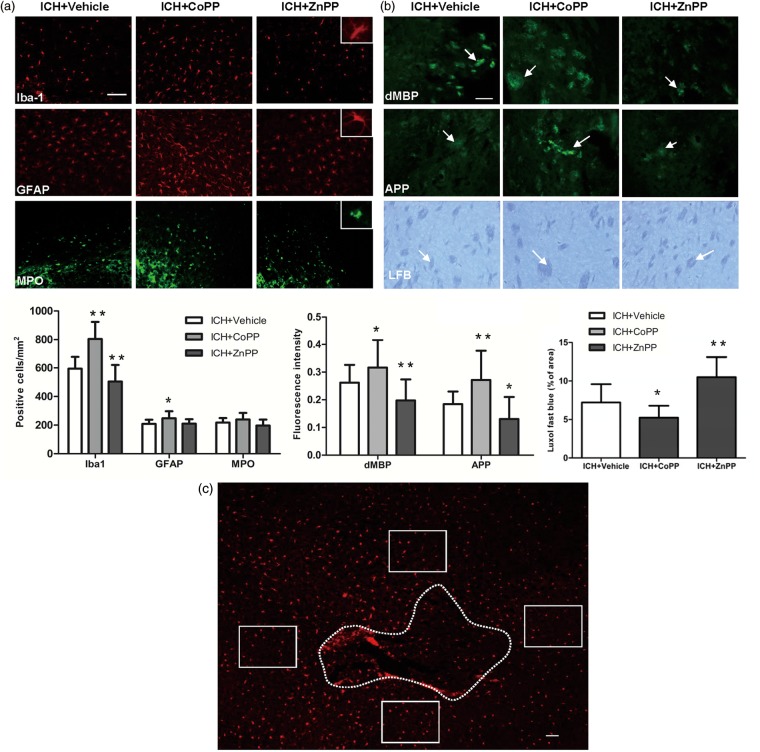
Microglia are critical immune cells in the CNS that respond to and repair injury.31–34 In this study, we found that on day 3 after ICH, the number of activated microglia/macrophages in the perihematoma area was increased in the CoPP-treated group but decreased in the ZnPP-treated group (n = 8 mice/group, p < 0.01; Figure 4a).
Figure 4.
Effect of HO-1 on inflammation and white matter injury. (a) The expression of Iba1-, glial fibrillary acidic protein (GFAP)-, and myeloperoxidase (MPO)-immunoreactive cells around the injury site on day 3 after collagenase-induced ICH; n = 8 mice/group. The bar graph shows quantification analysis. (b) Immunofluorescent and Luxol fast blue (LFB) staining showing the expression of degraded myelin basic protein (dMBP), amyloid precursor protein (APP), and normal myelin (LFB) in the perihematoma region on day 3 after ICH. Arrows indicate damaged myelin, damaged axons, and normal myelin. The bar graphs show quantification analysis. n = 8 mice/group. *p < 0.05, **p < 0.01 vs. vehicle group. Values are means ± SD. Scale bar = 50 µm. (c) Diagram showing regions of analysis (labeled by Iba1). Dotted line indicates the hematoma. The rectangular boxes indicate the areas from which the images in a and b were taken at the periphery of the hematoma. Scale bar = 50 µm.
Reactive astrocytes are recognized to be important in both the initiation and propagation of secondary ischemic brain injury.35 Our results showed that reactive astrocytes were increased by CoPP on day 3 after ICH (p < 0.05; Figure 4a) but unchanged by ZnPP (n = 8 mice/group, p > 0.05; Figure 4a).
During ICH, neutrophils infiltrate the hematoma after microglial/macrophage activation and, as inflammatory factors, contribute to early hemorrhagic brain injury.33,36 In our study, MPO-immunoreactive neutrophils were evident in the hemorrhagic striatum on day 3 after ICH in the vehicle-treated group (Figure 4a), but the number was unchanged by CoPP or ZnPP treatment (n = 8 mice/group, p > 0.05; Figure 4a).
White matter injury is increased by CoPP and decreased by ZnPP after ICH
Mouse brain exhibits marked white matter injury after ICH. As in our previous study,19 we used dMBP, APP, and Luxol fast blue to label degraded myelin, damaged axons, and normal myelin, respectively, in brain sections on day 3 after collagenase-induced ICH. Compared with levels in the vehicle group, CoPP pretreatment increased demyelination and axon loss, but decreased normal myelin in the striatum. Conversely, ZnPP post-treatment decreased demyelination and axon loss, but increased normal myelin (n = 8 mice/group, p < 0.05; Figure 4b).
Effect of HO-1 on oxidative damage
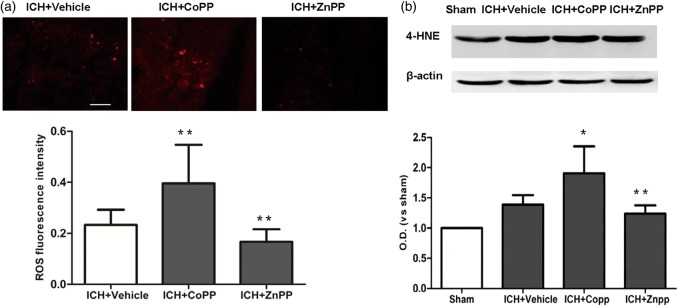
ROS cause neuronal death in the surrounding brain tissue and play a major role in the various mechanisms of ICH-induced brain injury.36,37 We used the fluorescent indicator hydroethidine to examine superoxide production. We also assessed lipid oxidative products by measuring the expression of 4-HNE, a marker of lipid oxidative products.38 CoPP pretreatment increased superoxide production and the level of 4-HNE proteins in the collagenase-induced ICH brain (n = 8 mice/group, p < 0.01; Figure 5a, b). However ZnPP post-treatment decreased superoxide production (p < 0.05, Figure 5a) and the level of 4-HNE proteins after ICH (n = 8 mice/group, p < 0.01; Figure 5b).
Figure 5.
Effect of HO-1 on oxidative damage. (a) Reactive oxygen species (ROS) signal fluorescence intensity in the perihematomal region on day 3 after collagenase-induced ICH. n = 8 mice/group. (b) The expression of 4-HNE in the perihematomal region on day 3 after collagenase-induced ICH. n = 5 mice/group. *p < 0.05, **p < 0.01 vs. vehicle group. Values are means ± SD. Scale bar = 50 µm.
HO-1 increases neuronal cell death and iron deposits after ICH
As in our previous study, we used FJB staining to examine neuronal cell death.19 In the vehicle group, FJB-positive cells were evident in the perihematomal region on day 3 after collagenase-induced ICH. The number of FJB-positive cells was significantly increased by CoPP and decreased by ZnPP compared with that in the vehicle group (n = 8 mice/group, p < 0.01; Supplementary Figure 2a). Thus HO-1 appears to increase neuronal cell death on day 3 after ICH.
Degradation of hemin produces iron, which can also cause brain injury via many pathways, such as lipid peroxidation and free radical formation. Therefore, we used Perls staining to examine iron deposition after collagenase-induced ICH.19 Perls-positive amoeboid cells were present in the peri-ICH region of the vehicle group on day 3 after ICH. CoPP pretreatment increased, whereas ZnPP decreased, the number of Perls-positive cells around the hematoma compared with that in the vehicle group (n = 8 mice/group, p < 0.01; Supplementary Figure 2b).
Effect of HO-1 on hematoma clearance after ICH
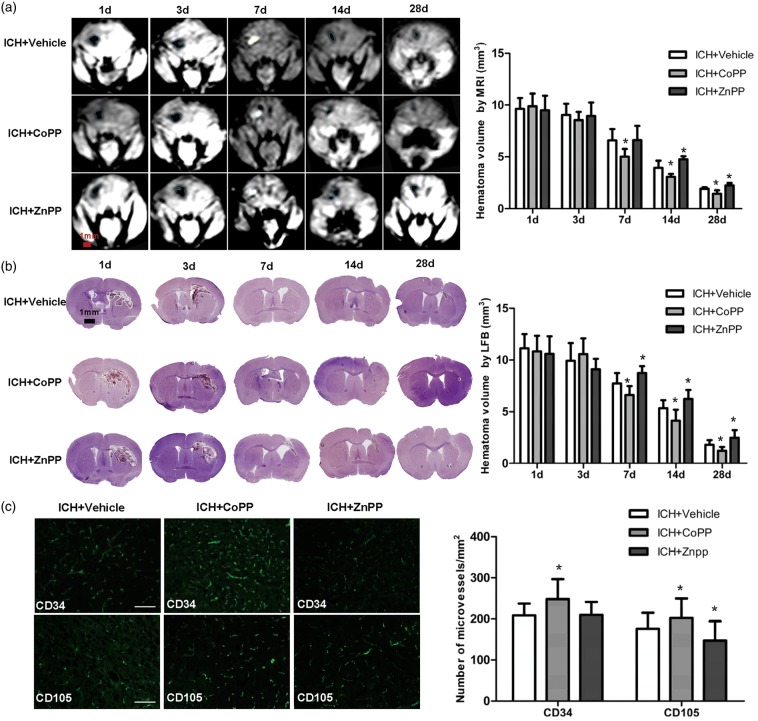
Hematoma clearance was assessed by T1-weighted MRI and Luxol fast blue/Cresyl violet. As shown in Figure 6(a), hematoma exhibited a low signal on days 1 and 3 after collagenase-induced ICH but a high signal on day 7 in T1-weighted images. Residual hematoma with a low-signal was also visible on days 14 and 28 after ICH. CoPP decreased hematoma volume on days 7, 14, and 28 after ICH, whereas ZnPP increased hematoma volume on days 14 and 28 compared with that in the vehicle group (n = 5 mice/group, p < 0.05; Figure 6a). We also used Luxol fast blue/Cresyl violet staining to confirm our MRI findings. Hematoma volume decreased in the CoPP group, but increased in the ZnPP group compared with that in the vehicle group on days 7, 14, and 28 after ICH (n = 8 mice/group, p < 0.05; Figure 6b). These results indicate that HO-1 improves hematoma clearance at later stages of ICH (7, 14, and 28 days).
Figure 6.
Effect of HO-1 on hematoma clearance and angiogenesis. (a) Hematoma volume was assessed by MRI. Hematoma was detected in T1-weighted images as a low signal on days 1 and 3 after ICH and then as a high signal on day 7. Residual hematoma was observed as a low signal on days 14 and 28 after ICH. n = 5 mice/group. *p < 0.05 vs. vehicle group. Values are means ± SD, scale bar = 1 mm. (b) Hematoma volume was assessed by Luxol fast blue/Cresyl violet staining. LFB indicates Luxol fast blue/Cresyl violet. n = 8 mice/group, *p < 0.05 vs. vehicle group. Values are means ± SD, scale bar = 1 mm. (c) Vascular destiny was detected by immunofluorescence with anti-CD34 and anti-CD105 antibodies at 28 days after ICH. n = 8 mice/group; scale bar = 50 µm. *p < 0.05 vs. vehicle group. Values are means ± SD.
HO-1 promotes vascular angiogenesis on day 28 after ICH
To detect angiogenesis after ICH in the mouse brain, we used immunofluorescent anti-CD34 to label microvessels at 28 days after collagenase injection. Additionally, we used anti-CD105 (endoglin), a marker of angiogenesis that is expressed mainly on proliferating endothelial cells.39,40 We found that both the number of CD34-positive microvessels and the number of CD105-positive microvessels in the perihematoma region were increased by CoPP pretreatment (p < 0.05) but only CD34-positive microvessels were unchanged by ZnPP post-treatment (p > 0.05) compared with that in the vehicle-treated group (n = 8 mice/group; Figure 6c).
CoPP increases HO-1 expression, and ZnPP decreases HO-1 expression in hemin-treated BV2 microglia
The purity of the cultured BV2 microglia was confirmed by immunofluorescence with anti-Iba1 antibody (Supplementary Figure 3a). Exposure of microglia to hemin for 24 h led to an increase in HO-1 protein expression. Treatment of hemin-exposed cells with CoPP (24 h) caused an additional increase in HO-1 expression, whereas ZnPP treatment (24 h) inhibited hemin-mediated HO-1 expression (p < 0.01; Supplementary Figure 3b–d).
Effect of HO-1 on oxidative damage in vitro
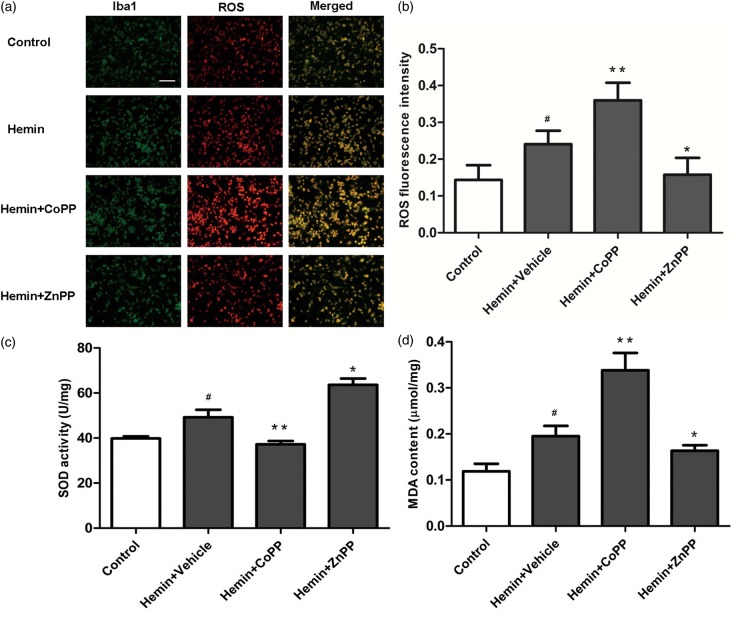
To ascertain whether HO-1 activation increases microglial oxidation, we used hydroethidine to detect ROS production. We also assessed oxidation by measuring MDA content and anti-oxidation by measuring SOD activity. ROS, SOD activity, and MDA content were elevated in hemin-exposed microglia. CoPP increased ROS and MDA content and inhibited SOD activity compared with that in the hemin group. However, ZnPP decreased ROS and MDA content and increased SOD activity in the hemin-exposed microglia (p < 0.01; Figure 7a–d).
Figure 7.
Effect of HO-1 induction and inhibition on reactive oxygen species (ROS) production, superoxide dismutase (SOD) activity, and malondialdehyde (MDA) content in hemin-exposed BV2 microglia. (a, b) ROS production in BV2 microglia. The Bv2 microglia were labeled by anti-Iba1 antibody (green), and ROS production was detected by dihydroethidine (red). Values are means ± SD. #p < 0.05 vs. control group; *p < 0.05, **p < 0.01 vs. vehicle group. Scale bar = 50 µm. (c, d) SOD activity and MDA content in BV2 microglia after hemin exposure. Values are means ± SD. #p < 0.05 vs. control group; *p < 0.05, **p < 0.01 vs. vehicle group.
Discussion
HO-1 is expressed at a very low level in normal brain but can be rapidly induced after ICH. However, whether it exerts a beneficial or detrimental effect is still unclear. In this study, we used both an HO-1 inducer and an HO-1 inhibitor to study the exact effect of HO-1 throughout the course of ICH. We found that HO-1 exacerbated brain injury in the early stage of ICH but promoted hematoma absorption and neurologic function recovery in the later stage of ICH.
After ICH, the accumulation of blood can cause substantial brain damage and brain edema. We found that inducing HO-1 expression with CoPP increased brain injury volume, neurologic deficit, neuronal death, and brain edema in the early stage of ICH. Inhibiting HO-1 with ZnPP had the opposite effect. These results suggest that high expression of HO-1 contributes to brain damage early after ICH. To uncover the underlying mechanisms of HO-1-mediated brain damage, we assessed BBB disruption, which is an important contributor to brain edema formation.33 We found that in the early stage of ICH, overexpression of HO-1 increased EB extravasation and reduced the expression of tight junction proteins (ZO-1 and occludin), which form the structural basis of the BBB. Overexpression of HO-1 also promoted activation of MMP-9 and MMP-2, which have been implicated in BBB disruption and increased brain edema.41,42 Thus, our results indicate that HO-1 increases brain edema in the early stage of ICH, likely by decreasing tight junction proteins and promoting MMP-9 and MMP-2 activation, which together increase BBB permeability.
Inflammatory cells are critical players in brain injury and mediators of secondary damage after ICH.33,35,36 On days 1–5 after ICH in mice, inflammation in the brain is significantly elevated.43 Microglia are the first immune cells to react to brain injury. They can be detected within 1 h after ICH and then reach a peak at 3–7 days.35 The major role of microglia is to phagocytize the hematoma. In this process, the activated microglia produce a variety of deleterious cytokines, such as pro-inflammatory factors, chemokines, proteases, nitric oxide synthase, and prostaglandins, which increase brain damage after ICH.35,36 We found that overexpression of HO-1 after ICH occurred mainly in microglia. HO-1 can increase the number of activated microglia and aggravate brain damage in the early stage after ICH. Interestingly, heme pretreatment to increase HO-1 expression in perivascular cells or selective HO-1 overexpression in astrocytes improves outcomes after ICH.16,44 These data suggest that the different expression patterns of HO-1 may play different roles after ICH. The high expression of HO-1 in microglia may increase brain damage in the early stage after ICH. White matter injury is associated with a higher risk of death and poor functional outcome in stroke patients,45 and was identified as a priority for both basic and clinical ICH research.46 Therefore, we used Luxol fast blue, dMBP, and APP to assess white matter injury in mice after ICH. We found high HO-1 expression increased white matter damage. Thus, the increase in neurologic dysfunction that we observed with elevated expression of HO-1 may be attributable in part to increased white matter damage.
Microglial activation also produces ROS, and accumulating evidence indicates that ROS are important contributors to brain outcomes after ICH.46,47 We observed that HO-1-induced microglial activation was associated with ROS production and oxidative brain damage after ICH. To confirm our in vivo finding, we studied the effect of HO-1 on oxidation of BV2 microglia in vitro. Overexpression of HO-1 increased microglial activation and promoted oxidative stress in the early stage after ICH. Iron is one product of heme degradation, and iron overload can cause brain injury via many pathways, such as lipid peroxidation and free radical formation. After ICH, excess iron in brain tissue can cause brain edema, neuronal death, and poor neurologic outcomes.19 In this study, we found that HO-1 induction increased iron accumulation in the injury periphery at the early stage after ICH, consistent with our previous report using HO-1 knockout mice.9 Furthermore, HO-1 increased ROS production and lipid oxidation at least in part because of iron accumulation in the early stage of ICH.
Although cumulative data suggest that inhibiting microglial activation might be beneficial for patients with ICH, long-term inhibition may be harmful because neuroprotective roles of microglia, such as phagocytosis, would also be inhibited.48 The activation of microglia can promote absorption of the hematoma and cell debris and induce neurogenesis and angiogenesis. In this study, we used MRI and Luxol fast blue/Cresyl violet to assess hematoma volume in mouse brain over time. We found that HO-1 may promote hematoma absorption in later stages of ICH. We also used CD34 and CD105 to detect angiogenesis and found that HO-1 can promote angiogenesis to promote neurologic functional recovery in the long term.
In this study, we chose the collagenase-induced ICH model to mimic clinical ICH. Though this model is currently the most suitable tool for studying the mechanism of ICH, it does not reproduce all of the clinical features of ICH in humans. Furthermore, HO-1 inhibition in the early stage has neuroprotective effects and may have clinical implications for ICH patients. However, the appropriate times and duration for inhibiting HO-1 expression must still be established in preclinical studies.
Conclusion
In conclusion, we provide preclinical evidence that HO-1 plays a toxic role in the early stage of ICH. Potential mechanisms by which HO-1 might increase brain injury include microglial activation, BBB damage, inflammatory reactions, neuronal cell death, oxidative damage, white matter injury, and iron accumulation. However, in the later stage of ICH, HO-1 can play a neuroprotective role by increasing hematoma absorption and angiogenesis. Hence, HO-1 inhibition could be developed as a novel therapeutic strategy to reduce brain edema, lessen inflammatory injury, and improve functional outcomes for ICH patients. However, HO-1 inhibition should not be sustained for long because of its protection in the later stage of ICH.
Supplementary Material
Supplementary Material
Supplementary Material
Acknowledgment
We thank Claire Levine for assistance with the manuscript preparation.
Funding
The author(s) disclosed receipt of the following financial support for the research, authorship, and/or publication of this article: the National Natural Science Foundation of China 81200885, Heilongjiang Postdoctoral Science-Research Foundation LBH-Q13120, the Natural Science Foundation of Heilongjiang Province of China LC2013C30, the Foundation of the First Affiliated Hospital of Harbin Medical University 2012LX004, the Graduate Innovation Foundation of Harbin Medical University YJSCX2014-26HYD, and the National Institutes of Health (R01NS078026, R01AT007317).
Declaration of conflicting interests
The authors declared no potential conflicts of interest with respect to the research, authorship, and/or publication of this article.
Authors’ contribution
He Wu, Jian Wang, and Jiping Qi designed the research; Zhen Zhang, Ze Zhang, Yuejia Song, Danyang Li, Rui Liang, Yuxin Pang, Hong Zhu, and Yunhe Gu performed the research; Zhen Zhang, He Wu, and Jian Wang wrote the paper.
Supplementary material
Supplementary material for this paper can be found at http://jcbfm.sagepub.com/content/by/supplemental-data.
References
- 1.Lin S, Yin Q, Zhong Q, et al. Heme activates TLR4-mediated inflammatory injury via MyD88/TRIF signaling pathway in intracerebral hemorrhage. J Neuroinflamm 2012; 9: 46. [DOI] [PMC free article] [PubMed] [Google Scholar]
- 2.Kwon KJ, Kim JN, Kim MK, et al. Neuroprotective effects of valproic acid against hemin toxicity: possible involvement of the down-regulation of heme oxygenase-1 by regulating ubiquitin-proteasomal pathway. Neurochem Int 2013; 62: 240–250. [DOI] [PubMed] [Google Scholar]
- 3.Chen L, Zhang X, Chen-Roetling J, et al. Increased striatal injury and behavioral deficits after intracerebral hemorrhage in hemopexin knockout mice. J Neurosurg 2011; 114: 1159–1167. [DOI] [PMC free article] [PubMed] [Google Scholar]
- 4.Porto BN, Alves LS, Fernandez PL, et al. Heme induces neutrophil migration and reactive oxygen species generation through signaling pathways characteristic of chemotactic receptors. J Biol Chem 2007; 282: 24430–24436. [DOI] [PubMed] [Google Scholar]
- 5.Xi G, Keep RF, Hoff JT. Mechanisms of brain injury after intracerebral haemorrhage. Lancet Neurol 2006; 5: 53–63. [DOI] [PubMed] [Google Scholar]
- 6.Smith A. Homeostasis of heme in health and disease: current aspects of the structural biology of heme-protein interactions and of gene regulation. DNA Cell Biol 2002; 21: 245–249. [DOI] [PubMed] [Google Scholar]
- 7.Chen-Roetling J, Lu X, Regan RF. Targeting heme oxygenase after intracerebral hemorrhage. Ther Targets Neurol Dis 2015; 2: e474. [DOI] [PMC free article] [PubMed] [Google Scholar]
- 8.Wang J, Dore S. Heme oxygenase 2 deficiency increases brain swelling and inflammation after intracerebral hemorrhage. Neuroscience 2008; 155: 1133–1141. [DOI] [PMC free article] [PubMed] [Google Scholar]
- 9.Wang J, Dore S. Heme oxygenase-1 exacerbates early brain injury after intracerebral haemorrhage. Brain 2007; 130: 1643–1652. [DOI] [PMC free article] [PubMed] [Google Scholar]
- 10.Wang J, Zhuang H, Dore S. Heme oxygenase 2 is neuroprotective against intracerebral hemorrhage. Neurobiol Dis 2006; 22: 473–476. [DOI] [PubMed] [Google Scholar]
- 11.Zhang Z, Zhang Z, Lu H, et al. Microglial polarization and inflammatory mediators after intracerebral hemorrhage. Mol Neurobiol. Epub ahead of print 19 February 2016. DOI: 10.1007/s12035-016-9785-6. [DOI] [PMC free article] [PubMed]
- 12.Panahian N, Yoshiura M, Maines MD. Overexpression of heme oxygenase-1 is neuroprotective in a model of permanent middle cerebral artery occlusion in transgenic mice. J Neurochem 1999; 72: 1187–1203. [DOI] [PubMed] [Google Scholar]
- 13.Zhang J, Fu B, Zhang X, et al. Bicyclol upregulates transcription factor Nrf2, HO-1 expression and protects rat brains against focal ischemia. Brain Res Bull 2014; 100: 38–43. [DOI] [PubMed] [Google Scholar]
- 14.Saleem S, Zhuang H, Biswal S, et al. Ginkgo biloba extract neuroprotective action is dependent on heme oxygenase 1 in ischemic reperfusion brain injury. Stroke 2008; 39: 3389–3396. [DOI] [PMC free article] [PubMed] [Google Scholar]
- 15.Yang C, Zhang X, Fan H, et al. Curcumin upregulates transcription factor Nrf2, HO-1 expression and protects rat brains against focal ischemia. Brain Res 2009; 1282: 133–141. [DOI] [PubMed] [Google Scholar]
- 16.Chen-Roetling J, Song W, Schipper HM, et al. Astrocyte overexpression of heme oxygenase-1 improves outcome after intracerebral hemorrhage. Stroke 2015; 46: 1093–1098. [DOI] [PMC free article] [PubMed] [Google Scholar]
- 17.Gong Y, Tian H, Xi G, et al. Systemic zinc protoporphyrin administration reduces intracerebral hemorrhage-induced brain injury. Acta Neurochir Suppl 2006; 96: 232–236. [DOI] [PubMed] [Google Scholar]
- 18.Wagner KR, Hua Y, de Courten-Myers GM, et al. Tin-mesoporphyrin, a potent heme oxygenase inhibitor, for treatment of intracerebral hemorrhage: in vivo and in vitro studies. Cell Mol Biol 2000; 46: 597–608. [PubMed] [Google Scholar]
- 19.Wu H, Wu T, Li M, et al. Efficacy of the lipid-soluble iron chelator 2,2'-dipyridyl against hemorrhagic brain injury. Neurobiol Dis 2012; 45: 388–394. [DOI] [PMC free article] [PubMed] [Google Scholar]
- 20.Katori M, Buelow R, Ke B, et al. Heme oxygenase-1 overexpression protects rat hearts from cold ischemia/reperfusion injury via an antiapoptotic pathway. Transplantation 2002; 73: 287–292. [DOI] [PubMed] [Google Scholar]
- 21.Berberat PO, Yi AR, Yamashita K, et al. Heme oxygenase-1-generated biliverdin ameliorates experimental murine colitis. Inflamm Bowel Dis 2005; 11: 350–359. [DOI] [PubMed] [Google Scholar]
- 22.Duan ZJ, Yang D, Wang F, et al. Heme oxygenase-1 regulates the major route involved in formation of immune hepatic fibrosis in rats. Chin Med J 2010; 123: 3304–3308. [PubMed] [Google Scholar]
- 23.Wang J, Tsirka SE. Neuroprotection by inhibition of matrix metalloproteinases in a mouse model of intracerebral haemorrhage. Brain 2005; 128: 1622–1633. [DOI] [PubMed] [Google Scholar]
- 24.Wu H, Wu T, Xu X, et al. Iron toxicity in mice with collagenase-induced intracerebral hemorrhage. J Cereb Blood Flow Metab 2011; 31: 1243–1250. [DOI] [PMC free article] [PubMed] [Google Scholar]
- 25.Wu H, Wu T, Hua W, et al. PGE2 receptor agonist misoprostol protects brain against intracerebral hemorrhage in mice. Neurobiol Aging 2015; 36: 1439–1450. [DOI] [PMC free article] [PubMed] [Google Scholar]
- 26.Park L, Anrather J, Girouard H, et al. Nox2-derived reactive oxygen species mediate neurovascular dysregulation in the aging mouse brain. J Cereb Blood Flow Metab 2007; 27: 1908–1918. [DOI] [PubMed] [Google Scholar]
- 27.Kamada H, Yu F, Nito C, et al. Influence of hyperglycemia on oxidative stress and matrix metalloproteinase-9 activation after focal cerebral ischemia/reperfusion in rats: relation to blood-brain barrier dysfunction. Stroke 2007; 38: 1044–1049. [DOI] [PMC free article] [PubMed] [Google Scholar]
- 28.Wu T, Wu H, Wang J, et al. Expression and cellular localization of cyclooxygenases and prostaglandin E synthases in the hemorrhagic brain. J Neuroinflamm 2011; 8: 22. [DOI] [PMC free article] [PubMed] [Google Scholar]
- 29.Zan L, Zhang X, Xi Y, et al. Src regulates angiogenic factors and vascular permeability after focal cerebral ischemia-reperfusion. Neuroscience 2014; 262: 118–128. [DOI] [PMC free article] [PubMed] [Google Scholar]
- 30.Zhao X, Wu T, Chang CF, et al. Toxic role of prostaglandin E2 receptor EP1 after intracerebral hemorrhage in mice. Brain Behav Immun 2015; 46: 293–310. [DOI] [PMC free article] [PubMed] [Google Scholar]
- 31.Davalos D, Grutzendler J, Yang G, et al. ATP mediates rapid microglial response to local brain injury in vivo. Nat Neurosci 2005; 8: 752–758. [DOI] [PubMed] [Google Scholar]
- 32.Ransohoff RM, Cardona AE. The myeloid cells of the central nervous system parenchyma. Nature 2010; 468: 253–262. [DOI] [PubMed] [Google Scholar]
- 33.Aronowski J, Zhao X. Molecular pathophysiology of cerebral hemorrhage: secondary brain injury. Stroke 2011; 42: 1781–1786. [DOI] [PMC free article] [PubMed] [Google Scholar]
- 34.Kim SU, de Vellis J. Microglia in health and disease. J Neurosci Res 2005; 81: 302–313. [DOI] [PubMed] [Google Scholar]
- 35.Wang J. Preclinical and clinical research on inflammation after intracerebral hemorrhage. Prog Neurobiol 2010; 92: 463–477. [DOI] [PMC free article] [PubMed] [Google Scholar]
- 36.Wang J, Dore S. Inflammation after intracerebral hemorrhage. J Cereb Blood Flow Metab 2007; 27: 894–908. [DOI] [PubMed] [Google Scholar]
- 37.Mracsko E, Veltkamp R. Neuroinflammation after intracerebral hemorrhage. Front Cell Neurosci 2014; 8: 388. [DOI] [PMC free article] [PubMed] [Google Scholar]
- 38.Zimniak P. Relationship of electrophilic stress to aging. Free Radic Biol Med 2011; 51: 1087–1105. [DOI] [PMC free article] [PubMed] [Google Scholar]
- 39.Afshar Moghaddam N, Mahsuni P, Taheri D. Evaluation of endoglin as an angiogenesis marker in glioblastoma. Iran J Pathol 2015; 10: 89–96. [PMC free article] [PubMed] [Google Scholar]
- 40.Behrem S, Zarkovic K, Eskinja N, et al. Endoglin is a better marker than CD31 in evaluation of angiogenesis in glioblastoma. Croat Med J 2005; 46: 417–422. [PubMed] [Google Scholar]
- 41.Tejima E, Zhao BQ, Tsuji K, et al. Astrocytic induction of matrix metalloproteinase-9 and edema in brain hemorrhage. J Cereb Blood Flow Metab 2007; 27: 460–468. [DOI] [PubMed] [Google Scholar]
- 42.Candelario-Jalil E, Yang Y, Rosenberg GA. Diverse roles of matrix metalloproteinases and tissue inhibitors of metalloproteinases in neuroinflammation and cerebral ischemia. Neuroscience 2009; 158: 983–994. [DOI] [PMC free article] [PubMed] [Google Scholar]
- 43.Gauberti M, Montagne A, Marcos-Contreras OA, et al. Ultra-sensitive molecular MRI of vascular cell adhesion molecule-1 reveals a dynamic inflammatory penumbra after strokes. Stroke 2013; 44: 1988–1996. [DOI] [PubMed] [Google Scholar]
- 44.Lu X, Chen-Roetling J, Regan RF. Systemic hemin therapy attenuates blood-brain barrier disruption after intracerebral hemorrhage. Neurobiol Dis 2014; 70: 245–251. [DOI] [PMC free article] [PubMed] [Google Scholar]
- 45.Leys D, Englund E, Del Ser T, et al. White matter changes in stroke patients. Relationship with stroke subtype and outcome. Eur Neurol 1999; 42: 67–75. [DOI] [PubMed] [Google Scholar]
- 46.Green AR, Ashwood T. Free radical trapping as a therapeutic approach to neuroprotection in stroke: experimental and clinical studies with NXY-059 and free radical scavengers. Curr Drug Targets CNS Neurol Disord 2005; 4: 109–118. [DOI] [PubMed] [Google Scholar]
- 47.Wang J, Tsirka SE. Contribution of extracellular proteolysis and microglia to intracerebral hemorrhage. Neurocrit Care 2005; 3: 77–85. [DOI] [PubMed] [Google Scholar]
- 48.Wang J, Tsirka SE. Tuftsin fragment 1-3 is beneficial when delivered after the induction of intracerebral hemorrhage. Stroke 2005; 36: 613–618. [DOI] [PubMed] [Google Scholar]
Associated Data
This section collects any data citations, data availability statements, or supplementary materials included in this article.


