

Abstract
Rapid eye movement (REM) sleep dysregulation is a symptom of many neuropsychiatric disorders, yet the mechanisms of REM sleep homeostatic regulation are not fully understood. We have shown that, after REM sleep deprivation, the pedunculopontine tegmental nucleus (PPT) plays a critical role in the generation of recovery REM sleep. In this study, we used multidisciplinary techniques to show a causal relationship between brain‐derived neurotrophic factor (BDNF)‐tropomyosin receptor kinase B (TrkB) signaling in the PPT and the development of REM sleep homeostatic drive. Rats were randomly assigned to conditions of unrestricted sleep or selective REM sleep deprivation (RSD) with PPT microinjections of vehicle control or a dose of a TrkB receptor inhibitor (2, 3, or 4 nmol K252a or 4 nmol ANA‐12). On experimental days, rats received PPT microinjections and their sleep‐wake physiological signals were recorded for 3 or 6 h, during which selective RSD was performed in the first 3 h. At the end of all 3 h recordings, rats were killed and the PPT was dissected out for BDNF quantification. Our results show that K252a and ANA‐12 dose‐dependently reduced the homeostatic responses to selective RSD. Specifically, TrkB receptor inhibition reduced REM sleep homeostatic drive and limited REM sleep rebound. There was also a dose‐dependent suppression of PPT BDNF up‐regulation, and regression analysis revealed a significant positive relationship between REM sleep homeostatic drive and the level of PPT BDNF expression. These data provide the first direct evidence that activation of BDNF‐TrkB signaling in the PPT is a critical step for the development of REM sleep homeostatic drive.
Keywords: brain‐derived neurotrophic factor, homeostatic regulation, pedunculopontine tegmental nucleus, REM sleep, sleep‐wake activity, tropomyosin receptor kinase B
Abbreviations used
- BDNF
brain‐derived neurotrophic factor
- mPRF
medial pontine reticular formation
- PKA
protein kinase A
- PPT
pedunculopontine tegmental nucleus
- REM sleep
rapid eye movement sleep
- RSD
REM sleep deprivation
- SubCD
dorsal subcoeruleus nucleus
- S‐W
sleep‐wake
- TrkB
tropomyosin receptor kinase B
- URS
unrestricted sleep
- VC
vehicle control
Healthy individuals regulate daily amounts of sleep through homeostatic processes, which quickly and efficiently compensate for any sleep loss (Datta and Maclean 2007). Sleep consists of two major stages – rapid eye movement (REM) sleep and non‐REM sleep – and experimental evidence suggests that the REM sleep homeostatic regulatory process is independent of the non‐REM sleep homeostatic regulatory process (Vivaldi et al. 1994; Franken 2002; Shea et al. 2008). In recent years, there have been a number of studies that have been dedicated to understanding the cellular and neurochemical mechanisms underlying the homeostatic regulation of non‐REM sleep (Thakkar et al. 2008; Elmenhorst et al. 2009; Dworak et al. 2011). However, there have not been similar studies conducted to understand the cellular and neurochemical mechanisms fundamental to the homeostatic regulation of REM sleep. Yet, REM sleep homeostatic regulation has been proven essential to the development, maturation, and functioning of the brain (Vertes and Kocsis 1997; Datta 2000; Hobson and Pace‐Schott 2002; Garcia‐Rill et al. 2008; Shaffery et al. 2012a; Kocsis 2016). In addition, REM sleep homeostatic regulation has been linked to emotional regulation, memory consolidation, and cognitive function (Smith 1995; Datta 2006; Poe et al. 2010; Datta and O'Malley 2013). Its dysregulation, moreover, is a common feature of many neuropsychiatric disorders (Gottesmann and Gottesman 2007; Khatami et al. 2008; Anderson and Bradley 2013). Thus, it is important to understand the cellular and neurochemical mechanisms that govern the homeostatic regulation of REM sleep.
The brain regions and neurotransmitters involved in the spontaneous generation of REM sleep, in contrast to its homeostatic regulation, have been successfully identified (Datta and Maclean 2007; Brown et al. 2012). Specifically, cholinergic cells in the pedunculopontine tegmentum (PPT) and glutamatergic cells in the medial pontine reticular formation and dorsal subcoeruleus nucleus are all involved in REM sleep generation and maintenance (Datta and Maclean 2007; Garcia‐Rill et al. 2008; Baghdoyan and Lydic 2012; Van Dort et al. 2015). It also has been demonstrated that spontaneously occurring REM sleep involves the kainate receptor‐mediated activation of PPT cholinergic cells and the subsequent activation of intracellular cAMP‐dependent protein kinase A (PKA) signaling (Datta et al. 2002; Datta and Desarnaud 2010). However, the mechanism through which this REM sleep generating network is homeostatically regulated remains poorly understood.
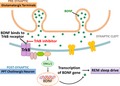
Brain‐derived neurotrophic factor (BDNF) has been implicated in a number of different functions including the regulation of non‐REM sleep (Faraguna et al. 2008; Datta et al. 2009a; Martinowich et al. 2011; Shaffery et al. 2012b; Schmitt et al. 2016). In one study, it was shown that increased endogenous BDNF might be responsible for increased slow‐wave activity during recovery non‐REM sleep after total sleep deprivation (Faraguna et al. 2008). More recently, we have shown that, in the PPT and dorsal subcoeruleus nucleus, BDNF expression increases with increased REM sleep homeostatic drive (Datta et al. 2015). On the basis of this evidence, we hypothesize that increased BDNF expression in the PPT may be causally responsible for the development of REM sleep homeostatic drive. In this study, we have used a combination of behavioral, physiological, pharmacological, and molecular methods to test this hypothesis. The results of the study indicate that increased BDNF expression and activation of tropomyosin receptor kinase B (TrkB) receptors in the PPT are critical cellular‐molecular steps for the development of REM sleep homeostatic drive.
Materials and methods
Subjects and housing
The subjects were 55 adult male Wistar rats (Charles River, Wilmington, MA, USA), weighing between 250 and 350 g. The rats were individually housed at 24°C in a 12/12 h light/dark cycle (lights on from 6:00 am to 6:00 pm) with ad libitum access to food and water. To minimize any stress from experimental handling, subjects were gently handled daily for 5–10 min starting 1 week before surgery and continuing until recording sessions began. All efforts were made to reduce the number of animals used in our experiments and to minimize any possible suffering by the animals. In this study, based on power calculations, we required six to eight animals (depending on sleep‐wake parameters or amount of BDNF) per group to detect difference at 95% confidence (α = 0.05; β = 0.2) and ≥ 0.8 powers. All procedures were performed in accordance with the NIH Guide for the Care and Use of Laboratory Animals, and approved by the University of Tennessee Animal Care Committee (Protocol Number: 2311‐1214‐UTK). All experiments were conducted in compliance with the ARRIVE guidelines (Kilkenny et al. 2010)].
Surgical procedures for electrode and guide tube implantation
All surgical procedures were performed stereotaxically under aseptic conditions, as previously described (Bandyopadhya et al. 2006; Datta et al. 2011). While animals were under Isoflurane anesthesia (5% induction; 2–3% maintenance in 100% oxygen), electrodes were chronically implanted to enable recording of cortical electroencephalogram (EEG), hippocampal EEG, and nuchal electromyogram (EMG) through a plastic connector. Stainless steel guide tubes (26‐gauge) with equal length stylettes were bilaterally implanted 2 mm above the PPT, as described previously (Figure S1; Bandyopadhya et al. 2006; Datta et al. 2011). Post‐operative pain was controlled with buprenorphine (0.05 mg/kg, I.M.; Cerilliant, Round Rock, TX, USA).
Adaptation recording sessions
After a post‐surgical recovery of 3–7 days in home cage housing, rats were habituated to the recording procedure for about 6–8 days. Adaptation recording sessions were performed between 9:00 am and 4:00 pm, when rats are normally sleeping. These 6 h sessions allowed for electrode testing and daily observation of variations in sleep‐wake (S‐W) activity. During this time, rats were placed in the recording cage (Pinnacle 8238: 12 inch diameter × 12 inch tall; Pinnacle Technology Inc., Lawrence, KS, USA) with a food hopper and a water bottle. A multichannel preamplifier (customized from Pinnacle Technology's 8400 four‐channel EEG/EMG system) was secured to the plastic connector on the head of each rat. A flexible recording cable connected each preamplifier to an electric swivel (Pinnacle 8409 rat commutator) fixed above each cage, allowing rats complete freedom of movement. The last day of adaptation recording sessions was determined when, for three consecutive days, day‐to‐day variation in the percentage of REM sleep was less than 5% of the total amount of REM sleep. This session was used as each rat's baseline recording.
Sleep‐wake recording and analysis
The preamplifier connected to each rat's head amplified the cortical EEG, hippocampal EEG, and EMG signals by 100×. The commutator received these signals, which were then conditioned by an analog filter. EEG signals were sampled at 1 kHz, and band‐pass filtered between 0.5 Hz and 100 Hz. EMG signals were sampled at 2 kHz, and band‐pass filtered between 10 Hz and 200 Hz. In addition to these physiological signals, the animals’ behavior was monitored continuously using a video camera attached above the recording cages. Behavioral and physiological data were synchronously recorded and imaged using Sirenia® Acquisition software (Pinnacle Technology Inc.). Using Sirenia® Sleep Pro software (Pinnacle Technology Inc.), the data were visually scored by one investigator blinded to the treatment conditions. Three behavioral states were distinguished: wake (W), non‐REM sleep, and REM sleep. The physiological criteria for the identification of these S‐W states are described in detail in earlier publications (Datta et al. 2002, 2015). In this study, the behavioral states were scored in successive 5‐s epochs.
Drug and vehicle control
To inhibit BDNF signaling in the PPT, the drug K252a (Mol. Wt. 467.48; Calbiochem, EMD Biosciences Inc, La Jolla, CA, USA) was locally microinjected into the PPT. The drug was selected for its potent inhibition of BDNF TrkB receptor activation (Knusel and Hefti 1992). Other microinjection studies have successfully used commercially available K252a in behaving animals (Clark et al. 2011; Casarotto et al. 2015; Ju et al. 2015; Gibon et al. 2016). For our microinjections, K252a was brought into solution using dimethyl sulfoxide, and then diluted in 0.9% saline at three concentrations (2, 3, and 4 nmol/100 nL). A saline solution (20 nL dimethyl sulfoxide mixed in 80 nL 0.9% saline) was used for the vehicle control (VC) microinjection (100 nL). The control saline and drug solutions were freshly prepared under sterile conditions immediately before each use.
Although K252a has been accepted and widely used as the most potent TrkB inhibitor currently available, higher doses of this drug have been shown to have some nonspecific effects on protein kinases (Kase et al. 1986; Ruegg and Burgess 1989; Knusel and Hefti 1992). Therefore, in some animals, we microinjected a newer, but less verified drug, ANA‐12 (Mol. Wt. 407.49; Tocris, Bristol, UK; 4 nmol/100 nL). ANA‐12 was recently developed as a highly specific TrkB inhibitor (Cazorla et al. 2011). ANA‐12 was used to confirm that the effects of K252a microinjections were comparable to the effects of more specific inhibition of TrkB receptors.
Localized microinjections of K252a, ANA‐12 and vehicle control into the PPT
The microinjection system consisted of a 32‐gauge stainless steel injector cannula that extended 2.0 mm beyond the implanted guide tube. The collar of the injector was connected to a 2.0 μL Hamilton microsyringe with polyethylene tubing, filled with either vehicle control or a dose of TrkB inhibitor. While the animal was connected to the recording system, the injector was inserted into one guide tube and either 100 nL of VC, ANA‐12, or one of the three concentrations of K252a was microinjected over a 60 s period. The injector cannula was gently withdrawn 2 min after the injection, and a stylette was reinserted into the guide tube. This procedure was then repeated in the other guide tube. During the microinjections, animals were free to move around the cage with the cannula in place.
Experimental design
After the baseline recording day, each rat was connected to the polygraphic recording system at 8:50 am for an experimental recording session. Of the 55 rats, 40 were randomly divided into five groups and were subjected to Experiments 1 and 2. Six rats were subjected to Experiment 3, and nine were subjected to Experiment 4. The procedure for these experiments is outlined in Fig. 1. Rats were randomized for treatment protocols and the experimenter was blind to the type of microinjections (2, 3, or 4 nmol doses of K252a or VC).
Figure 1.
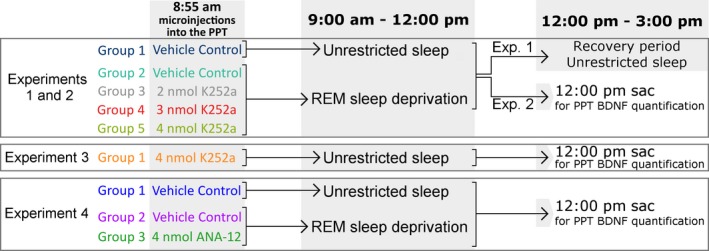
Experimental design. On the Experimental Day, rats received microinjections into the pedunculopontine tegmental nucleus (PPT) at 8:55 am and sleep‐wake activity was recorded for the next 6 h. Experiment 1: Group 1 [vehicle control + unrestricted sleep (URS)]: bilateral microinjections of control saline (100 nL), followed by 6 hr of unrestricted sleep; Group 2 [vehicle control + REM sleep deprivation (RSD)]: bilateral microinjections of control saline (100 nL), followed by 3 h of selective RSD and then 3 hr of URS; Groups 3, 4, and 5 (dose K252a + RSD): bilateral microinjections of 2, 3 or 4 nmol of K252a, respectively, followed by 3 h of selective RSD and then 3 hr of URS. Experiment 2: 10 days after Experiment 1, animals were put through exactly the same protocol, but were killed at 12 pm for PPT brain‐derived neurotrophic factor (BDNF) quantification. Experiment 3: Animals received bilateral microinjections of 4 nmol K252a, followed by 3 hr of URS and were killed at 12 pm for PPT BDNF quantification. Experiment 4: Group 1 (vehicle control + URS): bilateral microinjections of control saline (100 nL), followed by 3 hr of URS; Group 2 (vehicle control + RSD): bilateral microinjections of control saline (100 nL), followed by 3 h of selective RSD; Groups 3 (4 nmol ANA‐12 + RSD): bilateral microinjections of 4 nmol of ANA‐12, followed by 3 h of selective RSD. Animals were killed at 12:00 pm for PPT BDNF quantification.
Experiment 1
At 8:55 am, each rat received bilateral microinjections of either VC (100 nL/site) or one of the three doses of K252a (100 nL/site) into the PPT. Group 1 (n = 8) rats received microinjections of VC and were allowed 6 h of unrestricted S‐W activity (URS). Group 2 (n = 8) rats also received microinjections of VC, but were selectively REM sleep deprived (RSD) for the first 3 h of the 6 h session, as described in our earlier publication (Datta et al. 2015; hereafter, Groups 1 and 2 are referred to as VC‐URS and VC‐RSD groups, respectively). Rats in Groups 3, 4 and 5 (n = 8 each) received microinjections of 2, 3, and 4 nmol of K252a, respectively, and were selectively REM sleep deprived for the first 3 h of the 6 h recording session. All groups were allowed a recovery period of undisturbed S‐W activity for the last 3 h of each session.
Experiment 2
Seven to ten days after Experiment 1, when day‐to‐day variation in the total amount of REM sleep had again stabilized, the same 40 rats underwent a second experimental recording session. The grouping and experimental procedure were identical to that of Experiment 1, except that, after microinjections, animals were recorded for only 3 h (between 9 am and 12:00 pm). The rats were immediately killed after the end of the 3 h recording session, and brains were dissected for the quantification of BDNF expression in the PPT. The quantification of BDNF in the PPT, 3 h after bilateral microinjections of VC or one of the three doses of K252a into the PPT, was defined as the primary endpoint of Experiments 1 and 2.
Experiment 3
In the previous experiments, the required dose of K252a was very low. Nonetheless, to confirm that our maximum dose of K252a did not block spontaneously occurring REM sleep episodes, in six rats, we injected 4 nmol of K252a into the PPT without depriving REM sleep. At 8:55 am, each rat received bilateral microinjections of K252a (4 nmol/100 nL, 100 nL/site) and was then allowed 3 h of URS. The end of this 3 h URS was defined as the primary end point of Experiment 3. Analysis of the S‐W values was used to study the effects of K252a on unrestricted sleep.
Experiment 4
To confirm the effects of TrkB inhibition in the PPT, we ran an experiment similar to Experiment 2 using ANA‐12. Nine rats were randomly divided into Group 1 (n = 3), Group 2 (n = 3), and Group 3 (n = 3). The rats in Group 1 received bilateral PPT microinjections of VC (100 nL/site) at 8:55 am, and were then allowed 3 h of URS. The rats in Group 2 also received bilateral PPT microinjections of vehicle control (100 nL/site) at 8:55 am, but were then subjected to 3 h of selective RSD. The rats in Group 3 were subjected to an identical procedure as Group 2, but received bilateral microinjections of ANA‐12 (4 nmol/100 nL, 100 nL/site) into the PPT. All rats were immediately killed after the end of the 3 h recording session, and brains were dissected for the quantification of BDNF expression in the PPT. The quantification of BDNF in the PPT, 3 h after bilateral microinjections of VC or ANA‐12 into the PPT, was defined as the primary endpoint of Experiment 4.
Tissue collection and BDNF quantification
At the end of each 3 h experimental recording session, rats were killed immediately with 5% isoflurane. Brains were quickly removed and snap‐frozen for molecular analysis, as described earlier (Datta and Desarnaud 2010; Datta et al. 2015). All rats were killed at a fixed time of day, to rule out any diurnal factors that may contribute to the different levels of BDNF expression in the different groups. The PPT was dissected on an ice‐chilled Petri dish, as described earlier (Figure S1; Datta and Desarnaud 2010; Datta et al. 2011, 2015). For the 40 rats in Experiment 2, the amount of BDNF (BDNF/mg total protein) was determined using ELISA technique, as described earlier (Datta et al. 2009a, 2015). For the nine rats in Experiment 4, the amount of BDNF was determined using standard western blotting techniques, as previously described (Stack et al. 2010). Polyvinylidene difluoride membranes were incubated overnight in anti‐BDNF antibody (1:500, N‐20, sc‐546; Santa Cruz, Paso Robles, CA, USA). For normalization, membranes were stripped, and re‐probed with anti‐Alpha‐tubulin mouse antibody (1:10 000, clone B‐5‐1‐2; Sigma, St Louis, MO, USA). Quantification of immunoreactive bands was carried out using the ChemiDoc Touch Imaging System (Bio‐Rad Laboratories, Hercules, CA, USA). The volume intensity of each BDNF chemiluminescent band was normalized to the volume intensity of the corresponding anti‐Alpha Tubulin band, and represented as fold change. ELISA and western blotting experiments were performed by one investigator blinded to the behavioral and drug treatment conditions.
Statistical analysis
To determine the effects of intra‐PPT microinjections on changes in S‐W data, the polygraphic measures of the rats were analyzed to calculate the following dependent variables, which were quantified for each recording session: (i) percentage of recording time spent in W, non‐REM sleep, and REM sleep; and (ii) total number of REM sleep episodes. The data were analyzed using different one‐factor anovas for the first and second 3 h of each recording. Post hoc Bonferroni post‐tests were conducted to determine the individual levels of significant difference between each of the groups. One‐factor anovas and post hoc tests (Bonferroni's multiple comparison test) also were used to compare the levels of PPT BDNF expression. To assess the causal relationship between the levels of PPT BDNF expression and the number of REM sleep episodes during Experiment 2, linear regression analysis was performed. Prior to individual statistical tests, group data were subjected to normality testing, which confirmed that normality assumptions were met. The threshold for significance was p < 0.05. All statistical analyses were performed using Graphpad Prism statistical software (v6.0; Graphpad Software, La Jolla, CA, USA).
Results
Analysis of the Experiment 1 baseline recording sessions revealed that, prior to experimental recording sessions, there were no significant differences in S‐W behavior between the five groups (see Table S1). During experimental days, significant differences in S‐W architecture were observed. The hypnograms presented in Fig. 2 summarize the qualitative differences found over the first 3 h of Experiment 1 recording sessions. A visual inspection of the hypnograms shows that, as selective RSD progressed, the VC‐RSD group had an increasing number of REM sleep episodes; the groups that were treated additionally with K252a exhibited comparatively reduced REM sleep episodes. Because REM sleep episodes are taken as a measure of REM sleep drive, these observations demonstrate that this short‐term selective RSD produces REM sleep drive. The results also imply that K252a microinjections into the PPT alter homeostatic responses to selective RSD.
Figure 2.
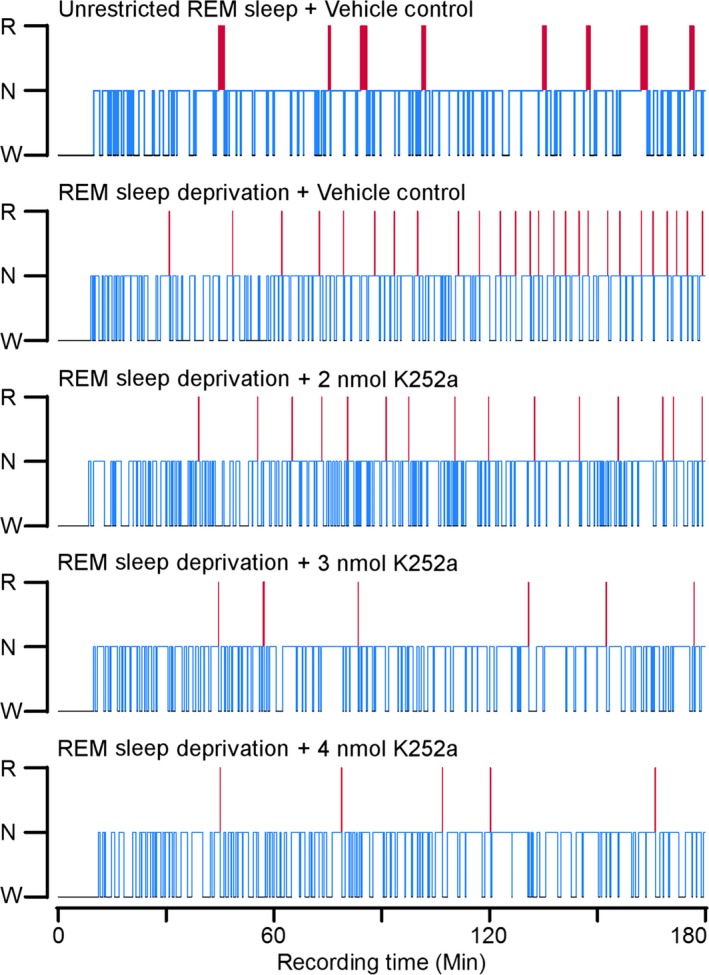
Effects of rapid eye movement (REM) sleep deprivation and microinjections of K252a on sleep‐wake architecture. Hypnograms, plotted as step histograms, to show the difference in sleep architecture between the five groups during REM sleep deprivation. Only the first 3 h of Experiment 1 are plotted, to provide a resolution that captures short (< 5 s) REM sleep episodes and the progressive increases in REM sleep drive. The hypnogram plots the occurrence and duration of wakefulness, Non‐REM sleep, and REM sleep. Blue lines indicate non‐REM sleep and red lines indicate REM sleep. Red line thickness signifies the duration of REM sleep episodes; note the thinness of the red lines in animals treated with REM sleep deprivation (RSD) compared to the vehicle control (VC)‐unrestricted sleep rat. Also note that the number of REM sleep episodes in the K252a‐treated rats are reduced compared to the VC‐RSD rat. Abbreviations: W, wake; N, non‐REM; R, REM.
Selective REM sleep deprivation and microinjections of K252a into the PPT have little effect on wakefulness and non‐REM sleep
Figure 3 summarizes the effects of selective RSD and microinjections of K252a into the PPT on wakefulness and non‐REM sleep. Analyses of both the first and second half of all experimental recording sessions uncovered no differences between groups in percent time spent in wakefulness (Fig. 3a and b; one‐factor anovas; 0–3 h: F (4,35) = 0.71, p = 0.59; 3–6 h: F (4,35) = 1.8, p = 0.15). Accordingly, neither the selective RSD procedure, nor K252a microinjections caused time spent in wakefulness to diverge from normal, unrestricted levels, as exhibited by the VC‐URS group. Analysis of non‐REM sleep revealed some group differences in both the first and second 3 h of experimental recording sessions (Fig. 3c and d; one‐factor anovas; 0–3 h: F (4,35) = 2.9, p = 0.035; 3–6 h: F (4,35) = 6.0, p < 0.001). In the first 3 h, post hoc tests revealed these differences to be insignificant (Fig. 3c; Bonferroni post‐tests; t = 0.10, p > 0.05). However, during the recovery period, comparisons of the drug‐treated groups to the VC‐RSD group revealed an effect of K252a microinjections. Specifically, the K252a‐treated animals displayed significantly more non‐REM sleep than the VC‐RSD group (Fig. 3d; Bonferroni post‐tests; 2 nmol K252a: t = 3.2, p < 0.05; 3 nmol K252a: t = 4.5, p < 0.001; 4 nmol K252a: t = 3.7, p < 0.01). Nonetheless, since the non‐REM values of the K252a‐treated groups were not significantly different from those of the VC‐URS group, it is unlikely that increased non‐REM sleep is an effect of K252a microinjections; especially because these differences were found in the last 3 h, during recovery sleep, but not during the first 3 h, when K252a activity would be at its highest.
Figure 3.
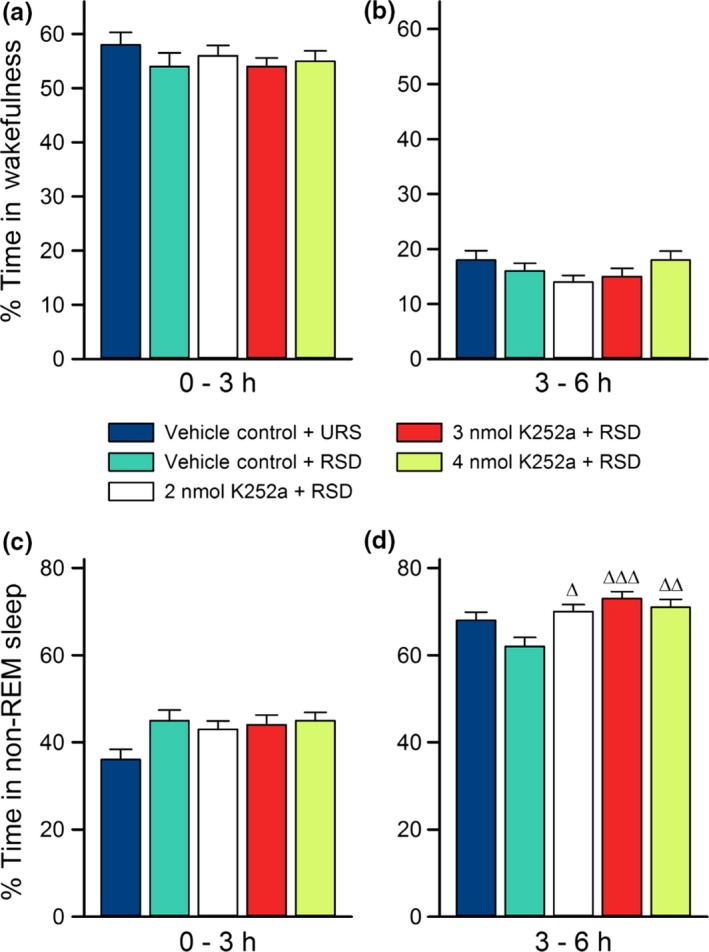
Effects of selective rapid eye movement (REM) sleep deprivation and microinjections of K252a on wakefulness and non‐REM sleep. Average percentages of time spent (mean ± SE) in wakefulness (top) and non‐REM sleep (bottom) during the first 3 h (a and c) and the last 3 h (b and d) of Experiment 1 recording sessions. The figure shows there were no significant differences between groups in amount of time spent in non‐REM sleep for the first 3 h, and no differences in wakefulness for all 6 h of experimental recording sessions. In the last 3 h (d), groups that received microinjections of K252a had non‐REM sleep percentages comparable to the vehicle control (VC)‐unrestricted sleep (URS) group, but not VC‐ REM sleep deprivation (RSD) group. Post hoc Bonferroni multiple comparison test: ∆ represents comparisons with the VC‐RSD group; ∆p < 0.05, ∆∆p < 0.01, and ∆∆∆p < 0.001.
REM sleep is significantly altered by both selective REM sleep deprivation and microinjections of K252a into the PPT
Analysis of the REM sleep data from Experiment 1 revealed significant group differences in the percent of time they spent in REM sleep during both halves of the 6 h recording sessions (Fig. 4a and b; one‐factor anovas; 0–3 h: F (4,35) = 130, p < 0.001; 3–6 h: F (4,35) = 51, p < 0.001). Figure 4(a) shows that, during the first 3 h of the experimental recording sessions, RSD‐treated groups exhibited significantly decreased percent time spent in REM sleep compared to the VC‐URS group (Bonferroni post‐tests; VC‐RSD: t = 17, p < 0.001; 2 nmol K252a: t = 18, p < 0.001; 3 nmol K252a: t = 19, p < 0.001; 4 nmol K252a: t = 19, p < 0.001). In fact, the selective RSD eliminated 85–95% of total REM sleep. For more insight into the effects of selective RSD, we compared the REM sleep percentage data of the VC‐RSD group to that of the VC‐URS group. The comparison showed that, during the 3 h recovery period, the VC‐RSD group showed an increase in percent time spent in REM sleep compared to the VC‐URS group (Fig. 4b; Bonferroni post‐tests; t = 9.2, p < 0.001). This increased REM sleep is evidence of REM rebound (Dement 1960; Gvilia et al. 2006; Shea et al. 2008). Compared to the VC‐RSD group, the percent time each K252a‐treated group spent in REM sleep during the recovery period was reduced, indicating a reduced REM rebound (Fig. 4a and b; Bonferroni posts‐tests; 2 nmol K252a: t = 5.6, p < 0.001; 3 nmol K252a: t = 12, p < 0.001; 4 nmol K252a: t = 12, p < 0.001). Moreover, the reduction in time spent in REM sleep in the K252a‐treated groups appears to be dose‐dependent (Fig. 4b; Bonferroni posts‐test; t = 3.1, p < 0.05).
Figure 4.
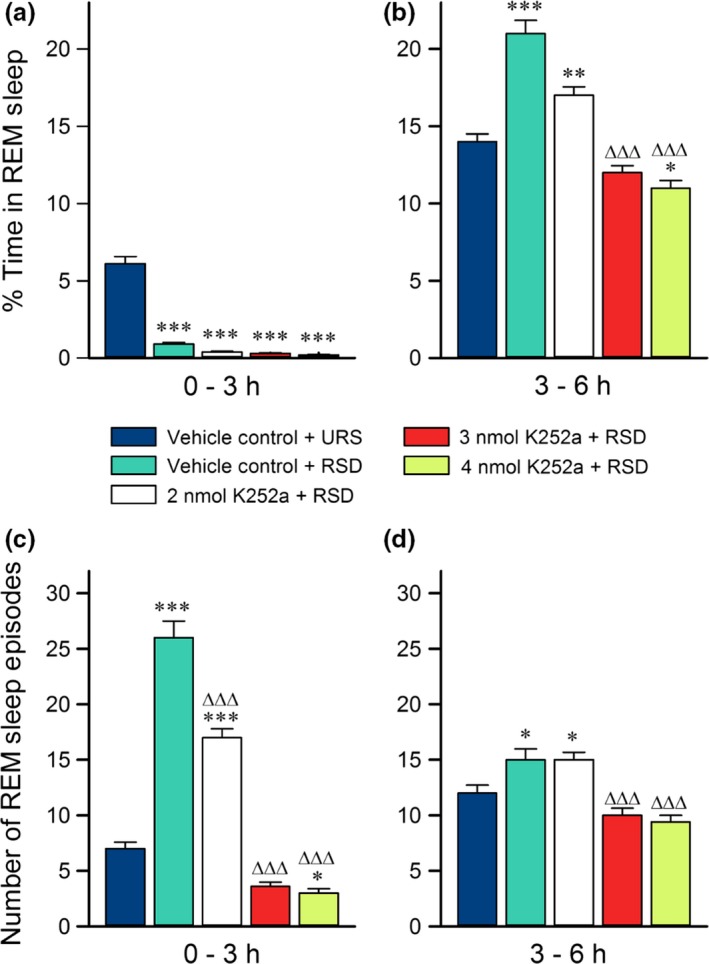
Effects of selective rapid eye movement (REM) sleep deprivation and microinjections of K252a on REM sleep. Histograms showing average (mean ± SE) percentages of time spent in REM sleep (top) and average (mean ± SE) number of REM sleep episodes (bottom) during the first 3 h (a and c) and the last 3 h (b and d) of Experiment 1 recording sessions. Post hoc Bonferroni multiple comparison test: Asterisk represents comparisons with vehicle control (VC)‐unrestricted sleep (URS) group; ∆ represents comparisons with VC‐REM sleep deprivation (RSD) group; *p < 0.05, **p < 0.01, and *** or ∆∆∆p < 0.001. The data demonstrate the effectiveness of RSD during the first 3 h (a). Note that, in the last 3 h (b), groups that received microinjections of K252a had REM sleep percentages more comparable to VC‐URS animals than VC‐RSD animals. Also, throughout the recordings (c and d), K252a injections reduced the number of REM sleep episodes compared to VC‐RSD animals, with higher doses showing REM sleep initiations comparable to VC‐URS animals.
There were also significant differences between the five groups in the number of REM sleep episodes they exhibited (Fig. 4c and d; one‐factor anovas; 0–3 h: F (4,35) = 140, p < 0.001; 3–6 h: F (4,35) = 14, p < 0.001). Compared to the VC‐URS group, the VC‐RSD group displayed a significant increase in the number of REM sleep episodes during the first 3 h of recording sessions (Fig. 4c; Bonferroni post‐tests; t = 16, p < 0.001). This increase in REM sleep episodes is evidence of REM sleep drive, a natural response to selective RSD (Datta et al. 2015). Combined with the percentages of REM sleep exhibited in the first 3 h of experimental recordings, the data indicate that this short‐term selective REM sleep deprivation is an efficient as well as powerful method to activate REM sleep homeostatic drive. Importantly, compared to the VC‐RSD group, K252a‐treated groups showed dose‐dependent reductions in REM sleep episodes during the first 3 h of experimental recording sessions (Fig. 4c; Bonferroni posts‐tests; 2 nmol K252a: t = 8.0, p < 0.001; 3 nmol K252a: t = 19, p < 0.001; 4 nmol K252a: t = 20, p < 0.001). In addition, the higher doses of K252a reduced the number of REM sleep episodes during the recovery period in last 3 h of recordings (Fig. 4d; Bonferroni posts‐tests; 2 nmol K252a: t = 8.0, p < 0.001; 3 nmol K252a: t = 19, p < 0.001; 4 nmol K252a: t = 20, p < 0.001). REM sleep drive thus appears to be reduced in K252a‐treated groups. Combined with the REM sleep percentage data, these results suggest that K252a microinjections into the PPT attenuate the effects of selective RSD on REM sleep behavior. Since K252a is a BDNF TrkB receptor antagonist, the results also implicate PPT BDNF‐TrkB signaling in the generation of homeostatic responses to selective RSD.
Selective REM sleep deprivation and application of K252a into the PPT alter BDNF expression which correlates with REM sleep homeostatic drive
The data shown in Fig. 5(a) indicate that selective RSD and K252a microinjections had significant effects on BDNF expression in the PPT (one‐factor anova; F (4,35) = 200, p < 0.001). To examine the specific effects of selective RSD, we compared the BDNF expression levels of the VC‐RSD group to those of the VC‐URS group. Analysis revealed that 3 h of selective RSD significantly increased PPT BDNF expression beyond normal, unrestricted levels (Bonferroni post‐tests; t = 22, p < 0.001). These results demonstrate that selective RSD increases BDNF expression in the PPT, and that PPT BDNF may play a role in physiological responses to selective RSD.
Figure 5.
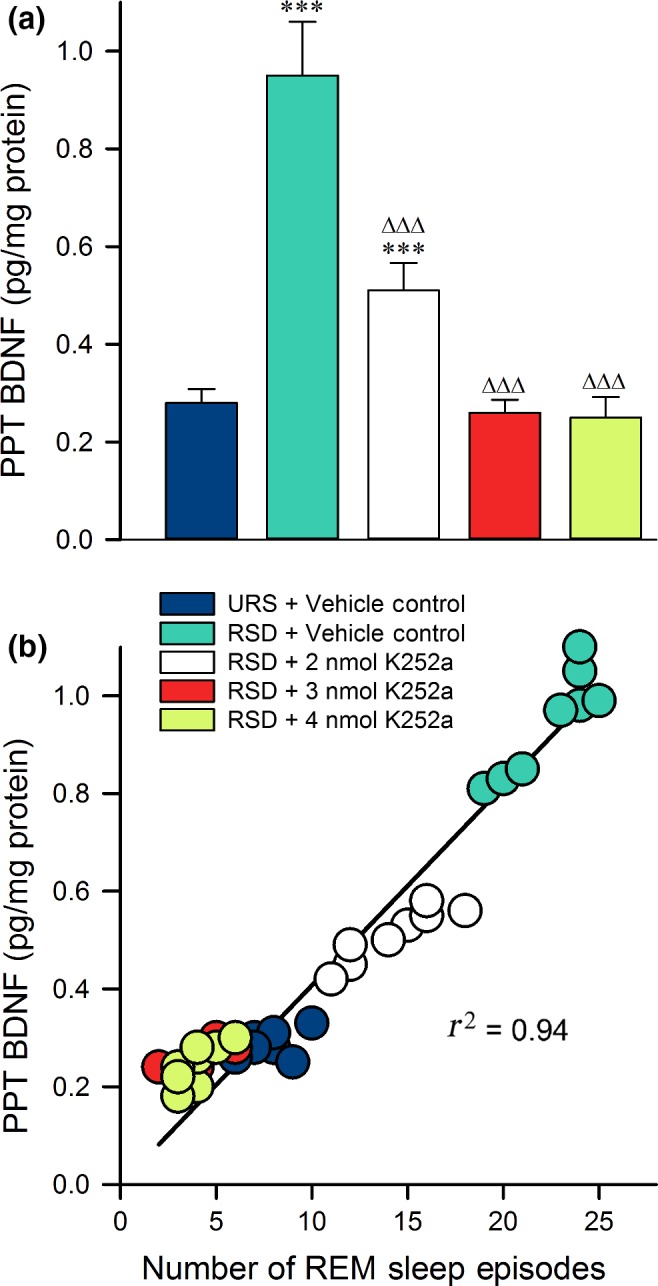
Levels of brain‐derived neurotrophic factor (BDNF) expression in the pedunculopontine tegmental nucleus (PPT) are predictive of the number of rapid eye movement (REM) sleep episodes initiated. (a) Histogram displaying the average amount of BDNF (mean ± SE) measured in the PPT after the first 3 h of Experiment 1 recording sessions. Post hoc Bonferroni multiple comparison test: Asterisk represents comparisons with vehicle control group [vehicle control (VC) + unrestricted sleep ( URS)]; ∆ represents comparisons with VC‐REM sleep deprivation (RSD) group; ***p < 0.001 and ∆∆∆p < 0.001. Note that, compared with the vehicle controls, BDNF in the PPT only increased significantly in the VC‐RSD group and the group with the lowest dose of K252a. (b) Amount of BDNF found in the PPT of each animal (n = 40 rats) as a function of the number of REM sleep episodes each animal initiated. Plot of linear regression best fit (solid line; Pearson correlation coefficient) indicates a statistically significant positive slope. These data reveal that the amount of BDNF in the PPT depends positively on the number of REM episodes initiated during RSD.
To understand the effects of K252a microinjections, we compared the BDNF expression levels of K252a‐treated groups to the VC‐RSD group. The K252a‐treated groups show reduced BDNF expression levels in a dose‐dependent manner (Fig. 5a; Bonferroni post‐tests; 2 nmol K252a: t = 15, p < 0.001; 3 nmol K252a: t = 23, p < 0.001; 4 nmol K252a: t = 24, p < 0.001). This suggests that microinjections of K252a into the PPT attenuated RSD‐induced elevation of BDNF expression, mirroring the attenuation of changes seen in sleep behavior. Furthermore, since K252a microinjections produced changes dose‐dependently in PPT BDNF expression and in sleep behavior, it was reasonable to suspect that PPT BDNF expression levels would correlate with behavioral responses to selective RSD. To investigate that possibility, we used Pearson correlation with plot the linear correlation of each animal's PPT BDNF expression and number of REM sleep episodes. As shown in Fig. 5(b), PPT BDNF expression was highly correlated with the number of REM sleep episodes exhibited during the 3 h experimental recording session in Experiment 2 (Pearson r2 = 0.94). These results indicate a strong association of BDNF expression with REM sleep drive. All in all, these data indicate that blocking PPT BDNF‐TrkB signaling suppresses RSD‐induced BDNF expression, and that the reduced expression is highly predictive of a reduced REM sleep homeostatic drive.
Local application of K252a or ANA‐12 into the PPT confirmed that TrkB inhibition blocked REM sleep homeostatic drive but not spontaneous REM sleep
The data from the animals in Experiment 3 are shown in Fig. 6. The animals that were treated with 4 nmol of K252a + URS did not show any significant differences in percent time in REM sleep (t‐test; df = 12, t = 0.25, p = 0.80) or number of REM sleep episodes (df = 12, t = 0.66, p = 0.52) compared to VC‐URS group (data from the original 40 rats in Experiment 1). This indicates that K252a does not affect spontaneous REM sleep.
Figure 6.
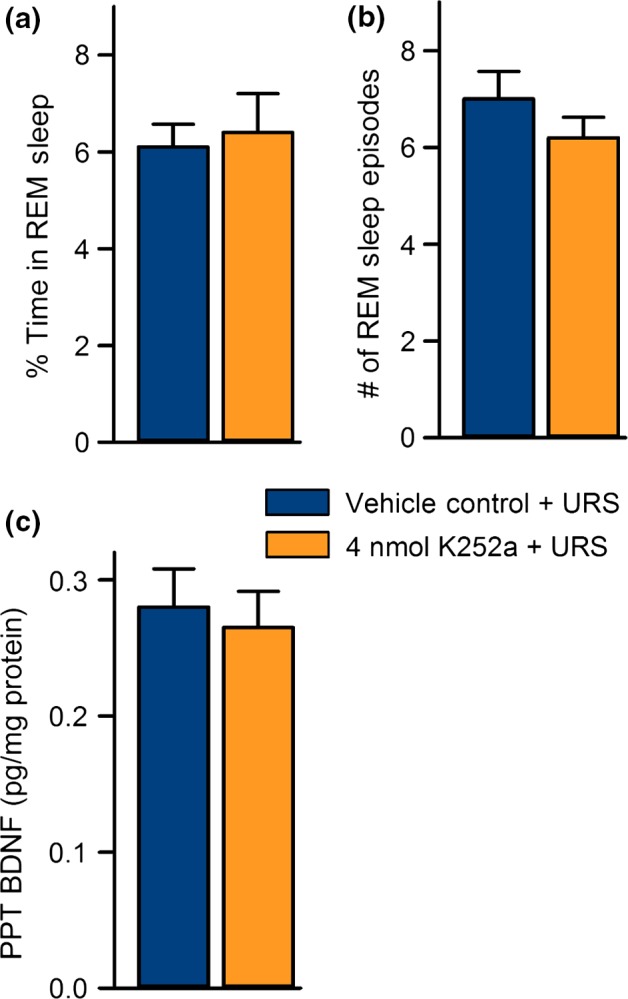
K252a microinjections do not significantly affect unrestricted sleep or pedunculopontine tegmental nucleus (PPT) brain‐derived neurotrophic factor (BDNF) expression. Data from Experiment 2 (vehicle control + unrestricted sleep (URS), n = 8) and Experiment 3 (4 nmol K252a + URS, n = 6). (a) Average (mean ± SE) percentages of time spent in rapid eye movement (REM) sleep during 3 h of unrestricted sleep. (b) Average (mean ± SE) number of REM sleep episodes during 3 h of unrestricted sleep. (c) Levels of PPT BDNF after 3 h of unrestricted sleep. Note that microinjections of 4 nmol K252a into the PPT had no affect on spontaneously occurring REM sleep or PPT BDNF expression.
The behavioral and molecular data from the animals in Experiment 4 are summarized in Fig. 7. The animals that received RSD and microinjections of 4 nmol of ANA‐12 spent an average of 1.2 ± 0.4% time in REM sleep, indicating successful deprivation of REM sleep (Fig. 7a). Despite this, the 4 nmol ANA‐12 + RSD group had an average number of REM sleep episodes comparable to the VC‐URS group, but much lower than the VC‐RSD animals (Fig. 7b). Collectively, these data suggest that specific inhibition of PPT TrkB receptors by microinjections of ANA‐12 reduced the number of REM sleep episodes that occurred in response to selective RSD. Our western blot analysis revealed that animals treated with 4 nmol ANA‐12 + RSD had lower BDNF expression than animals treated with RSD and vehicle control, but not lower than a VC‐URS animal (Fig. 7c and d). Thus, ANA‐12 inhibition of TrkB receptors reduced RSD‐induced homeostatic drive for REM sleep, and attenuated the increase in BDNF expression that is normally induced by selective RSD, supporting the data collected from the K252a experiments.
Figure 7.
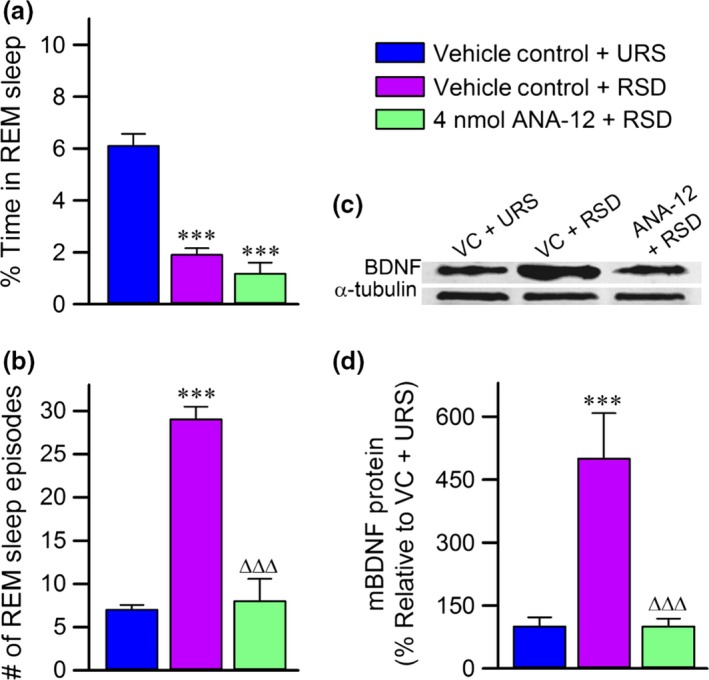
The effects of ANA‐12 on behavioral and molecular responses to rapid eye movement (REM) sleep deprivation. (a) Average (mean ± SE) percentages of time spent in REM sleep during Experiment 4. Note that animals treated with REM sleep deprivation (RSD) spent significantly less time in REM sleep compared to the vehicle control (VC)‐unrestricted sleep (URS) animals. (b) Average (mean ± SE) number of REM sleep episodes during RSD. Note that the VC‐RSD animals had a significant increase in the number of REM sleep episodes compared to the VC‐URS animals. Also, note that the group of animals treated with ANA‐12 microinjections had a significantly lower number of REM sleep episodes than the VC‐RSD group, but not compared to the VC‐URS group. (c) Representative western blots of brain‐derived neurotrophic factor (BDNF) and α‐tubulin in the pedunculopontine tegmental nucleus from VC‐URS, VC‐RSD, and 4 nmol ANA‐12 + RSD groups. (d) Histograms representing the densitometric analysis of western blots of BDNF expressed as a percentage of the VC‐URS group. All analyses of BDNF expression are normalized against α‐tubulin. Each bar represents the level of BDNF expression in each group. Note that the VC‐RSD group had increased expression of BDNF compared to the VC‐URS group and the 4 nmol ANA‐12 + RSD group. Asterisk represents comparisons (t‐test) with the VC‐URS group, Δ represents comparisons with the VC‐RSD group; ***p < 0.001 and ∆∆∆p < 0.001.
Discussion
This study shows that BDNF‐TrkB signaling in the PPT is a critical cellular‐molecular component in the homeostatic regulation of REM sleep. Our principle findings are as follows: (i) a brief period of selective RSD produced specific physiological and molecular responses, including a progressive increase in REM sleep homeostatic drive, the induction of REM sleep rebound, and increased expression of BDNF in the PPT; (ii) these physiological and molecular responses were attenuated by the pre‐treatment of the TrkB receptor antagonists, K252a or ANA‐12, into the PPT; (iii) the level of BDNF expression in each animal's PPT was positively correlated with the intensity of their homeostatic drive for REM sleep.
These findings imply that the up‐regulation of BDNF in the PPT is involved in the cellular and molecular mechanisms of REM sleep homeostatic regulation. Regression analysis revealed that 94.0% of the variance in homeostatic drive for REM sleep was explained by the level of BDNF expression (R 2 = 0.94), indicating that up‐regulation of BDNF in the PPT is highly predictive of increased REM sleep homeostatic drive. In addition, our results show that K252a microinjections dose‐dependently attenuated REM sleep homeostatic drive and REM sleep rebound, which suggests that TrkB receptor activation is involved in these physiological responses to selective RSD. Collectively, these results provide evidence for a causal relationship between increased BDNF‐TrkB receptor signaling in the PPT and the homeostatic regulation of REM sleep.
A recent study examined sleep architecture in adult mice constitutively lacking TrKB.T1 receptor (Watson et al. 2015). This study reported that these TrKB.T1 knockout mice have increased REM sleep time, reduced REM sleep latency, and reduced sleep continuity. This observation in TrKB.T1 knockout mice is consistent with the present findings. For example, BDNF exerts its effects through two isoforms of the TrKB receptors, TrKB.FL and TrKB.T1 (Fenner, 2012; Huang and Reichardt, 2003). The TrKB.FL contains a tyrosine kinase and is predominantly expressed in neurons, whereas TrKB.T1 express primarily in glia (Fenner, 2002). Interestingly, the TrkB. T1 isoform decreases function of TrkB.FL isoform (Eide et al. 1996; Dorsey et al., 2006). In TrKB.T1 knockout mice, the TrkB.T1 receptor is completely eliminated in the PPT and laterodorsal tegmentum (LDT), which are known to be involved in the regulation of spontaneously occurring REM sleep (Steriade et al. 1990; Datta 1995; Thakkar et al. 1998). Therefore, the removal of TrkB.T1 receptors might have removed its dominant‐negative inhibition on TrkB.FL receptors. Consistent with the present findings, this removal of inhibition might have increased Trk.FL receptors sensitivity that ultimately increased latency and amount of REM sleep in the TrKB.T1 knockout mice (Watson et al. 2015).
It is important to acknowledge that high doses of K252a have been shown to inhibit PKA, which we have previously shown to be involved in recovery REM sleep (Datta and Desarnaud 2010). Recovery REM sleep involves an increase in spontaneously occurring REM sleep episodes following selective RSD. Therefore, it is possible that the reduced REM sleep homeostatic responses seen in K252a‐treated groups were because of a reduction in spontaneously occurring REM sleep because of PKA inhibition. However, in this study, the REM sleep data collected after selective RSD indicated that the animals treated with 2 and 3 nmol of K252a did not have recovery REM sleep reduced below unrestricted values (Fig. 3b and d). In addition, during selective RSD, their number of REM sleep episodes was also not reduced below that of VC‐URS group (Fig. 3c). Collectively, this signifies that spontaneous REM sleep was not affected. Thus, it is unlikely that the inhibition of PKA was critically involved in the observed reductions in REM sleep drive. This assertion is supported by the results of Experiment 3, in which we have shown that our highest dose of K252a (4 nmol) did not affect spontaneously occurring REM sleep episodes (Fig. 5). In addition, the results from Experiment 4 indicate that application of ANA‐12 into the PPT reduces REM sleep drive and RSD‐induced BDNF expression. Since there is no evidence that ANA‐12 inhibits other protein kinases, we can conclude that inhibition of the TrkB receptors was responsible for those results, providing more evidence that inhibition of BDNF‐TrkB signaling was primarily responsible for the present findings.
To draw accurate conclusions about the cellular and molecular mechanisms of REM sleep homeostatic regulation, the behavioral and physiological processes involved must be selectively activated. We acknowledge that circadian factors influence the regulation of sleep. Thus, this study was designed to minimize the influence of circadian factors, as described in our previous work (Shea et al. 2008; Datta et al. 2015). Experimental procedures for all groups were performed during the same circadian phase to negate potential circadian influences. REM sleep deprivation was performed for only 3 h, a duration that has been suggested to rule out the influence of circadian factors on homeostatic regulatory processes (Borbely et al. 1984; Brunner et al. 1990; Benington and Heller 1994; Benington et al. 1994; Vivaldi et al. 1994; Shea et al. 2008). In addition, selective RSD was performed between 9:00 am and 12:00 pm, the time period when rats have been shown to have minimal non‐REM sleep homeostatic pressure and high expression of REM sleep episodes (Vivaldi et al. 1994; Datta et al. 2015). Importantly, we have shown that this short period of selective RSD is sufficient to produce behavioral and physiological responses consistent with other methods of REM sleep deprivation (Datta et al. 2015). These responses typically include a progressive increase in the number of REM sleep episodes, and an increase in the amount of time spent in REM sleep following the RSD (Dement 1960; Morden et al. 1967; Benington et al. 1994; Vivaldi et al. 1994; Ocampo‐Garces et al. 2000; Werth et al. 2002; Shea et al. 2008). In this study, the VC‐RSD group (Experiment 1) exhibited a 360% increase in the number of REM sleep episodes occurring during selective RSD and a 145% increase in the percent of time spent in REM sleep following selective RSD. We conclude, then, that REM sleep homeostatic processes were activated with limited circadian influences.
Although there is a growing body of literature that implicates BDNF in various regulatory processes, there has been little investigation into BDNF's role in the regulation of REM sleep (Aguado et al. 2003; Faraguna et al. 2008; Guindalini et al. 2014; Wan et al. 2014; Watson et al. 2015). Nonetheless, many of the observed mechanisms of BDNF activity may prove applicable to REM sleep regulation. For example, it has been shown that kainate receptor activation increases BDNF mRNA synthesis (Saarelainen et al. 2001; Jiang et al. 2005). There is also evidence to suggest that activating kainate receptors induces the release of BDNF (Wetmore et al. 1994; Katoh‐Semba et al. 2001; Saarelainen et al. 2001). Autocrine activity of the released BDNF on TrkB receptors is at least partially responsible for the increased BDNF synthesis, since inhibition of TrkB receptors has been shown to suppress the kainate receptor‐mediated increases in BDNF mRNA (Saarelainen et al. 2001; Jiang et al. 2005; Yoshii and Constantine‐Paton 2010). Our lab has shown that the production of spontaneous REM sleep requires kainate receptor activation in the PPT (Datta et al. 2002). The involvement of the kainate receptor leads to a potential mechanism by which PPT neuronal expression of BDNF is adjusted by the activity of PPT neurons. At the onset of REM sleep, kainate receptors in the PPT are activated and initiate the release of BDNF from dendrites. This released BDNF activates TrkB autoreceptors, which in turn increases the synthesis of BDNF. During REM sleep, kainate receptors are continuously activated and the synthesis and release of BDNF remains in theoretical equilibrium until REM sleep ends. However, when REM sleep episodes are prematurely interrupted, the continuous activation of kainate receptors is prevented. Therefore, the BDNF that was released at the onset of the REM sleep episode activates TrkB autoreceptors and increases BDNF synthesis, but the continuous release of BDNF is diminished. The continuation of this process throughout REM sleep deprivation would cause a buildup of BDNF inside the cell. The results presented here support this model, because selective RSD increased BDNF expression, and inhibition of TrkB receptors attenuated this increase in a manner dependent on the dose of K252a that was administered.
There are several other ways in which REM sleep may be impacted by BDNF activity, which support the involvement of BDNF in REM sleep regulation. For example, BDNF has been shown to modulate P/Q‐type calcium channels, which have been implicated in gamma frequency activity in the PPT during REM sleep (Baldelli et al. 2002, 2005; Miki et al. 2013; Garcia‐Rill et al. 2014). Studies have located P/Q‐type voltage‐gated calcium channels in the dendrites of neurons, and gamma band oscillations have been shown to modulate membrane depolarization toward action potential threshold (Pedroarena and Llinas 1997; Rhodes and Llinas 2005; Jones 2007; Llinas et al. 2007). Ultimately, this could allow BDNF to increase the activity of PPT neurons. As BDNF levels increase, BDNF release from the post‐synaptic neuron would become more concentrated, and P/Q‐type calcium channels would progressively reduce the amount of transmitter input needed to cause action potentials in PPT cells. The result would be a progressive increase in the number of REM sleep episodes, indicating REM sleep homeostatic drive. Furthermore, BDNF has been shown to enhance the neuronal release of acetylcholine (ACh) (Knipper et al. 1994; Auld et al. 2001). Since REM‐producing neurons in the PPT are cholinergic, this suggests a mechanism by which increased BDNF can cause increased release of ACh in regions receiving PPT innervation. These regions include REM sleep sign generators, and increased ACh activity in these regions would cause more robust REM sleep episodes, producing REM sleep rebound (Datta and Maclean 2007; Datta et al. 2009b).
Although it may not affect the interpretation of this study, future technical advancement may supplement these results by adding the possible involvement of the LDT. Based on single‐cell activity patterns, the LDT is suspected to be involved in the regulation of REM sleep (Steriade et al. 1990; Datta 1995; Thakkar et al. 1998). The LDT also contains the TrkB.T1 isoform of the TrkB receptor (Watson et al. 2015). Therefore, it would be interesting to examine the relationship between the level of REM sleep drive and BDNF expression in the LDT. However, its small size and close proximity to the aqueduct did not permit examination through existing pharmacological or molecular techniques, such as those used in this study.
These novel findings provide evidence that, in the PPT, BDNF‐TrkB signaling contributes significantly to the homeostatic regulation of REM sleep. Combined with other work on BDNF activity we have illuminated possible mechanisms by which BDNF‐TrkB signaling may instigate REM sleep homeostatic drive and produce REM sleep rebound. Based on the results of this study, it seems reasonable to hypothesize that the REM sleep homeostatic regulation deficits that are seen in neuropsychiatric disorders may, in part, be caused by abnormalities in BDNF signaling. Future work will help elucidate the downstream molecular mechanisms that are stimulated by BDNF‐TrkB activation, and how those mechanisms contribute to REM sleep homeostasis.
Supporting information
Figure S1. Example of the anatomical location of microinjection sites and tissue punch areas.
Table S1. Sleep‐wake behavior on the baseline day.
Acknowledgments and conflict of interest disclosure
This work was supported by the National Institutes of Health Research Grant (MH59839). The content is solely the responsibility of the authors and does not necessarily represent the official views of the National Institutes of Health. We thank Dr. Ralph Lydic, Dr. Helen Baghdoyan, and Dr. Robert Craft for critical discussions and support for this research. We thank Logan A. Chesney and Michael Totty for their technical assistance. SD designed and performed research, analyzed data, and wrote the paper; AKB, RK‐T, JMG, and PAG performed research, analyzed data; AKB co‐wrote the paper. The authors declare no competing financial interests.
References
- Aguado F., Carmona M. A., Pozas E., Aguilo A., Martinez‐Guijarro F. J., Alcantara S., Borrell V., Yuste R., Ibanez C. F. and Soriano E. (2003) BDNF regulates spontaneous correlated activity at early developmental stages by increasing synaptogenesis and expression of the K+/Cl− co‐transporter KCC2. Development 130, 1267–1280. [DOI] [PubMed] [Google Scholar]
- Anderson K. N. and Bradley A. J. (2013) Sleep disturbance in mental health problems and neurodegenerative disease. Nat. Sci. Sleep 5, 61–75. [DOI] [PMC free article] [PubMed] [Google Scholar]
- Auld D. S., Mennicken F., Day J. C. and Quirion R. (2001) Neurotrophins differentially enhance acetylcholine release, acetylcholine content and choline acetyltransferase activity in basal forebrain neurons. J. Neurochem. 77, 253–262. [DOI] [PubMed] [Google Scholar]
- Baghdoyan H. A. and Lydic R. (2012) The Neurochemistry of sleep and wakefulness, in Basic Neurochemistry: Principles of Molecular, Cellular, and Medical Neurobiology, 8th edn (Brady S. T., Siegel G. J., Albers R. W. and Price D. L., eds), pp. 982–999. Academic Press, Burlington. [Google Scholar]
- Baldelli P., Novara M., Carabelli V., Hernandez‐Guijo J. M. and Carbone E. (2002) BDNF up‐regulates evoked GABAergic transmission in developing hippocampus by potentiating presynaptic N‐ and P/Q‐type Ca2+ channels signalling. Eur. J. Neurosci. 16, 2297–2310. [DOI] [PubMed] [Google Scholar]
- Baldelli P., Hernandez‐Guijo J. M., Carabelli V. and Carbone E. (2005) Brain‐derived neurotrophic factor enhances GABA release probability and nonuniform distribution of N‐ and P/Q‐type channels on release sites of hippocampal inhibitory synapses. J. Neurosci. 25, 3358–3368. [DOI] [PMC free article] [PubMed] [Google Scholar]
- Bandyopadhya R. S., Datta S. and Saha S. (2006) Activation of pedunculopontine tegmental protein kinase A: a mechanism for rapid eye movement sleep generation in the freely moving rat. J. Neurosci. 26, 8931–8942. [DOI] [PMC free article] [PubMed] [Google Scholar]
- Benington J. H. and Heller H. C. (1994) REM‐sleep timing is controlled homeostatically by accumulation of REM‐sleep propensity in non‐REM sleep. Am. J. Physiol. 266, R1992–R2000. [DOI] [PubMed] [Google Scholar]
- Benington J. H., Woudenberg M. C. and Heller H. C. (1994) REM‐sleep propensity accumulates during 2‐h REM‐sleep deprivation in the rest period in rats. Neurosci. Lett. 180, 76–80. [DOI] [PubMed] [Google Scholar]
- Borbely A. A., Tobler I. and Hanagasioglu M. (1984) Effect of sleep deprivation on sleep and EEG power spectra in the rat. Behav. Brain Res. 14, 171–182. [DOI] [PubMed] [Google Scholar]
- Brown R. E., Basheer R., McKenna J. T., Strecker R. E. and McCarley R. W. (2012) Control of sleep and wakefulness. Phys. Rev. 92, 1087–1187. [DOI] [PMC free article] [PubMed] [Google Scholar]
- Brunner D. P., Dijk D. J., Tobler I. and Borbely A. A. (1990) Effect of partial sleep deprivation on sleep stages and EEG power spectra: evidence for non‐REM and REM sleep homeostasis. Electroencephalogr. Clin. Neurophysiol. 75, 492–499. [DOI] [PubMed] [Google Scholar]
- Casarotto P. C., Santos P. C., Lucas G. A., Biojone C., Pobbe R. L., Vilela‐Costa H. H., Joca S. R., Guimaraes F. S. and Zangrossi H., Jr (2015) BDNF‐TRKB signaling system of the dorsal periaqueductal gray matter is implicated in the panicolytic‐like effect of antidepressant drugs. Eur. Neuropsychopharmacol. 25, 913–922. [DOI] [PubMed] [Google Scholar]
- Cazorla M., Premont J., Mann A., Girard N., Kellendonk C. and Rognan D. (2011) Identification of a low‐molecular weight TrkB antagonist with anxiolytic and antidepressant activity in mice. J. Clin. Invest. 121, 1846–1857. [DOI] [PMC free article] [PubMed] [Google Scholar]
- Clark C. G., Hasser E. M., Kunze D. L., Katz D. M. and Kline D. D. (2011) Endogenous brain‐derived neurotrophic factor in the nucleus tractus solitarius tonically regulates synaptic and autonomic function. J. Neurosci. 31, 12318–12329. [DOI] [PMC free article] [PubMed] [Google Scholar]
- Datta S. (1995) Neuronal activity in the peribrachial area: relationship to behavioral state control. Neurosci. Biobehav. Rev. 19, 67–84. [DOI] [PubMed] [Google Scholar]
- Datta S. (2000) Avoidance task training potentiates phasic pontine‐wave density in the rat: a mechanism for sleep‐dependent plasticity. J. Neurosci. 20, 8607–8613. [DOI] [PMC free article] [PubMed] [Google Scholar]
- Datta S. (2006) Activation of phasic pontine‐wave generator: a mechanism for sleep‐dependent memory processing. Sleep Biol. Rhythms 4, 16–26. [Google Scholar]
- Datta S. and Desarnaud F. (2010) Protein kinase A in the pedunculopontine tegmental nucleus of rat contributes to regulation of rapid eye movement sleep. J. Neurosci. 30, 12263–12273. [DOI] [PMC free article] [PubMed] [Google Scholar]
- Datta S. and Maclean R. R. (2007) Neurobiological mechanisms for the regulation of mammalian sleep‐wake behavior: reinterpretation of historical evidence and inclusion of contemporary cellular and molecular evidence. Neurosci. Biobehav. Rev. 31, 775–824. [DOI] [PMC free article] [PubMed] [Google Scholar]
- Datta S. and O'Malley M. W. (2013) Fear extinction memory consolidation requires potentiation of pontine‐wave activity during REM sleep. J. Neurosci. 33, 4561–4569. [DOI] [PMC free article] [PubMed] [Google Scholar]
- Datta S., Spoley E. E., Mavanji V. K. and Patterson E. H. (2002) A novel role of pedunculopontine tegmental kainate receptors: a mechanism of rapid eye movement sleep generation in the rat. Neuroscience 114, 157–164. [DOI] [PubMed] [Google Scholar]
- Datta S., Siwek D. F. and Huang M. P. (2009a) Improvement of two‐way active avoidance memory requires protein kinase a activation and brain‐derived neurotrophic factor expression in the dorsal hippocampus. J. Mol. Neurosci. 38, 257–264. [DOI] [PMC free article] [PubMed] [Google Scholar]
- Datta S., Siwek D. F. and Stack E. C. (2009b) Identification of cholinergic and non‐cholinergic neurons in the pons expressing phosphorylated cyclic adenosine monophosphate response element‐binding protein as a function of rapid eye movement sleep. Neuroscience 163, 397–414. [DOI] [PMC free article] [PubMed] [Google Scholar]
- Datta S., O'Malley M. W. and Patterson E. H. (2011) Calcium/calmodulin kinase II in the pedunculopontine tegmental nucleus modulates the initiation and maintenance of wakefulness. J. Neurosci. 31, 17007–17016. [DOI] [PMC free article] [PubMed] [Google Scholar]
- Datta S., Knapp C. M., Koul‐Tiwari R. and Barnes A. (2015) The homeostatic regulation of REM sleep: a role for localized expression of brain‐derived neurotrophic factor in the brainstem. Behav. Brain Res. 292, 381–392. [DOI] [PMC free article] [PubMed] [Google Scholar]
- Dement W. (1960) The effect of dream deprivation. Science. 131, 1705–1707. [DOI] [PubMed] [Google Scholar]
- Dorsey S. G., Renn C. L., Carim‐Todd L., Barrick C. A., Bambrick L., Krueger B. K., Ward C. W. and Tesarollo L. (2006) In vivo restoration of physiological levels of truncated TrkB.T1 receptor rescues neuronal cell death in a trisomic mouse model. Neuron. 51, 21‐28. [DOI] [PubMed] [Google Scholar]
- Dworak M., Kim T., McCarley R. W. and Basheer R. (2011) Sleep, brain energy levels, and food intake: relationship between hypothalamic ATP concentrations, food intake, and body weight during sleep‐wake and sleep deprivation in rats. Somnologie (Berl) 15, 111–117. [DOI] [PMC free article] [PubMed] [Google Scholar]
- Eide F. F., Vining E. R., Eide B. L., Zang K., Wang X. Y. and Reichardt L. F. (1996) Naturally occurring truncated trkB receptors have dominant inhibitory effects on brain‐derived neurotrophic factor signaling. J. Neurosci. 16, 3123–3129. [DOI] [PMC free article] [PubMed] [Google Scholar]
- Elmenhorst D., Basheer R., McCarley R. W. and Bauer A. (2009) Sleep deprivation increases A(1) adenosine receptor density in the rat brain. Brain Res. 1258, 53–58. [DOI] [PMC free article] [PubMed] [Google Scholar]
- Faraguna U., Vyazovskiy V. V., Nelson A. B., Tononi G. and Cirelli C. (2008) A causal role for brain‐derived neurotrophic factor in the homeostatic regulation of sleep. J. Neurosci. 28, 4088–4095. [DOI] [PMC free article] [PubMed] [Google Scholar]
- Franken P. (2002) Long‐term vs. short‐term processes regulating REM sleep. J. Sleep Res. 11, 17–28. [DOI] [PubMed] [Google Scholar]
- Fenner B. M. (2012) Truncated TrkB: beyond a dominant negative receptor. Cytokine & growth factor reviews. 23, 15–24. [DOI] [PubMed] [Google Scholar]
- Garcia‐Rill E., Charlesworth A., Heister D., Ye M. and Hayar A. (2008) The developmental decrease in REM sleep: the role of transmitters and electrical coupling. Sleep 31, 673–690. [DOI] [PMC free article] [PubMed] [Google Scholar]
- Garcia‐Rill E., Kezunovic N., D'Onofrio S., Luster B., Hyde J., Bisagno V. and Urbano F. J. (2014) Gamma band activity in the RAS‐intracellular mechanisms. Exp. Brain Res. 232, 1509–1522. [DOI] [PMC free article] [PubMed] [Google Scholar]
- Gibon J., Barker P. A. and Seguela P. (2016) Opposing presynaptic roles of BDNF and ProBDNF in the regulation of persistent activity in the entorhinal cortex. Mol. Brain 9, 23. [DOI] [PMC free article] [PubMed] [Google Scholar]
- Gottesmann C. and Gottesman I. (2007) The neurobiological characteristics of rapid eye movement (REM) sleep are candidate endophenotypes of depression, schizophrenia, mental retardation and dementia. Prog. Neurobiol. 81, 237–250. [DOI] [PubMed] [Google Scholar]
- Guindalini C., Mazzotti D. R., Castro L. S., D'Aurea C. V., Andersen M. L., Poyares D., Bittencourt L. R. and Tufik S. (2014) Brain‐derived neurotrophic factor gene polymorphism predicts interindividual variation in the sleep electroencephalogram. J. Neurosci. Res. 92, 1018–1023. [DOI] [PubMed] [Google Scholar]
- Gvilia I., Xu F., McGinty D. and Szymusiak R. (2006) Homeostatic regulation of sleep: a role for preoptic area neurons. J. Neurosci. 26, 9426–9433. [DOI] [PMC free article] [PubMed] [Google Scholar]
- Hobson J. A. and Pace‐Schott E. F. (2002) The cognitive neuroscience of sleep: neuronal systems, consciousness and learning. Nat. Rev. Neurosci. 3, 679–693. [DOI] [PubMed] [Google Scholar]
- Huang E. J. and Reichardt L. F. (2003) TrkB receptors: roles in neuronal signal transduction. Annual review of biochemistry. 72, 609–642. [DOI] [PubMed] [Google Scholar]
- Jiang X., Tian F., Mearow K., Okagaki P., Lipsky R. H. and Marini A. M. (2005) The excitoprotective effect of N‐methyl‐d‐aspartate receptors is mediated by a brain‐derived neurotrophic factor autocrine loop in cultured hippocampal neurons. J. Neurochem. 94, 713–722. [DOI] [PubMed] [Google Scholar]
- Jones E. G. (2007) Calcium channels in higher‐level brain function. Proc. Natl Acad. Sci. USA 104, 17903–17904. [DOI] [PMC free article] [PubMed] [Google Scholar]
- Ju Y. Y., Long J. D., Liu Y. and Liu J. G. (2015) Formation of aversive memories associated with conditioned drug withdrawal requires BDNF expression in the amygdala in acute morphine‐dependent rats. Acta Pharmacol. Sin. 36, 1437–1443. [DOI] [PMC free article] [PubMed] [Google Scholar]
- Kase H., Iwahashi K. and Matsuda Y. (1986) K‐252a, a potent inhibitor of protein kinase C from microbial origin. J. Antibiot. (Tokyo) 39, 1059–1065. [DOI] [PubMed] [Google Scholar]
- Katoh‐Semba R., Takeuchi I. K., Inaguma Y., Ichisaka S., Hata Y., Tsumoto T., Iwai M., Mikoshiba K. and Kato K. (2001) Induction of brain‐derived neurotrophic factor by convulsant drugs in the rat brain: involvement of region‐specific voltage‐dependent calcium channels. J. Neurochem. 77, 71–83. [DOI] [PubMed] [Google Scholar]
- Khatami R., Landolt H. P., Achermann P., Adam M., Retey J. V., Werth E., Schmid D. and Bassetti C. L. (2008) Challenging sleep homeostasis in narcolepsy‐cataplexy: implications for non‐REM and REM sleep regulation. Sleep 31, 859–867. [DOI] [PMC free article] [PubMed] [Google Scholar]
- Kilkenny C., Browne W. J., Cuthill I. C., Emerson M. and Altman D. G. (2010) Improving bioscience research reporting: the ARRIVE guidelines for reporting animal research. PLoS Biol. 8, e10000412. [DOI] [PMC free article] [PubMed] [Google Scholar]
- Knipper M., da Penha Berzaghi M., Blochl A., Breer H., Thoenen H. and Lindholm D. (1994) Positive feedback between acetylcholine and the neurotrophins nerve growth factor and brain‐derived neurotrophic factor in the rat hippocampus. Eur. J. Neurosci. 6, 668–671. [DOI] [PubMed] [Google Scholar]
- Knusel B. and Hefti F. (1992) K‐252 compounds: modulators of neurotrophin signal transduction. J. Neurochem. 59, 1987–1996. [DOI] [PubMed] [Google Scholar]
- Kocsis B. (2016) Remembering what you learned: specific brain activity during REM sleep affects memory consolidation. Science 352, 770–771. [DOI] [PMC free article] [PubMed] [Google Scholar]
- Llinas R. R., Choi S., Urbano F. J. and Shin H. S. (2007) Gamma‐band deficiency and abnormal thalamocortical activity in P/Q‐type channel mutant mice. Proc. Natl Acad. Sci. USA 104, 17819–17824. [DOI] [PMC free article] [PubMed] [Google Scholar]
- Martinowich K., Schloesser R. J., Jimenez D. V., Weinberger D. R. and Lu B. (2011) Activity‐dependent brain‐derived neurotrophic factor expression regulates cortistatin‐interneurons and sleep behavior. Mol. Brain 4, 11. [DOI] [PMC free article] [PubMed] [Google Scholar]
- Miki T., Hirai H. and Takahashi T. (2013) Activity‐dependent neurotrophin signaling underlies developmental switch of Ca2+ channel subtypes mediating neurotransmitter release. J. Neurosci. 33, 18755–18763. [DOI] [PMC free article] [PubMed] [Google Scholar]
- Morden B., Mitchell G. and Dement W. (1967) Selective REM sleep deprivation and compensation phenomena in the rat. Brain Res. 5, 339–349. [DOI] [PubMed] [Google Scholar]
- Ocampo‐Garces A., Molina E., Rodriguez A. and Vivaldi E. A. (2000) Homeostasis of REM sleep after total and selective sleep deprivation in the rat. J. Neurophysiol. 84, 2699–2702. [DOI] [PubMed] [Google Scholar]
- Pedroarena C. and Llinas R. (1997) Dendritic calcium conductances generate high‐frequency oscillation in thalamocortical neurons. Proc. Natl Acad. Sci. USA 94, 724–728. [DOI] [PMC free article] [PubMed] [Google Scholar]
- Poe G. R., Walsh C. M. and Bjorness T. E. (2010) Cognitive neuroscience of sleep. Prog. Brain Res. 185, 1–19. [DOI] [PMC free article] [PubMed] [Google Scholar]
- Rhodes P. A. and Llinas R. (2005) A model of thalamocortical relay cells. J. Physiol. 565, 765–781. [DOI] [PMC free article] [PubMed] [Google Scholar]
- Ruegg U. T. and Burgess G. M. (1989) Staurosporine, K‐252 and UCN‐01: potent but nonspecific inhibitors of protein kinases. Trends Pharmacol. Sci. 10, 218–220. [DOI] [PubMed] [Google Scholar]
- Saarelainen T., Vaittinen S. and Castren E. (2001) trkB‐receptor activation contributes to the kainate‐induced increase in BDNF mRNA synthesis. Cell. Mol. Neurobiol. 21, 429–435. [DOI] [PMC free article] [PubMed] [Google Scholar]
- Schmitt K., Holsboer‐Trachsler E. and Eckert A. (2016) BDNF in sleep, insomnia, and sleep deprivation. Ann. Med. 48, 42–51. [DOI] [PubMed] [Google Scholar]
- Shaffery J. P., Allard J. S., Manaye K. F. and Roffwarg H. P. (2012a) Selective rapid eye movement sleep deprivation affects cell size and number in kitten locus coeruleus. Front. Neurol. 3, 69. [DOI] [PMC free article] [PubMed] [Google Scholar]
- Shaffery J. P., Lopez J. and Roffwarg H. P. (2012b) Brain‐derived neurotrophic factor (BDNF) reverses the effects of rapid eye movement sleep deprivation (REMSD) on developmentally regulated, long‐term potentiation (LTP) in visual cortex slices. Neurosci. Lett. 513, 84–88. [DOI] [PMC free article] [PubMed] [Google Scholar]
- Shea J. L., Mochizuki T., Sagvaag V., Aspevik T., Bjorkum A. A. and Datta S. (2008) Rapid eye movement (REM) sleep homeostatic regulatory processes in the rat: changes in the sleep‐wake stages and electroencephalographic power spectra. Brain Res. 1213, 48–56. [DOI] [PMC free article] [PubMed] [Google Scholar]
- Smith C. (1995) Sleep states and memory processes. Behav. Brain Res. 69, 137–145. [DOI] [PubMed] [Google Scholar]
- Stack E. C., Desarnaud F., Siwek D. F. and Datta S. (2010) A novel role for calcium/calmodulin kinase II within the brainstem pedunculopontine tegmentum for the regulation of wakefulness and rapid eye movement sleep. J. Neurochem. 112, 271–281. [DOI] [PMC free article] [PubMed] [Google Scholar]
- Steriade M., Datta S., Pare D., Oakson G. and Curro Dossi R. C. (1990) Neuronal activities in brain‐stem cholinergic nuclei related to tonic activation processes in thalamocortical systems. J. Neurosci. 10, 2541–2559. [DOI] [PMC free article] [PubMed] [Google Scholar]
- Thakkar M. M., Strecker R. E. and McCarley R. W. (1998) Behavioral state control through differential serotonergic inhibition in the mesopontine cholinergic nuclei: a simultaneous unit recording and microdialysis study. J. Neurosci. 18, 5490–5497. [DOI] [PMC free article] [PubMed] [Google Scholar]
- Thakkar M. M., Engemann S. C., Walsh K. M. and Sahota P. K. (2008) Adenosine and the homeostatic control of sleep: effects of A1 receptor blockade in the perifornical lateral hypothalamus on sleep‐wakefulness. Neuroscience 153, 875–880. [DOI] [PubMed] [Google Scholar]
- Van Dort C. J., Zachs D. P., Kenny J. D. et al (2015) Optogenetic activation of cholinergic neurons in the PPT or LDT induces REM sleep. Proc. Natl Acad. Sci. USA 112, 584–589. [DOI] [PMC free article] [PubMed] [Google Scholar]
- Vertes R. P. and Kocsis B. (1997) Brainstem‐diencephalo‐septohippocampal systems controlling the theta rhythm of the hippocampus. Neuroscience 81, 893–926. [DOI] [PubMed] [Google Scholar]
- Vivaldi E. A., Ocampo A., Wyneken U., Roncagliolo M. and Zapata A. M. (1994) Short‐term homeostasis of active sleep and the architecture of sleep in the rat. J. Neurophysiol. 72, 1745–1755. [DOI] [PubMed] [Google Scholar]
- Wan R., Weigand L. A., Bateman R., Griffioen K., Mendelowitz D. and Mattson M. P. (2014) Evidence that BDNF regulates heart rate by a mechanism involving increased brainstem parasympathetic neuron excitability. J. Neurochem. 129, 573–580. [DOI] [PMC free article] [PubMed] [Google Scholar]
- Watson A. J., Henson K., Dorsey S. G. and Frank M. G. (2015) The truncated TrkB receptor influences mammalian sleep. Am. J. Physiol. Regul. Integr. Comp. Physiol. 308, R199–R207. [DOI] [PMC free article] [PubMed] [Google Scholar]
- Werth E., Cote K. A., Gallmann E., Borbely A. A. and Achermann P. (2002) Selective REM sleep deprivation during daytime I. Time course of interventions and recovery sleep. Am. J. Physiol. Regul. Integr. Comp. Physiol. 283, R521–R526. [DOI] [PubMed] [Google Scholar]
- Wetmore C., Olson L. and Bean A. J. (1994) Regulation of brain‐derived neurotrophic factor (BDNF) expression and release from hippocampal neurons is mediated by non‐NMDA type glutamate receptors. J. Neurosci. 14, 1688–1700. [DOI] [PMC free article] [PubMed] [Google Scholar]
- Yoshii A. and Constantine‐Paton M. (2010) Postsynaptic BDNF‐TrkB signaling in synapse maturation, plasticity, and disease. Dev. Neurobiol. 70, 304–322. [DOI] [PMC free article] [PubMed] [Google Scholar]
Associated Data
This section collects any data citations, data availability statements, or supplementary materials included in this article.
Supplementary Materials
Figure S1. Example of the anatomical location of microinjection sites and tissue punch areas.
Table S1. Sleep‐wake behavior on the baseline day.