

Abstract
Recent changes in cannabis policy in the United States have prompted increased interest in cannabis use estimates, and replicability of these estimates. Here, we compare prevalence estimates from two concurrent approaches: (1) standard social survey with audio computer‐assisted self‐interviews at respondent's home (ACASI‐H), derived from the National Surveys on Drug Use and Health (NSDUH), and (2) standard health survey with ACASI assessment in a mobile health examination vehicle (ACASI‐M), derived from National Health and Nutrition Examination Surveys (NHANES), 2005–2012, with essentially the same standardized items in cannabis modules. NHANES ACASI‐M prevalence proportions for recently‐active‐cannabis‐use are an estimated 130–140% larger than corresponding NSDUH ACASI‐H estimates (p < 0.05). In exploratory stratified analyses, we sought to understand these NHANES‐NSDUH differences, and found no differences in lifetime‐history‐of‐cannabis‐use. However, for participants living with others in the same residence, moving cannabis assessment out of the dwelling unit might promote larger recently‐active‐cannabis‐use estimates; no NHANES‐NSDUH differences were found for participants living alone. The observed discrepancies might be non‐ignorable in a policy or program evaluation context. A methods research program will be needed to account for between‐survey differences of the type observed here, perhaps with a focus on within‐residence versus non‐residence assessment as a source of variation.
Keywords: cannabis, NHANES, NSDUH, prevalence, survey
1. INTRODUCTION
In the current era of changing cannabis policies in the United States (US) and globally, valid and reliable epidemiological estimates of lifetime history and recently active cannabis experiences are needed by policy‐makers, program evaluators, and the research community. Opportunities to study replicability of these estimates occur infrequently. Most countries and smaller jurisdictions cannot afford to complete more than one epidemiological survey for replication purposes. For this reason, there generally is a basic working assumption that congruent and replicable cannabis prevalence estimates would be found if a nationally representative sample survey were to be completed twice during a single time interval with the same study population.
For this research project, we identified a chance to study whether nation‐level cannabis use prevalence estimates are replicable and reproducible, and our starting hypothesis was null (i.e. an expectation of no appreciable differences, even though an exact replication of the same point estimates was deemed unlikely). With this hypothesis in mind, the current study compares estimated prevalence for recently active cannabis use, as derived from two national epidemiological surveys of 20 to 49 year old community residents living in the US during 2005–2012.
The most pertinent prior research on this topic involved a comparison of estimates from the 2002 National Surveys on Drug Use and Health (NSDUH) with corresponding 2001–2002 estimates from the National Epidemiologic Survey on Alcohol and Related Conditions (NESARC). In that study, Grucza, Abbacchi, Przybeck, and Gfroerer (2007) found that prevalence estimates for all drug use outcomes were larger in the NSDUH data than in the NESARC data. In their contrast of NSDUH and NESARC, Grucza et al. (2007) drew attention to two main differences in research approach. Namely, the NESARC field operations included pre‐screening of eligible dwelling units (DUs) for face‐to‐face interview assessments, whereas NSDUH had no pre‐screening of eligible DUs. In addition, NSDUH assessments were audio computer‐assisted self‐interviews (ACASI). This was not the case for face‐to‐face interviews in NESARC (Grant et al., 2008; United States, 2012). In this context, we note a large body of methods evidence from survey experiments designed to investigate sources of variation such as matching interviewers to participants by sex and race, as well as various sources of survey error faced when telephone interviews are substituted for in‐person epidemiological survey methods. The result includes some surprising examples of comparability despite methods differences (Richardson, Dohrenwend, & Klein, 1965; Groves et al., 2009; Pemberton et al., 2013).
In the current study, we compare and contrast estimates from the NSDUH and the National Health and Nutrition Examination Surveys (NHANES), both conducted in essentially the same time interval, both using sample designs to provide reliable national estimates, and both assessing cannabis use via ACASI approaches. A difference is that the NSDUH cannabis assessment sessions almost always were in a private location within the participant's DU, whereas NHANES sessions involved a separate appointment, with ACASI assessment completed in a neutral NHANES mobile examination center (MEC) at some distance from the in‐home interview. Sampling frames and plans were comparable in that both NSDUH and NHANES encompassed both household and non‐household group quarters other than institutions, without pre‐screening of the type described for NESARC.
As stated earlier, our working hypothesis was one of no differences across the two surveys in relation to our main overall study contrast for recently active cannabis use, with alpha set at 0.05. After this evaluation, a series of post‐estimation exploratory data analyses was completed to look into potential explanations and subgroup variations, with no advance specification of differences.
2. METHODS
The study populations for NSDUH and NHANES can be conceptualized as equivalent with respect to the non‐institutionalized civilian 20‐to‐49‐year‐old sub‐population members investigated for this research project. Table 1 shows the public use dataset sample sizes by paired years under study for the interval from 2005 through 2012.
Table 1.
Interview setting, mode of administration and questions covering cannabis use. Data for non‐institutionalized civilian 20‐to‐49‐year‐olds in the United States based on the National Surveys of Drug Use and Health and the National Health and Nutrition Examination Survey, 2005–2012
| NHANES | NSDUH | |
|---|---|---|
| Interview Setting and Mode of Administration (In both NHANES and NSDUH, self‐administered ACASI questions cover extra‐medical use of cannabis, cocaine, heroin, and methamphetamine.) | A drug use assessment comparable to that of the NSDUH was completed during a physical examination, within a private room of a Mobile Exam Center, via an Audio Computer Assisted Self Interview (ACASI). In both NHANES and NSDUH, the ACASI approach enables unobserved respondents to hear questions through earphones and also to read questions on the laptop computer screen before entering responses that the field staff members do not see. Respondents move at their own speed and touch the screen to indicate their responses. | The NSDUH ACASI assessment typically was in a private location within the participant's dwelling unit. In NSDUH, a field staff members asks initial survey items (e.g., eliciting demographic information). Then, the ACASI modules are administered, and as in NHANES, the cannabis items are included in these modules with participants hearing questions through earphones and reading questions on the laptop computer screen, with entry of responses by the participants so that staff members cannot see the responses. |
| Ever use items (verbatim) | “The questions are about marijuana and hashish. Marijuana is also called pot or grass. Marijuana is usually smoked, either in cigarettes, called joints, or in a pipe. It is sometimes cooked in food. Hashish is a form of marijuana that is also called ‘hash.’ It is usually smoked in a pipe. Another form of hashish is hash oil. Have you ever, even once, used marijuana or hashish?” | “The next questions are about marijuana and hashish. Marijuana is also called pot or grass. Marijuana is usually smoked, either in cigarettes, called joints, or in a pipe. It is sometimes cooked in food. Hashish is a form of marijuana that is also called “hash.” It is usually smoked in a pipe. Another form of hashish is hash oil. Have you ever, even once, used marijuana or hashish?” |
| Recently active use (verbatim) | “During the past 30 days, on how many days did you use marijuana or hashish?”
VALUES: 1–30. |
“During the past 30 days, on how many days did you use marijuana or hashish?”
RANGE = 1–30 |
2.1. NSDUH 2005–2012
2.1.1. Sampling
Each NSDUH sample was designed to be nationally representative for the US non‐institutionalized civilian population age 12 years and older, based on a multi‐stage area probability sampling approach (United States, 2012). Starting with a composite size measure, states are partitioned geographically into roughly equally sized regions (a total of 900 regions). The first stage of selection begins with the construction of an area sample frame that contains one record for each census tract in the US. Because census tracts generally exceed the minimum DU requirement, one smaller geographic area often is selected within each sampled census tract. For the second stage of sampling, each selected census tract is partitioned into small geographic areas composed of adjacent census blocks. A sample DU in NSDUH refers to either a housing unit or a non‐institutional group quarters listing unit. The survey over‐samples specific subgroups, with analysis weights to take into account this over‐sampling and with post‐stratification adjustments for non‐response. The post‐stratified analysis weights for the 2005 to 2010 surveys are based on population projections from the 2000 census. Those for 2011–2012 surveys are based on 2010 census projections. The NSDUH protocols were reviewed and approved by the cognizant institutional review board for protection of human subjects in research.
2.1.2. Measurements
The NSDUH assessment can be completed in English or Spanish, and both versions have the same content. If the participant preferred to complete the assessment in Spanish, a certified bilingual interviewer was sent to the address to conduct the fieldwork, including instructions for use of the ACASI laptop computers. Because the interview was not translated into any other language, if a participant did not speak English or Spanish, the assessment was not conducted. Among all designated respondents, the proportion who completed NSDUH cannabis assessments described later was ≥70% during the survey years under study.
The variables of central interest are the lifetime history or recently active occurrences of cannabis use. In NSDUH, cannabis questions follow core modules which consist of initial demographic items (which are interviewer‐administered), and modules of self‐administered ACASI questions pertaining to the use of tobacco and alcohol, as well as extra‐medical use of cannabis, cocaine, crack cocaine, heroin, hallucinogens, inhalants, methamphetamine, and prescription‐type drugs. ACASI is intended to promote accuracy and completeness of reporting on sensitive topics. For this reason, ACASI assessment typically is completed in a private location within the participant's DU.
2.2. NHANES 2005–2012
2.2.1. Sampling
Each NHANES replication sample is designed to yield nationally representative sample survey estimates for the US civilian non‐institutionalized population (United States, 2010). As with NSDUH, non‐institutionalized group quarters that do not provide formally authorized supervised care or custody in an institutional setting are included in NHANES sample. The first‐stage selection unit is counties or groups of counties. The second‐stage selection units consist of segments enumerated as census blocks, or groups of blocks. Within each segment, a sample of DUs is selected. The within‐cycle analysis weights take into account specific subgroups that are over‐sampled in order to increase precision of NHANES estimates. For NHANES 2005–2010, the standard population used for post‐stratification adjustments has been the year 2000 population projections from the US Census Bureau. For NHANES 2011–2012, population totals are provided from the 2011 American Community Survey to produce more reliable estimates for the Asian population over‐sampled in NHANES 2011–2012 (United States, 2011). The NHANES protocols were reviewed and approved by the cognizant institutional review board for protection of human subjects in research.
2.2.2. Measurements
All NHANES questionnaires and other assessments are translated into Spanish and can be administered in either English or Spanish based on respondent preference. A large percentage of the NHANES interviewers and all MEC interviewers were bilingual in English and Spanish. Interpreters were used for non‐English/non‐Spanish speaking participants. In 2011, selected survey materials were also translated into Mandarin Chinese, both traditional and simplified, Korean, and Vietnamese. As in the NSDUH, among designated respondents, the proportion who completed cannabis assessments was ≥70%.
The NHANES protocol involves an interview at home, followed by a separate standardized physical examination at a MEC where cannabis use questions are administered as a part of the ACASI drug use assessment module focused on lifetime history and recent use of cannabis, cocaine, heroin, and methamphetamine, as well as injecting drug use.
2.3. Statistical analysis
Analyses for this research project are based on the publicly available NHANES and NSDUH data files. For cannabis, participants were classified as never users, former users (used cannabis at least once in lifetime but not in the 30 days prior to assessment), and recently active users (used cannabis at least once in the 30 days prior to assessment). Prevalence proportions and 95% confidence intervals (CIs) have been derived and calculated from analysis‐weighted data from each survey, with a test statistic for comparison of corresponding estimates from the independent samples of the US populations derived from these surveys. All analyses have been conducted with Stata “svy” software for complex survey data, with analysis weights and Taylor series variance estimation used to derive final estimates.
3. RESULTS
Table 1 offers a description of study‐specific assessment settings and assessments. Table 1 also shows the resemblance of questions administered to assess cannabis use in both NHANES and NSDUH. Bear in mind that, in NHANES, the drug use assessment is completed within a private room of the MEC where the clinically oriented physical exam is conducted, whereas in NSDUH the ACASI assessment typically is completed in a private location within the participant's DU.
Table 2 presents our main estimates for prevalence of recently active cannabis use, survey by survey. In the study's primary contrast, NHANES prevalence estimates for recently active cannabis use are seen to be generally larger than corresponding NSDUH prevalence estimates. In quantitative terms, NHANES yields estimates roughly 130–140% larger than the corresponding NSDUH estimates (p < 0.05). In an exploration of lifetime history as an alternative, we found no appreciable NHANES–NSDUH differences.
Table 2.
Estimated prevalence of cannabis use among non‐institutionalized civilian adults 20–49 years of age: Data for the United States based on the National Surveys of Drug Use and Health and the National Health and Nutrition Examination Surveys, 2005–2012
| Study | Sample size | Former users | Recently active users |
|---|---|---|---|
| Weighted prevalence % (95% CI) | |||
| NSDUH 2005–2006 | 53482 | 45.5 (44.8, 46.3) | 8.2 (7.8, 8.5) |
| NHANES 2005–2006 | 2354 | 49.9 (46.2, 53.5) | 14.0 (10.4, 17.6)* |
| NSDUH 2007–2008 | 54307 | 44.9 (44.2, 45.7) | 8.0 (7.6, 8.3) |
| NHANES 2007–2008 | 2473 | 48.9 (45.1, 52.8) | 13.5 (11.8, 15.2)* |
| NSDUH 2009–2010 | 55156 | 43.9 (43.3, 44.6) | 9.1 (8.7, 9.5) |
| NHANES 2009–2010 | 2658 | 42.2 (38.7, 45.6) | 15.0 (12.6, 17.3)* |
| NSDUH 2011–2012 | 54248 | 42.6 (42.0, 43.3) | 9.7 (9.3, 10.1) |
| NHANES 2011–2012 | 2316 | 44.3 (41.4, 47.2) | 14.7 (11.6, 17.8)* |
Primary hypothesis under study in each replication sample in these years.
Indicates a p value < 0.05
A complete description of exploratory analyses we conducted to look into subgroup variation in these NHANES‐NSDUH differences is provided in our online supplement (Supplementary Material Tables S1–S4). Of special note are exploratory analyses disclosing similar patterns in prevalence estimates for other extra‐medical use of internationally regulated drugs (i.e. any cocaine, heroin, or methamphetamine use; Table S3).
Figure 1 shows what we found by exploring whether larger NHANES estimates for recently active cannabis use might be traced to the possibly more neutral nature of the NHANES MEC, distant from the DU and with no other family members nearby. NHANES–NSDUH differences can be seen for participants who shared a residence with someone else (p < 0.05), but not with participants who lived alone. The forest plots provide a graphical overview of estimates from these stratified analyses, and the meta‐analysis provides a potentially useful summary based on the four sets of independent replication samples from NHANES and NSDUH. Supplementary Material Table S4 shows the complete set of exploratory analyses on the “living with others” versus “living alone” contrasts.
Figure 1.
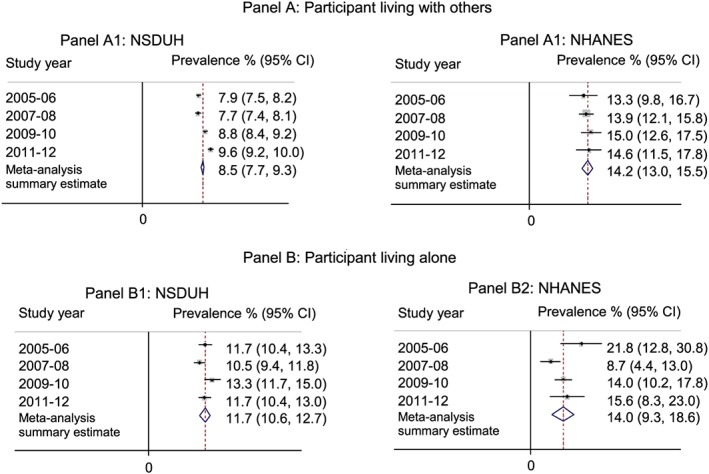
Estimated prevalence of recently active cannabis use, stratified by household composition
4. DISCUSSION
The main findings of this study can be summarized succinctly. First, contradicting our primary null hypothesis as a point of departure, we detected larger NHANES prevalence estimates for recently active cannabis use, on the order of 130% to 140% when compared to corresponding NSDUH estimates. This research project stressed estimates for recently active cannabis use due to current interest in effects of cannabis policy initiatives in the US and elsewhere. Nonetheless, NHANES estimates for other internationally regulated drugs also tended to be larger than NSDUH estimates, but this was not the case for lifetime history of cannabis use.
Post‐estimation exploratory analyses disclosed an additional finding worth special attention. In stratified analyses, we found NHANES–NSDUH differences in the subgroup of participants who lived with others; no NHANES–NSDUH differences were found among individuals living alone. Here, the underlying mechanisms might be traced back to issues such as greater privacy in the NHANES approach of conducting assessments in MECs rather than in the participant's residence (Gfroerer, 1985).
Before more detailed discussion of these results, we must reiterate that the cannabis use assessments in NSDUH and NHANES are based completely upon ACASI self‐reports. There is no toxicological assay as might be used to detect or confirm recent or past cannabis use with high levels of sensitivity and specificity. Even so, this feature of assessment is held constant in the contrast of NHANES and NSDUH; as such, it should not account for the observed NHANES excess prevalence proportions. In addition, we surmise some degree of variation attributable to survey participants' willingness to complete the within‐residence assessments (i.e. no need to leave residence) versus willingness to complete assessments in the NHANES MEC (i.e. at a distance from the residence). In this respect, although both NHANES and NSDUH focused on equivalent US study populations of 20‐to‐49‐year‐olds, the samples assessed at home and those assessed in the NHANES MEC might have heterogeneity that is related to disclosure of cannabis use and possibly other sensitive behaviors.
Notwithstanding study limitations and issues such as these, the study findings are of interest. An exact agreement in cannabis prevalence estimates was not expected, and we thought differences would be minimal due to similarities in research approach. For example, both NSDUH and NHANES recruit large nationally representative samples from the US study population of non‐institutionalized civilian community residents. Their assessments involve standardized independent modularized assessments of cannabis use, as well as other drug use. The two surveys both use ACASI assessment approaches (albeit in different contexts), as well as similarly worded survey items and similar overall participation levels.
Our speculations about possible mechanisms that might account for the observed NHANES–NSDUH differences in estimated prevalence of recently active cannabis use started with the fact that the survey purpose is explained to potential participants in different ways. The NSDUH is introduced as a government‐sponsored survey of “drug use and health.” In contrast, the NHANES is introduced as a government‐sponsored survey of “health and nutrition”.
In theory, there is no need to consider variation in target populations because both surveys designate the same target population. To be sure, different subgroups are over‐sampled in NHANES versus NSDUH, but this feature of research approach includes use of analysis weights as well as post‐stratification adjustment factors (PSAF) to compensate for this variation and to produce more credible estimates for the US study population. (Some variation attributable to PSAF may be present in 2011–2012 estimates, since the PSAF for these years were based on different population projections. Whereas sample size varied widely between both surveys, this difference should influence only the precision of the main estimates.) Speculation about other sources of variation encompasses variations in the backgrounds of field staff employed in the surveys, as well as variations in structure and sequencing of the survey assessment operations. Any or all of these factors might have contributed to the observed variations.
Our exploration of cannabis estimates for those “living alone” versus others prompts us to speculate that moving the assessment away from a residence where others might be present could be important, as might be true for the health context of the NHANES assessment as well. Issues of privacy (or lack thereof) during within‐home drug use assessments have surfaced in prior studies (Anthony, Neumark, & Van Etten, 2000). In a quite recent NSDUH‐focused investigation, Biondo and Chilcoat (2014) made a comparison of prevalence estimates for extra‐medical drug use from the NSDUH, derived using community survey methods, with prevalence estimates from the Monitoring the Future (MTF) survey, for which the data are collected in schools using pencil and paper questionnaires (Johnston, Bachman, O'Malley, & Schulenberg, 2010). The MTF survey done in school setting apparently produced estimated levels of drug use (cannabis, cocaine and prescription pain relievers) that are considerably larger than those obtained from the NSDUH where data are collected in the respondent's DU (or in a nearby private location). Similarly, Brener et al. (2006) have described a setting effect such that students who completed questionnaires in school seem to be more likely to disclose risk behaviors than were students who completed questionnaires at home. These findings raise a possibility that NHANES' movement of the assessment away from the DU might help account for a more complete reporting of sensitive behaviors such as recent cannabis use.
Many other potential speculations are possible, but our thoughts turned to the health context of NHANES. We judge that this health context is noteworthy in that participants undergo medically directed physical examinations as one might experience in a doctor's office. In addition, blood and urine samples are collected. Although participants are aware that NHANES includes no testing for drug use (except for serum cotinine to detect active and secondhand smoke exposure), this health context with collection of bioassays might promote more complete self‐reports.
Prior work investigating the effect of the medical context of a survey for collecting drug use or other sensitive data is scarce, but one example of countervailing evidence was found. Tourangeau, Jobe, Pratt, and Rasinski (1997) investigated whether survey participants might be more willing to discuss sensitive topics (such as abortion) when a medical context reinforced the health‐related purposes of the study. In this report and in a useful detailed chapter (Jobe, Pratt, Tourangeau, Baldwin, & Rasinski, 1997), there is evidence to challenge the idea that it was the health context of the NHANES approach that explains the observed NHANES–NSDUH differences.
In summary, the main discovery from survey research on comparable US study populations is that different estimates of recently active cannabis use can be derived when different health survey approaches are used, although it appears that lifetime history might not be as strongly influenced. The results should help guide researchers who use field survey data in analysis and decision making, and especially in evaluation of alternative cannabis policies' effects on recently active cannabis use. With growing public health importance of cannabis use, and a need to keep track of prevalence trends for policy and health‐related purposes, it may be important to pay more attention to contextual survey features that can influence self‐disclosure of recently active cannabis use in broad population health surveys such as NHANES and NSDUH. Of course, given relatively inexpensive bioassays for recently active cannabis use, methods for high‐stakes evaluations of alternative cannabis policies might shift toward the bioassays, with reduced reliance upon self‐report interview approaches.
DECLARATION OF INTEREST STATEMENT
The authors declare that they have no conflict of interest.
Supporting information
Supplementary Table 1: Estimated prevalence of cannabis use, stratified by age groups: Data for the United States based on the National Surveys of Drug Use and Health and the National Health and Nutrition Examination Survey, 2005–2012.
Supplementary Table 2: Estimated prevalence of cannabis use among adult 20–49 years of age, stratified by sex: Data for the United States based on the National Surveys of Drug Use and Health and the National Health and Nutrition Examination Survey, 2005–2012.
Supplementary Table 3: Prevalence of any cocaine, heroin or methamphetamine use among adults 20–49 years of age: Data for the United States based on the National Surveys of Drug Use and Health and the National Health and Nutrition Examination Survey, 2005–2012.
Supplementary Table 4: Estimated prevalence of cannabis use, stratified by household composition: Data for the United States based on the National Surveys of Drug Use, 2005–2012.
Supporting info item
ACKNOWLEDGMENTS
The authors wish to acknowledge the project's funding sources (NIDA T32 DA021129 [to OA with JCA as the PI], K05DA015799 [JCA], and NCCIH K99AT009156 [OA]). Michigan State University support also is acknowledged for both authors. The content is the sole responsibility of the authors and does not necessarily represent the official views of Michigan State University, the National Institute on Drug Abuse, the National Center for Complementary and Integrative Health or the National Institutes of Health.
Alshaarawy O, Anthony JC. The replicability of cannabis use prevalence estimates in the United States. Int J Methods Psychiatr Res. 2017;26:e1524 10.1002/mpr.1524
Funding Information: This research was supported by the National Institute on Drug Abuse and the National Center for Complementary and Integrative Health.
REFERENCES
- Anthony, J. C. , Neumark, Y. D. , & Van Etten, M. L. (2000). Do I do what I say? A perspective on self‐report methods in drug dependence epidemiology. The science of self‐report: Implications for research and practice (pp. 175–198). Englewood Cliffs, NJ: Lawrence Earlbaum Associates. [Google Scholar]
- Biondo, G. , & Chilcoat, H. D. (2014). Discrepancies in prevalence estimates in two national surveys for nonmedical use of a specific opioid product versus any prescription pain reliever. Drug and Alcohol Dependence, 134, 396–400. [DOI] [PubMed] [Google Scholar]
- Brener, N. D. , Eaton, D. K. , Kann, L. , Grunbaum, J. A. , Gross, L. A. , Kyle, T. M. , et al. (2006). The association of survey setting and mode with self‐reported health risk behaviors among high school students. Public Opinion Quarterly, 70(3), 354–374. [Google Scholar]
- Gfroerer, J. (1985). Influence of privacy on self‐reported drug use by youths In Self‐report methods of estimating drug use: Meeting current challenges to validity, NIDA Research Monograph Number 57 (pp. 22–30). Bethesda, MD: National Institute on Drug Abuse. [PubMed] [Google Scholar]
- Grant, B. F. , Chou, S. P. , Goldstein, R. B. , Huang, B. , Stinson, F. S. , Saha, T. D. , … Ruan, W. J. (2008). Prevalence, correlates, disability, and comorbidity of DSM‐IV borderline personality disorder: results from the Wave 2 National Epidemiologic Survey on Alcohol and Related Conditions. The Journal of Clinical Psychiatry, 69(4), 533–545. [DOI] [PMC free article] [PubMed] [Google Scholar]
- Groves, R. M. , Fowler, F. J. Jr. , Couper, M. P. , Lepkowski, J. M. , Singer, E. , & Tourangeau, R. (2009). Survey methodology (Vol. 561). Chichester: John Wiley & Sons. [Google Scholar]
- Grucza, R. A. , Abbacchi, A. M. , Przybeck, T. R. , & Gfroerer, J. C. (2007). Discrepancies in estimates of prevalence and correlates of substance use and disorders between two national surveys. Addiction, 102(4), 623–629. [DOI] [PMC free article] [PubMed] [Google Scholar]
- Jobe, J. B. , Pratt, W. F. , Tourangeau, R. , Baldwin, A. K. , & Rasinski, K. A. (1997). Effects of interview mode on sensitive questions in a fertility survey In Lyberg L., Biemer P., Collins M., de Leeuw E., Dippo C., Schwarz N., & Trewin D. (Eds.), Survey measurement and process quality (pp. 311–329). New York: John Wiley. [Google Scholar]
- Johnston, L. D. , Bachman, J. G. , O'Malley, P. M. , & Schulenberg, J. E. (2010). Monitoring the Future: a continuing study of American youth (12th‐grade survey). ICPSR28401‐v1. Ann Arbor, MI: Inter‐university Consortium for Political and Social Research. [Google Scholar]
- Pemberton, M. R. , Bose, J. , Kilmer, G. , Kroutil, L. A. , Forman‐Hoffman, V. L. , & Gfroerer, J. C. (2013). Comparison of NSDUH health and health care utilization estimates to other national data sources. CBHSQ data review. Rockville, MD: Substance Abuse and Mental Health Services Administration, Center for Behavioral Health Statistics and Quality. [PubMed] [Google Scholar]
- Richardson, S. A. , Dohrenwend, B. S. , & Klein, D. (1965). Interviewing: Its forms and functions. New York: Basic Books. [Google Scholar]
- Tourangeau, R. , Jobe, J. B. , Pratt, W. F. , & Rasinski, K. (1997). Design and results of the Women's Health Study. NIDA Research Monographs, 167, 344–365. [PubMed] [Google Scholar]
- United States. National Center for Health Statistics . (2010). National health and Nutrition Examination Survey. US Department of Health and Human Services, Centers for Disease Control and Prevention, National Center for Health Statistics. Chicago.
- United States. Department of Commerce. Census Bureau . (2011). American Community Survey. Washington, DC.
- United States Department of Health and Human Services. Substance Abuse and Mental Health Services Administration. Center for Behavioral Health Statistics and Quality . (2012). Results from the 2010 National Survey on Drug Use and Health: Summary of National Findings, NSDUH Series H‐41, HHS Publication No.(SMA) 11–4658. Rockville, MD: http://www.samhsa.gov/data/sites/default/files/NSDUHNationalFindingsResults2010-web/2k10ResultsRev/NSDUHresultsRev2010.pdf. last accessed 13 September 2016 [Google Scholar]
Associated Data
This section collects any data citations, data availability statements, or supplementary materials included in this article.
Supplementary Materials
Supplementary Table 1: Estimated prevalence of cannabis use, stratified by age groups: Data for the United States based on the National Surveys of Drug Use and Health and the National Health and Nutrition Examination Survey, 2005–2012.
Supplementary Table 2: Estimated prevalence of cannabis use among adult 20–49 years of age, stratified by sex: Data for the United States based on the National Surveys of Drug Use and Health and the National Health and Nutrition Examination Survey, 2005–2012.
Supplementary Table 3: Prevalence of any cocaine, heroin or methamphetamine use among adults 20–49 years of age: Data for the United States based on the National Surveys of Drug Use and Health and the National Health and Nutrition Examination Survey, 2005–2012.
Supplementary Table 4: Estimated prevalence of cannabis use, stratified by household composition: Data for the United States based on the National Surveys of Drug Use, 2005–2012.
Supporting info item