Abstract
The use of cardiac ultrasound is fundamental to the understanding of normal heart function and crucial to pathophysiological diagnosis. The growing availability of 3D echocardiography (3DE) over the last decade has allowed its applications to expand from establishing reference values for chamber size and elucidating ventricular mechanics, to assessing valvular disease severity and playing pivotal roles in interventional procedures. Several important advantages of 3DE include eliminating geometric assumptions, quantifying complex geometric shape volumes, viewing structures from any perspective, assessing lesion in simultaneous multiplanes or multislice mode, all of which are not possible with traditional 2D echocardiography (2DE). Real-time 3DE has been shown to be simple, accurate, reproducible, and versatile, and generally has superior outcome prognosis compared to the 2DE.
Keywords: 3D echocardiography, Chamber mechanics, Valvular lesions
INTRODUCTION
Over the past 4 decades, echocardiography has become the quintessential diagnostic instrument for cardiologists to noninvasively assess cardiac structure and function, and to make important clinical decisions. Pioneers in the field early demonstrated the utility of one-dimensional motion mode (M-Mode) to identify various structural heart disease and classify severity using two-dimensional echocardiography (2DE). To better understand human anatomy, researchers Olaf von Ramm and Stephen Smith at Duke University School of Biomedical Engineering invented the three-dimensional (3D) ultrasound prototype in the early 1990s.1 With new found advantages over its predecessor, 3D echocardiography (3DE) was commercialized and found its way to major ultrasound laboratories in the early 2000s. The initial 3DE required labor-intensive off-line analysis to reconstruct 3D structures from 2D images.2,3 The improved capability of real-time 3DE includes visualization of heart structures with depth, assessment of cardiac lesions from any perspective, and quantification of volumes without geometric assumption. The technology enables accurate, precise, detailed understanding of the pathophysiologic nature of diseases. 3DE data acquisition includes simultaneous multiplane mode, real-time 3D mode narrow sector, focused wide sector-zoom mode, full volume-gated acquisition, and full volume with color flow Doppler.4 In this review, we will summarize the practical applications and incremental values of 3DE over traditional 2DE.
3D CHAMBER QUANTIFICATION
Left ventricle
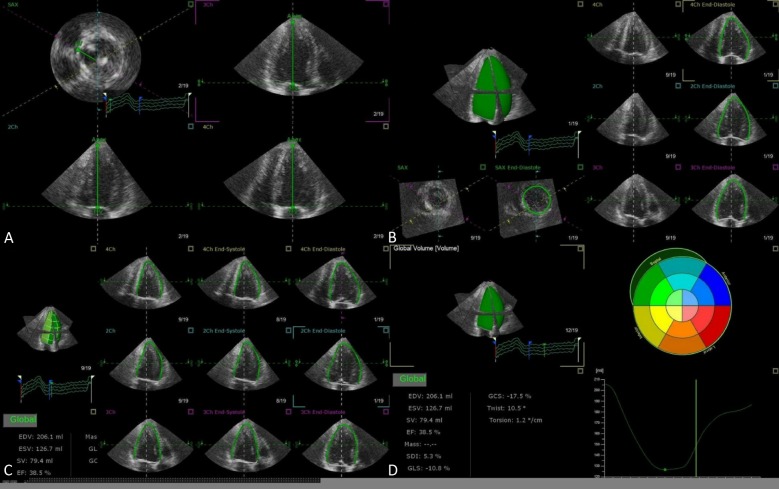
Accuracy of echocardiographically measured left ventricular (LV) volumes is imperative for improved knowledge of LV status. Studies have shown that LV volumes and LV ejection fractions are predictive for future cardiovascular outcomes in patients with various cardiac conditions. However, in 2DE, the left ventricle is assumed to have ellipsoid shape and LV volumes are calculated based on supposed geometry. 2DE derived LV chamber sizes have been consistently underestimated compared to the gold standard cardiac magnetic resonance (CMR). To the contrary, 3DE has the advantages of full-volume acquisition with established accuracy and reproducibility, and has been shown to be better correlated with CMR measured volumes with less underestimation (Table 1).5-8 In 3DE, the LV end-diastolic volume (EDV) and end-systolic volume (ESV) are measured by semi-automatic border delineation in 3D space with manual adjustment when required (Figure 1). In cases where border delineation is still difficult owing to trabeculae or poorly defined with 3DE imaging, contrast agents maybe infused to enhance LV opacification. The 3DE eliminates geometric assumption or circumvents foreshortened views that are the common source of errors in 2DE. In addition, several studies have shown that LV mass determined by 3DE also correlated better with CMR compared to 2DE with CMR (Table 2).9-14
Table 1. Comparison of left ventricular volume between 2D/3D echocardiography and cardiac magnetic resonance.
| Studies | Subjects | n | 3DE vs. CMR | 2DE vs. CMR | ||||||||||
| EDV (ml)* | p | ESV (ml)* | p | EF (%)* | p | EDV (ml)* | p | ESV (ml)* | p | EF (%)* | p | |||
| Jenkins et al.,JACC 2004 | Mixed patients | 50 | -4 ± 29 | 0.31 | -3 ± 18 | 0.23 | 0 ± 7 | 0.74 | -54 ± 33 | < 0.01 | .-28 ± 28 | < 0.01 | -1 ± 13 | 0.76 |
| Caiani et al.,JASE 2005 | Mixed patients | 46 | .-4.1 ± 30 | ns | -3.5 ± 34 | ns | -0.8 ± 14 | ns | -23.1 ± 86 | < 0.001 | -18.7 ± 60 | < 0.001 | 3.7 ± 16 | < 0.001 |
| Jacobs et al.,Eur Heart J 2006 | Mixed patients | 50 | -14 ± 17 | < 0.05 | -6.5 ± 16 | < 0.05 | -1 ± 6.4 | 0.27 | -23 ± 29 | < 0.05 | -15 ± 24 | < 0.05 | 0.8 ± 8.5 | 0.57 |
| Greupner et al.,JACC 2012 | Mixed patients | 36 | -18.3 ± 0.7 | 0.004 | -13 ± 13.5 | 0.005 | 2.7 ± 1.2 | ns | -25.8 ± 6 | < 0.001 | -14.3 ± 18.2 | 0.002 | 0.7 ± 1.3 | ns |
CMR, cardiac magnetic resonance; EDV, end-diastolic volume; EF, ejection fraction; ESV, end-systolic volume; ns, not significant; 2D, two-dimensional; 2DE, two-dimensional echocardiography; 3D, three-dimensional; 3DE, three-dimensional echocardiography.
* Mean difference between 3DE or 2DE, and MRI.
Figure 1.
Representative case of LV quantification step-by-step using TomTec 4D LV Analysis software. View alignment (A), Beutel revision (B), Tracking revision (C), Analysis (D). LV, left ventricular.
Table 2. Comparison of left ventricular mass between 2D/3D echocardiography and cardiac magnetic resonance.
| Studies | Subjects | n | 3DE vs. CMR* | 2DE vs. CMR* | ||||
| Bias | LOA | r | Bias | LOA | r | |||
| Qin et al., Echocardiogr 2000 | Mixed | 19 | -9 | 66 | 0.97 | |||
| Jenkins et al., JACC 2004 | Mixed | 50 | 0 | 76 | 0.87 | 16 | 114 | 0.85 |
| Mor-Avi et al., Circulation 2004 | Mixed | 21 | -4 | 34 | 0.90 | -39 | 58 | 0.79 |
| Oe et al., Am J Cardiol 2005 | LV hypertrophy | 20 | -14.1 | 58.2 | 0.94 | -10.7 | 167.4 | 0.70 |
| Caiani et al., Heart 2006 | Mixed | 46 | -2.1 | 23 | 0.96 | -34.9 | 49.6 | 0.79 |
| Takeuchi et al., JASE 2008 | Mixed | 55 | -1 | 6 | 0.95 | |||
| Mizukoshi et al., JASE 2016 | Mixed | 57 | -4.8 | 27.7 | 0.96 |
LOA, limits of agreement. * Bias and LOA are given in grams. Abbreviations are in Table 1.
More accurate LV mass measurement correlated better with prognostic data and was shown to be a surrogate marker in anti-hypertensive medication outcome trials.15 For serial follow-up of LV volumes and EF, studies also showed more consistent results when assessed by 3DE than 2DE. In the evaluation of coronary artery disease, 3DE provides an improved likelihood of detecting regional wall motion abnormality.16 Traditional 2DE has pre-specified imaging planes that show limited information from the whole LV myocardium. To the contrary, 3DE has the ability to display all myocardial segments simultaneously in multi-level slices, offering a comprehensive assessment of the entire LV myocardial performance.
Left atrium
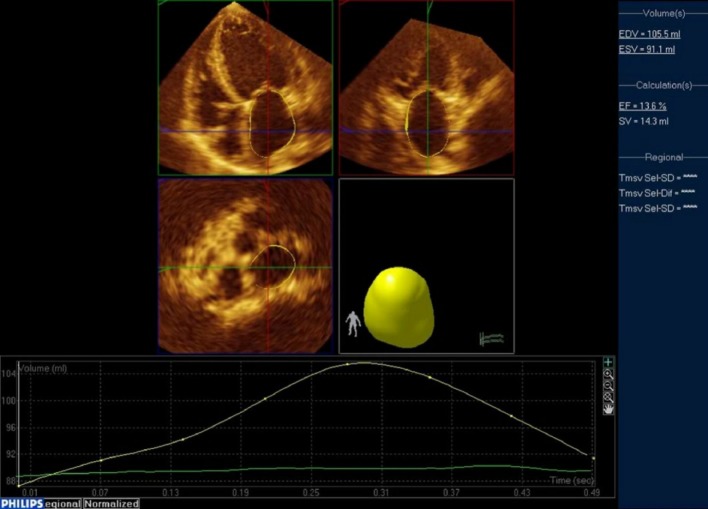
Recent advances in 3DE has extended chamber quantifications to the left atrial (LA) volume (Figure 2). Remodeling of the left atrium is caused by LV volume or pressure overload; therefore, the LA volume reflects the severity and chronicity of underlying pathophysiologic conditions rather than instantaneous elevation of LV filling pressure. Thus, the degree of LA dilatation is closely coupled with cardiac disease severity.17 Compared to 2DE, 3DE determined LA volumes more closely approximate CMR-derived LA counterparts.18 In a recently published study, 3DE determined LA volumes were powerful predictors of future cardiac events, and minimal LA volumes tended to carry a stronger prognostic value over maximal LA volumes.19
Figure 2.
Representative case of LA quantification using Philips QLab. From the full-volume datasets, 2 orthogonal long-axis and 1 short-axis views of the LA at end-diastole and end-systole were selected. The software automatically determined the LA wall in 3D space using the deformable shell model and made time domain LA volume curve, from which maximal and minimal LA volumes. Manual adjustment when inadequate tracking of the LA wall was observed. LA, left atrial.
Right ventricle
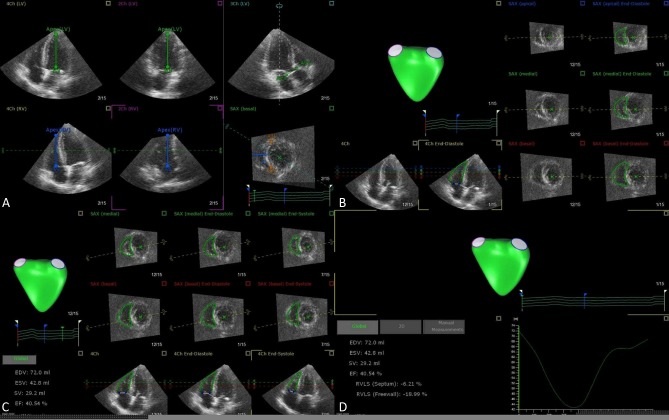
The right ventricle (RV) has an irregular border and complex 3D shape, and therefore it is impossible to quantify RV volumes using 2D imaging planes. 3DE holds good promise to RV volumetric analysis. The advantages of 3DE are fast acquisition, independent of geometric assumptions, semi-automated border detection, and dynamic RV cast visualization using dedicated software (Figure 3). Studies have shown that 3DE determined RV volumes and function correlated well with CMR, with good reproducibility (Table 3).20-25 Recently, normal range of RV volumes and ejection fraction have been established (Table 4).21,26,27 However, their prognostic values for different diseases remain to be clarified.28 There exists certain limitation for RV quantification since RV outflow wall is in close proximity to the sternum or chest wall, and occasionally dropout of the wall precludes accurate estimation of RV volumes. In addition, 3DE cannot image the entire right ventricle in patients with severely dilated RV.
Figure 3.
Representative case of RV quantification step-by-step using TomTec 4D RV Analysis software. View adjustment (A), Beutel revision (B), Tracking revision (C), Analysis (D). RV, right ventricular.
Table 3. Comparison of right ventricular volume between 3D echocardiography and cardiac magnetic resonance.
| Studies | Subjects | n | EDV (ml)* | ESV (ml) | EF (%) | Feasibility (%) |
| Jenkins et al., Chest 2007 | AMI | 50 | -3 ± 10 | -4 ± 7 | 2 ± 4 | 100 |
| Grapsa et al., Eur J Echocardiogr 2010 | PAH | 60 | -4 (-11, 4) | 0 (-6, 6). | -1 (-3, 0) | 100 |
| Sugeng et al., JACC Imaging 2010 | Mixed | 28 | -14 (-28, 0) | -9 (-19, 1) | -2 (-4, 0) | 93 |
| van der Zwaan et al., JASE 2010 | CHD | 50 | -34 (-43, -25) | -11 (-19, 3) | -4 (-6, -2) | 81 |
| Leibundgut et al., JASE 2010 | Mixed | 88 | -10 (-15, -6) | -5 (-8, -1) | 0 (-2, 1) | 88 |
| Medvedofsky et al., JASE 2015 | Mixed | 147 | -11 ± 20 | -0.3 ± 15 | -3 ± 8 | 89 |
AMI, acute myocardial infarction; CHD, congenital heart disease; EDV, end-diastolic volume; EF, ejection fraction; ESV, end-systolic volume; PAH, pulmonary arterial hypertension.
* Mean difference between 3DE and MRI, with mean ± SD, with 95% confidence interval.
Table 4. Determination of normal values of right ventricular volume.
| Studies | Subjects | n | EDV (ml)* | ESV (ml)* | EF (%)* | Feasibility (%) |
| Graspa et al., Eur J Echocardiogr 2010 | Normal | 20 | 88 ± 17 | 37 ± 8 | 61 ± 4 | 100 |
| Tamborini et al., JASE 2010 | Normal | 245 | 86 ± 21 | 29 ± 11 | 67 ± 8 | 94 |
| Maffessanti et al., Circ Imaging 2013 | Normal | 507 | 91 (61, 150) | 35 (16, 72) | 62 (47, 77) | 94 |
EDV, end-diastolic volume; EF, ejection fraction; ESV, end-systolic volume.
* Mean ± SD, or with 95% confidence interval.
VOLUMETRIC COLOR DOPPLER IMAGING
Color Doppler imaging has been integral to valve disease severity evaluation since the dawn of 2DE. However, the size of the vena contracta width (VCW) often varies greatly depending on the views used to obtain the regurgitant jet. In the age of 3DE, a more precise assessment of the valvular lesion uses en face view to directly visualize the vena contracta area (VCA). Accurate and reproducible assessment of valvular heart disease severity is important for clinical decision, management strategies, and prognostication. Previous studies comparing 3DE VCA and 2DE VCW to reference standards such as CMR or cardiac catheterization grading have uniformly demonstrated higher accuracy by 3DE.29 The presence of complex noncircular or multiple orifices, or both, has implications for 2DE limitations in the assessment of the VCW and proximal isovelocity surface area (PISA), when 3DE color Doppler imaging is capable of visualizing non-circumferential VCA, non-spherical PISA, or multiple orifices simultaneously.
SPECKLE-TRACKING ECHOCARDIOGRAPHY
Although 2D speckle-tracking echocardiography (STE) has established its role in the assessment of chamber mechanics, there are limitations such as inaccurate quantification of myocardial deformation when a foreshortened view is used. In addition, LV contracts by complex 3D movement with simultaneous twisting motion and descent of the base towards the apex. Fixed 2D cutting planes lose speckles during frame-by-frame speckle-tracking analysis during through-plane motion of the heart. In 3D STE, speckles of the entire myocardium are tracked omnidirectionally in 3D space and therefore out-of-plane motion speckle-tracking errors are theoretically eliminated.30 3D STE can simultaneously provide the three orthogonal strain values, radial strain, longitudinal strain (LS), circumferential strain (CS), with additional 3D area strain and area change ratio (ACR), which measure area tracking-based deformation (Figure 4).31 The utility of 3D area strain and ACR to track myocardial motion is gaining popularity alongside with its components of CS and LS. ACR has been shown to be a sensitive parameter for patients with early stage heart failure, in detecting subtle LV systolic dysfunction in patients with hypertension, aortic valve disease, and patients undergoing chemotherapy. In the study to evaluate which strain parameter by 2DE and 3DE could prognosticate adverse cardiovascular events in patients with asymptomatic aortic stenosis, 3D global LS emerged as the most robust index for predicting future events.32
Figure 4.
After region of interests are marked manually, software automatically traced on the endocardial border. Manual adjustments are required when software border detection are suboptimal. Next, epicardial border are manually determined for region of interest. The computer then analyzes 3D speckle-tracking in frame-by-frame analysis with a final 17-segment bull’s eye map of strain values displayed. Longitudinal strain (A), circumferential strain (B), and area strain (C).
Twist and torsion
The helical nature of LV myocardial fibers consist of right-handed obliquely oriented endocardium, circumferentially orientated mid-myocardium, and left-handed obliquely oriented epicardium. Viewing from the cardiac apex, the LV contraction is described as the spiral squeeze by concurrent apical counter-clockwise rotation and basal clockwise rotation.33 The LV twist is the summation of the apical rotated degree added to the basal rotated degree, and the LV torsion is the twist in degrees normalized by the long-axis distance between the apex and the base.34 LV twist and torsion have been well-studied by 2D STE for the wringing motion of the heart. However, the results are tampered by the inherent limitations of tracking speckles in 2D planes. In the era of 3D STE, more accurate LV torsion can be calculated through the simultaneous measurement of rotations in the basal and apical short-axis planes, and the distance between the planes.35 And the 3D STE determined values allow the accurate understanding of age-dependency change of LV systolic twist, LV diastolic untwisting, and age-dependency change of LV mechanics.
Wall motion abnormalities
There are potential errors in the assessment of regional hypokinesia when evaluating patients with coronary artery disease using fixed cutting planes by 2DE to assess ischemic territory. In addition, visual evaluation of wall motion is subjective and poorly reproducible, and study has shown that myocardial deformation index using strain and strain rate maybe superior to wall motion analysis.36 Accordingly, 2D strain remains inherently limited as earlier mentioned. In 3DE, since all LV walls are encompassed in the full-volume datasets, there are unlimited planes to analyze wall motion defect. Using multiplanes to simultaneously display of a number of short-axis tomographic slices in 3DE, subtle wall motion abnormality of LV segments might be visualized. Furthermore, 3D STE provides reproducible quantification of wall motion and allows the analysis of new myocardial deformation markers with 3D area strain that closely correlates with LVEF.37 The LV deformation parameters can be assessed by single-beat full-volume 3DE datasets with 3D STE software, irrespective of whether the heart rhythm is regular in sinus rhythm or irregular in atrial fibrillation. Volumetric 3D STE therefore offers a simple, feasible, and reproducible method to measure and analyze both regional and global longitudinal, circumferential, radial, and area strains for patients with ischemic heart disease.
LV mechanical dyssynchrony
Intraventricular conduction defect, predominantly in the form of complete left bundle branch block, exists in one-fourth of heart failure patients.38 The prolonged interventricular and intraventricular conduction causes regional mechanical delay and dyssynchronized LV contraction, exacerbates LV function, decreases LV ejection fraction, and results in ventricular remodeling and increased mortality. An important criteria to select patients for cardiac resynchronization therapy (CRT) is measuring the LV septal-to-posterior wall motion dyssynchrony by 2DE. The widely accepted criteria however, was associated with a 20-30% non-responder rate, and was confirmed not to be a robust parameter in randomized trial.39 Efforts have been made to identify more accurately the potential responders to CRT in these patients. 3DE has been proposed as a better modality to potentially more accurately quantify LV mechanical dyssynchrony (LVMD). A new dyssynchrony index, by calculating the time taken to reach minimum regional volume for each segment as a percentage of the cardiac cycle was proposed and systolic dyssynchrony index (SDI), is defined as the standard deviation of these timings expressed as a percentage of the duration of cardiac cycle rather than in milliseconds.40 The LVMD quantification by 3DE was shown to be reproducible between centers, and SDI was an excellent predictor of response to CRT in the target population irrespective of QRS morphology and duration,41 albeit with lower temporal and spatial resolution compared to 2DE.42
VALVULAR HEART DISEASE
Mitral valve disease
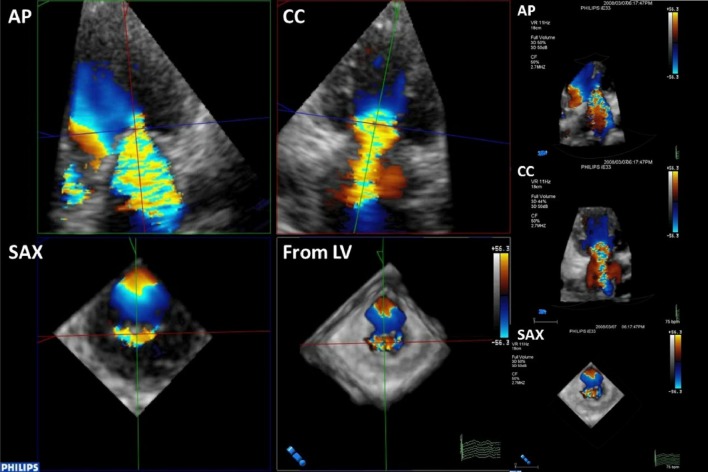
Since mitral valve apparatus is a complex saddle-shaped structure, it has been shown to be better visualized by 3DE than 2DE imaging.43 The mitral valve area by planimetry is more accurate through 3DE compared to 2DE when quantifying stenosis, and has good agreement with mitral orifice area calculations by the Gorlin formula from cardiac catheterization, and lower intraobserver and interobserver variability.44 The simpleacquisition and on-line review of 3D images allows for immediate post percutaneous balloon mitral valvuloplasty assessment of mitral valve commissural splitting, tearing, stretching, and severity of mitral valve regurgitation. To determine the severity of mitral regurgitation (MR), some inconsistencies in the traditional assessment of VCW using different 2D images were found. Using 3DE, the severity of MR is quantified by size of VCA. Since VCA is often not circular, and in fact ellipsoidal when viewed en face by 3DE (Figure 5), direct visualization of VCA is more accurate to calculate effective regurgitant orifice area (EROA) and to grade MR severity.
Figure 5.
Mitral valve regurgitation visualized as vena contracta width (VCW) along the long axis of mitral regurgitation jet in anterior-posterior (AP) and commissure-commissure (CC) views and as vena contracta area (VCA) along short-axis (SAX) view in transesophageal 3DE. The VCA is seen not circular but ellipsoidal inen face SAX view.
Aortic valve disease
Appreciation of aortic valve cusps as trileaflets or bileaflets is important as part of routine echocardiography and evaluation of aortic stenosis in patients planning for surgical or transcatheter aortic valve replacement. Using 3DE on-screen X-plane and 3D dataset, the smallest valve opening at the valve tip can be obtained by optimal alignment, then traced by planimetry for the true aortic stenosis area, and correlated better compared to the area derived by 2DE with invasive Gorlin formula.45 Instead of geometric assumption for left ventricular outflow tract (LVOT) shape in 2DE, 3DE data showed that cross-sections of LVOT and aortic annulus often are not circular but ellipsoidal (Figure 6).46,47 In addition, while LVOT flow relies on non-simultaneous measurement with stenotic aortic valve flow in 2DE, 3DE concurrently calculates both parameters therefore should be more accurate when applied to continuity equation. In fact, 3DE is more accurate than 2DE to grade severity of aortic stenosis compared to the standard by cardiac catheterization. Using the function to subtract tissue signal in 3DE, en face view of aortic regurgitation (AR) VCA was frequently shown to be noncircular. Moreover, aortography graded AR correlated well with 2DE measurements of VCW, but correlated better with 3DE measurements of VCA. With eccentric AR jet, a 3D dataset can be frozen in diastole to perform an offline multiplane reconstruction and optimally orient to the transverse view to obtain the optimal EROA. Further study has also demonstrated that 3DE derived PISA and AR jet velocity for the calculation of AR volumes are more accurate than conventional 2DE method with hemispheric PISA assumption.48
Figure 6.
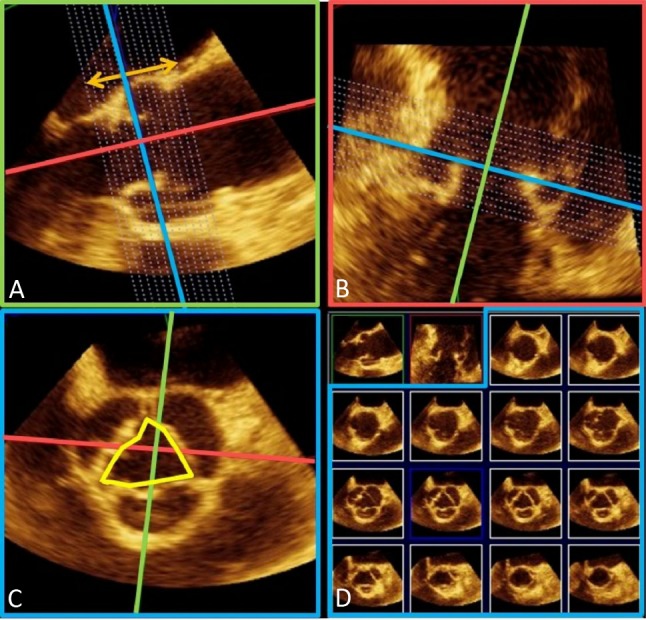
Assessment of aortic root by transesophageal 3D echocardiography. As seen in the last row of panel (D), the en face cross-sectional view of aortic annulus is oval rather than circular.
3D TRANSESOPHAGEAL ECHOCARDIOGRAPHY
Transesophageal echocardiography is capable of superior quality of cardiac imaging owing to the close proximity of the probe to the heart, and without the intervening bones and lung tissues. Using 3D dataset, transesophageal 3DE offers unlimited perspective over previous standard cutting planes by transesophageal 2DE. Due to its invasive nature, it is indicated in certain clinical assessments such as en face views of aortic and mitral valve leaflet lesions, that complements the assessment by transthoracic 3DE (Table 5). MV has a complex anatomy that includes 3 subunits: the annulus, the leaflets, and the subvalvular apparatus. The MV annulus is a saddle-shaped semi-circular fibrous ring that alters its shape continuously during the cardiac cycle. The MV leaflets consist of 3 anterior and 3 posterior scallops, and medial and lateral commissures. Failure of any of the MV leaflet component to coapt properly can result in MR. Accurate knowledge of the MV scallop or commissure pathology gives the physicians and surgeons the opportunity to plan ahead. Transesophageal 3DE offers the so-called surgical view which is exactly what surgeons see when opening the heart.
Table 5. Comparison of transesophageal and transthoracic 3D echocardiography.
| Modalities | Advantages | Chamber assessment | Valvular lesions | Special considerations | Interventional guidance |
| Transesophageal 3DE | Unobstructed views, close to structures | LA, LV, RV | MV, AV, TV | 3D STE | TAVR, MV clip, LAA occlusion |
| Transthoracic 3DE | Convenient, noninvasive, repeat study as needed | LA, LA, RV | MV, AV, TV | Contrast 3DE, 3D STE, Stress 3DE |
AV, aortic valve; LA, left atrium; LAA, left atrial appendage; LV, left ventricle; MV, mitral valve; RV, right ventricle; TAVR, transcatheter aortic valve replacement; TV, tricuspid valve; 3DE, 3D echocardiography; 3D STE, three-dimensional speckle-tracking echocardiography.
The aortic root complex is composed of the sinuses of Valsalva, the fibrous intercusp triangles, and the AV cusps. Assessment of AS comprises a description of cusp morphology, calcification, fusion of cusps, AV function, and quantification of AS severity. The normal AV function requires aortic and mitral valves coupled to function in a reciprocal, interdependent fashion. With advances in 3DE and the use of specialized software, this valvular coupling has been examined in normal human hearts. Transthoracic 3DE often has suboptimal image quality of the AV, therefore accurate cusp information and aortic root height prerequisite to interventions often are acquired via transesophageal 3DE (Figure 6). These transesophageal 3D images are especially suited for studying the restricted cusp motion, thus an effective tool for the assessment of AS whether it be of bicuspid or tricuspid origin.
The left atrial appendage (LAA) is a tubular, blind-ended pouch attached to the left atrium. It is the source of cerebral thromboembolism in approximately 90% of patients with nonvalvular atrial fibrillation.49 Transesophageal 2DE is currently the main imaging modality to assess LAA anatomy, but studies have shown transesophageal 3DE is helpful in differentiating a thrombus from LAA pectinate muscle. Pre-procedure transesophageal echo is used to exclude other sources of embolism, and transesophageal 3DE has shown to be more accurate compared to 2DE in characterizing diameter, types, surface features, mobility, sites of intracardiac masses, and spatial relationship to surrounding structures.
Guidance of interventional procedures
Recent advances in the applications of transesophageal 3DE flourish in the areas of interventional procedures. Repair of MR in selected patients with mitral valve prolapse at A2 or P2 scallop was recently performed in the catheterization lab using transcatheter mitral valve clip edge-to-edge repair.50 3D transesophageal echocardiography approach provides the most comprehensive information about MV morphology, as well as lesion location, mitral valve clip orientation, and enhances the confidence of interpretation of mitral valve pathology and catheter-clip location. Transcatheter aortic valve replacement (TAVR) has recently become a valid alternative to surgical aortic valve replacement in selected high-risk patients with aortic stenosis.51 Compared to 2DE for pre-procedural aortic annulus evaluation, 3DE has shown to be closely approximate and has high correlation to prosthesis size indication by the reference standard multidetector computed tomography (MDCT). After TAVR, it was common to observe paravalvular AR by intraoperative transesophageal echo, and a mismatch index can be defined as annulus area – prosthesis area. The occurrence of significant AR was associated significantly with mismatch index obtained by transesophageal 3DE, but not by transesophageal 2DE. For LAA exclusion, transesophageal 3DE provides a more detailed assessment and quantitative analysis of LAA orifice area compared to transesophageal 2DE. In addition, real-time transesophageal 3DE is more accurate at sizing true LAA orifice area that closely related to CT measurements, whereas transesophageal 2DE frequently underestimates compared to CT.
3D STRESS ECHOCARDIOGRAPHY
Stress echocardiography is an important modality for detecting significant coronary stenosis in patients with chest pain. Compared with previously reported values for conventional stress 2DE, stress 3DE showed improved interobserver agreement was observed for segment-wise classification of normal/abnormal wall motion. Overall, a higher percentage of abnormal myocardial segments were correctly identified with stress 3DE compared to stress 2DE. Since 3DE is capable of simultaneously displaying 2 or 3 2D cut-planes (multiplane mode) (Figure 7) or multi-slice 2D short-axis images from LV base to apex (multislice mode) (Figure 8) with each axis divided into 6 regions, both modalities are useful to detect stress induced transient wall motion abnormalities. Study has shown that multi-slice dobutamine stress echocardiography had a high specificity and better accuracy for diagnosing wall motion abnormalities at the basal part of the myocardium compared with the multiplane mode.52 In addition, stress 3DE showed a higher sensitivity to identify wall motion abnormality in the difficult-to-detect ischemia at apical region compared to stress 2DE.
Figure 7.
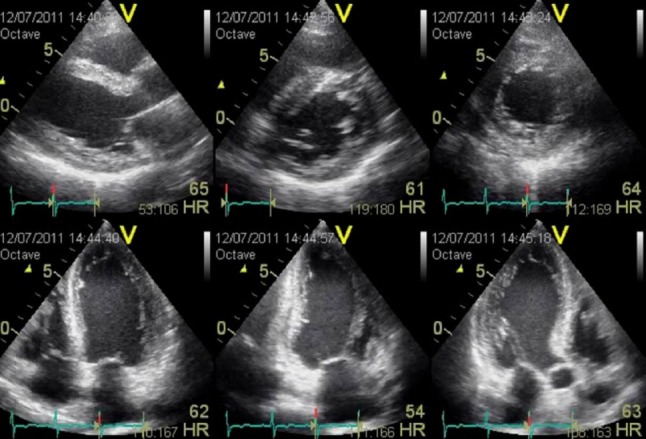
Simultaneous display of multiplane by 3D echocardiography. Top row, from left: parasternal long-axis, basal short-axis, mid short-axis views. Bottom row, from left: apical 4-chamber, apical 2-chamber, and apical 3-chamber views.
Figure 8.
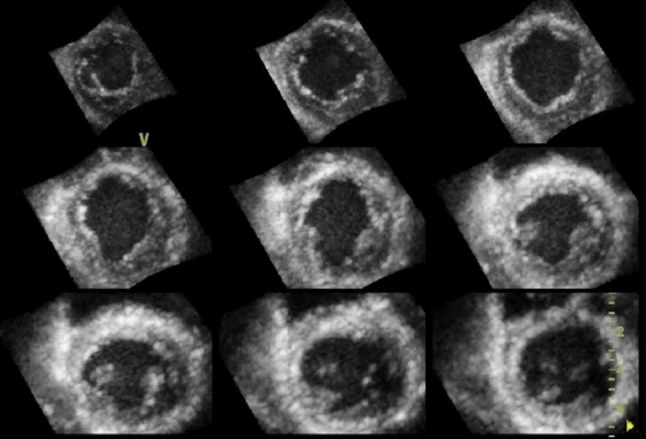
Simultaneous display of multi-slice by 3D echocardiography. Nine-equidistant 2D short-axis images from LV apex (top left) to base (bottom right).
CURRENT LIMITATIONS OF 3D ECHOCARDIOGRAPHY
As with image acquisition in 2DE, the quality of echo image in 3DE is limited by the availability of acoustic windows. The spatial and temporal resolution of current 3DE technology are still inferior to 2DE. At present, two modes of full-volume 3D data acquisition, multi-beat and real-time 3D mode, are available. Multi-beat acquisition allows faster acquisition of a thin section of 3D pyramidal volume but requires four cardiac cycles and gated capture to reconstruct the 3D image. Therefore, it is prone to stitch artifacts in patients with rhythm disturbance and respiratory motion. Real-time imaging captures entire heart movement in a single beat that overcomes limitations in multi-beat mode but suffers deteriorations in spatiotemporal resolution. While new development in hardware technology will overcome the aforementioned limitations, advanced software algorithm can improve existing semi-automated to fully automated border detection for quantifying chamber volumes and mechanics.
A GLIMPSE INTO THE FUTURE
Moving beyond volumetric and functional LV quantification, 3DE has great potential in the evaluation of LV twist and torsion, wall motion analysis, and dyssynchrony analysis. New automated quantification of outflow stroke volumes by 3D real-time color flow Doppler echocardiography compared favorably with CMR. One new aspect in 3DE is simultaneous evaluation of both the right heart and left heart chambers to better understand cardiac mechanics. Application of 3DE in periprocedural evaluation of LAA closure also awaits further studies. In the near future, non-invasive multi-modality fusion imaging with MDCT, stress 3DE may demonstrate its clinical utility for the assessment of coronary artery disease.
REFERENCES
- 1.von Ramm OT, Smith SW. Real time volumetric ultrasound imaging system. J Digital Imaging. 1990;3:261–266. doi: 10.1007/BF03168124. [DOI] [PubMed] [Google Scholar]
- 2.Lang RM, Mor-Avi V, Dent JM, Kramer CM. Three-dimensional echocardiography: is it ready for everyday clinical use? JACC Cardiovasc Imaging. 2009;2:114–117. doi: 10.1016/j.jcmg.2008.10.006. [DOI] [PubMed] [Google Scholar]
- 3.Mor-Avi V, Sugeng L, Lang RM. Real-time 3-dimensional echocardiography: an integral component of the routine echocardiographic examination in adult patients? Circulation. 2009;119:314–329. doi: 10.1161/CIRCULATIONAHA.107.751354. [DOI] [PubMed] [Google Scholar]
- 4.Lang RM, Badano LP, Tsang W, et al. American Society of Echocardiography; European Association of Echocardiography. EAE/ASE recommendations for image acquisition and display using three-dimensional echocardiography. JASE. 2012;25:3–46. doi: 10.1016/j.echo.2011.11.010. [DOI] [PubMed] [Google Scholar]
- 5.Jenkins C, Bricknell K, Hanekom L, Marwick TH. Reproducibility and accuracy of echocardiographic measurements of left ventricular parameters using real-time three-dimensional echocardiography. J Am Coll Cardiol. 2004;44:878–886. doi: 10.1016/j.jacc.2004.05.050. [DOI] [PubMed] [Google Scholar]
- 6.Caiani EG, Corsi C, Zamorano J, et al. Improved semiautomated quantification of left ventricular volumes and ejection fraction using 3-dimensional echocardiography with a full matrix-array transducer: comparison with magnetic resonance imaging. J Am Soc Echocardiogr. 2005;18:779–788. doi: 10.1016/j.echo.2004.12.015. [DOI] [PubMed] [Google Scholar]
- 7.Jacobs LD, Salgo IS, Goonewardena S, et al. Rapid online quantification of left ventricular volume from real-time three-dimensional echocardiographic data. Eur Heart J. 2006;27:460–468. doi: 10.1093/eurheartj/ehi666. [DOI] [PubMed] [Google Scholar]
- 8.Greupner J, Zimmermann E, Grohmann A, et al. Head-to-head comparison of left ventricular function assessment with 64-row computed tomography, biplane left cine ventriculography, and both 2- and 3-dimensional transthoracic echocardiography: comparison with magnetic resonance imaging as the reference standard. J Am Coll Cardiol. 2012;59:1897–1907. doi: 10.1016/j.jacc.2012.01.046. [DOI] [PubMed] [Google Scholar]
- 9.Qin JX, Shiota T, Thomas JD. Determination of left ventricular volume, ejection fraction, and myocardial mass by real-time three-dimensional echocardiography. Echocardiography. 2000;17:781–786. doi: 10.1111/j.1540-8175.2000.tb01237.x. [DOI] [PubMed] [Google Scholar]
- 10.Mor-Avi V, Sugeng L, Weinert L, et al. Fast measurement of left ventricular mass with real-time three-dimensional echocardiography: comparison with magnetic resonance imaging. Circulation. 2004;110:1814–1818. doi: 10.1161/01.CIR.0000142670.65971.5F. [DOI] [PubMed] [Google Scholar]
- 11.Oe H, Hozumi T, Arai K, et al. Comparison of accurate measurement of left ventricular mass in patients with hypertrophied hearts by real-time three-dimensional echocardiography versus magnetic resonance imaging. Am J Cardiol. 2005;95:1263–1267. doi: 10.1016/j.amjcard.2005.01.065. [DOI] [PubMed] [Google Scholar]
- 12.Caiani EG, Corsi C, Sugeng L, et al. Improved quantification of left ventricular mass based on endocardial and epicardial surface detection with real time three dimensional echocardiography. Heart. 2006;92:213–219. doi: 10.1136/hrt.2005.060889. [DOI] [PMC free article] [PubMed] [Google Scholar]
- 13.Takeuchi M, Nishikage T, Mor-Avi V, et al. Measurement of left ventricular mass by real-time three dimensional echocardiography: validation against magnetic resonance and comparison with two-dimensional and m-mode measurements. J Am Soc Echocardiogr. 2008;21:1001–1005. doi: 10.1016/j.echo.2008.07.008. [DOI] [PubMed] [Google Scholar]
- 14.Mizukoshi K, Takeuchi M, Nagata Y, et al. Normal values of left ventricular mass index assessed by transthoracic three-dimensional echocardiography. J Am Soc Echocardiogr. 2016;29:51–61. doi: 10.1016/j.echo.2015.09.009. [DOI] [PubMed] [Google Scholar]
- 15.Galderisi M, Henein MY, D'hooge J, et al. European Association of Echocardiography. How to use echo-Doppler in clinical trials – different modalities for different purposes. Eur J Echocardiogr. 2011;12:339–353. doi: 10.1093/ejechocard/jer051. [DOI] [PubMed] [Google Scholar]
- 16.Jenkins C, Bricknell K, Chan J, et al. Comparison of two- and three-dimensional echocardiography with sequential magnetic resonance imaging for evaluating left ventricular volume and ejection fraction over time in patients with healed myocardial infarction. Am J Cardiol. 2007;99:300–306. doi: 10.1016/j.amjcard.2006.08.026. [DOI] [PubMed] [Google Scholar]
- 17.Abhayaratna WP, Seward JB, Appleton CP, et al. Left atrial size: physiologic determinants and clinical applications. J Am Coll Cardiol. 2006;47:2357–2363. doi: 10.1016/j.jacc.2006.02.048. [DOI] [PubMed] [Google Scholar]
- 18.Mor-Avi V, Yodwut C, Jenkins C, et al. Real-time 3D echocardiographic quantification of left atrial volume: multicenter study for validation with CMR. JACC Cardiovasc Imaging. 2012;5:769–777. doi: 10.1016/j.jcmg.2012.05.011. [DOI] [PubMed] [Google Scholar]
- 19.Wu VC, Takeuchi M, Kuwaki H, et al. Prognostic value of LA volumes assessed by transthoracic 3D echocardiography: comparison with 2D echocardiography. JACC Cardiovasc Imaging. 2013;6:1025–1035. doi: 10.1016/j.jcmg.2013.08.002. [DOI] [PubMed] [Google Scholar]
- 20.Jenkins C, Chan J, Bricknell K, et al. Reproducibility of right ventricular volumes and ejection fraction using real-time three-dimensional echocardiography: comparison with cardiac MRI. Chest. 2007;131:1844–1851. doi: 10.1378/chest.06-2143. [DOI] [PubMed] [Google Scholar]
- 21.Graspa J, O’Regan DP, Pavlopoulos H, et al. Right ventricular remodeling in pulmonary arterial hypertension with three-dimensional echocardiography: comparison with cardiac magnetic resonance imaging. Eur J Echocardiogr. 2010;11:64–73. doi: 10.1093/ejechocard/jep169. [DOI] [PubMed] [Google Scholar]
- 22.Sugeng L, Mor-Avi V, Weinert L, et al. Multimodality comparison of quantitative volumetric analysis of the right ventricle. JACC Cardiovasc Imaging. 2010;3:10–18. doi: 10.1016/j.jcmg.2009.09.017. [DOI] [PubMed] [Google Scholar]
- 23.Van der Zwaan HB, Helbing WA, McGhie JS, et al. Clinical value of real-time three-dimensional echocardiography for right ventricular quantification in congenital heart disease: validation with cardiac magnetic resonance imaging. J Am Soc Echocardiogr. 2010;23:134–140. doi: 10.1016/j.echo.2009.12.001. [DOI] [PubMed] [Google Scholar]
- 24.Leibundgut G, Rohner A, Grize L, et al. Dynamic assessment of right ventricular volumes and function by real-time three-dimensional echocardiography: a comparison study with magnetic resonance imaging in 100 adult patients. J Am Soc Echocardiogr. 2010;23:116–126. doi: 10.1016/j.echo.2009.11.016. [DOI] [PubMed] [Google Scholar]
- 25.Medvedofsky D, Addetia K, Patel AR, et al. Novel approach to three-dimensional echocardiographic quantification of right ventricular volumes and function from focused views. J Am Soc Echocardiogr. 2015;28:1222–1231. doi: 10.1016/j.echo.2015.06.013. [DOI] [PubMed] [Google Scholar]
- 26.Tamborini G, Marsan NA, Gripari P, et al. Reference values for right ventricular volumes and ejection fraction with real-time three-dimensional echocardiography: evaluation in a large series of normal subjects. J Am Soc Echocardiogr. 2010;23:109–115. doi: 10.1016/j.echo.2009.11.026. [DOI] [PubMed] [Google Scholar]
- 27.Maffessanti F, Muraru D, Esposito R, et al. Age-, body size-, and sex-specific reference values for right ventricular volumes and ejection fraction by three-dimensional echocardiography: a multicenter echocardiographic study in 507 healthy volunteers. Cir Cardiovascular Imaging. 2013;6:700–710. doi: 10.1161/CIRCIMAGING.113.000706. [DOI] [PubMed] [Google Scholar]
- 28.Thavendiranathan P, Phelan D, Thomas JD, et al. Quantitative assessment of mitral regurgitation: validation of new methods. J Am Coll Cardiol. 2012;60:1470–1483. doi: 10.1016/j.jacc.2012.05.048. [DOI] [PubMed] [Google Scholar]
- 29.Cui C, Liu L, Fan T, et al. Application of real-time three-dimensional echocardiography to evaluate the pre- and postoperative right ventricular systolic function of patients with tetralogy of Fallot. Acta Cardiol Sin. 2015;31:345–352. doi: 10.6515/ACS20150318A. [DOI] [PMC free article] [PubMed] [Google Scholar]
- 30.Wu VC, Takeuchi M, Otani K, et al. Effect of through-plane and twisting motion on left ventricular strain calculation: direct comparison between two-dimensional and three-dimensional speckle-tracking echocardiography. J Am Soc Echocardiogr. 2013;26:1274–1281. doi: 10.1016/j.echo.2013.07.006. [DOI] [PubMed] [Google Scholar]
- 31.Seo Y, Ishizu T, Atsumi A, et al. Three-dimensional speckle tracking echocardiography. Circ J. 2014;78:1290–1301. doi: 10.1253/circj.cj-14-0360. [DOI] [PubMed] [Google Scholar]
- 32.Nagata Y, Takeuchi M, Wu VC, et al. Prognostic value of LV deformation parameters using 2D and 3D speckle-tracking echocardiography in asymptomatic patients with severe aortic stenosis and preserved LV ejection fraction. JACC Cardiovasc Imaging. 2015;8:235–245. doi: 10.1016/j.jcmg.2014.12.009. [DOI] [PubMed] [Google Scholar]
- 33.Lo CI, Lai YH, Wu JJ, et al. Cardiac systolic mechanics in heart failure with preserved ejection fraction: new insights and controversies. Acta Cardiol Sin. 2013;29:515–523. [PMC free article] [PubMed] [Google Scholar]
- 34.Takeuchi M, Nakai H, Kokumai M, et al. Age-related changes in left ventricular twist assessed by two-dimensional speckle-tracking imaging. J Am Soc Echocardiogr. 2006;19:1077–1084. doi: 10.1016/j.echo.2006.04.011. [DOI] [PubMed] [Google Scholar]
- 35.Kaku K, Takeuchi M, Tsang W, et al. Age-related normal range of left ventricular strain and torsion using three-dimensional speckle-tracking echocardiography. J Am Soc Echocardiogr. 2014;27:55–64. doi: 10.1016/j.echo.2013.10.002. [DOI] [PubMed] [Google Scholar]
- 36.Stanton T, Leano R, Marwick TH. Prediction of all-cause mortality from global longitudinal speckle strain: comparison with ejection fraction and wall motion scoring. Cir Cardiovasc Imaging. 2009;2:356–364. doi: 10.1161/CIRCIMAGING.109.862334. [DOI] [PubMed] [Google Scholar]
- 37.Hayat D, Kloeckner M, Nahum J, et al. Comparison of real-time three-dimensional speckle tracking to magnetic resonance imaging in patients with coronary heart disease. Am J Cardiol. 2012;109:180–186. doi: 10.1016/j.amjcard.2011.08.030. [DOI] [PubMed] [Google Scholar]
- 38.Eriksson P, Hansson PO, Eriksson H, Dellborg M. Bundle-branch blcok in a general male population: the study of men born 1913. Circulation. 1998;98:2494–2500. doi: 10.1161/01.cir.98.22.2494. [DOI] [PubMed] [Google Scholar]
- 39.Marcus GM, Rose E, Viloria EM, et al. VENTAK CHF/CONTAK-CD Biventricular Pacing Study Investigators. Septal to posterior wall motion delay fails to predict reverse remodeling or clinical improvement in patients undergoing cardiac resynchronization therapy. J Am Coll Cardiol. 2005;46:2208–2214. doi: 10.1016/j.jacc.2005.05.095. [DOI] [PubMed] [Google Scholar]
- 40.Kapetanakis S, Kearney MT, Siva A, et al. Real-time three-dimensional echocardiography: a novel technique to quantify global left ventricular mechanical dyssynchrony. Circulation. 2005;112:992–1000. doi: 10.1161/CIRCULATIONAHA.104.474445. [DOI] [PubMed] [Google Scholar]
- 41.Kapetanakis S, Bhan A, Murgatroyd F, et al. Real-time 3D echo in patient selection for cardiac resynchronization therapy. JACC Cardiovasc Imaging. 2011;4:16–26. doi: 10.1016/j.jcmg.2010.09.021. [DOI] [PubMed] [Google Scholar]
- 42.Chan YH, Wang CL, Kuo CT, et al. Clinical assessment and implication of left ventricular mechanical dyssynchrony in patients with heart failure. Acta Cardiol Sin. 2013;29:505–514. [PMC free article] [PubMed] [Google Scholar]
- 43.Cavalcante JL, Rodriguez LL, Kapadia S, et al. Role of echocardiography in percutaneous mitral valve intervention. JACC Cardiovasc Imaging. 2012;5:733–746. doi: 10.1016/j.jcmg.2012.03.010. [DOI] [PubMed] [Google Scholar]
- 44.Zamorano J, Cordeiro P, Sugeng L, et al. Real-time three-dimensional echocardiography for rheumatic mitral valve stenosis evaluation: an accurate and novel approach. J Am Coll Cardiol. 2004;43:2091–2096. doi: 10.1016/j.jacc.2004.01.046. [DOI] [PubMed] [Google Scholar]
- 45.Ge S, Warner JG, Jr., Abraham TP, et al. Three-dimensional surface area of the aortic valve orifice by three-dimensional echocardiography: clinical validation of a novel index for assessment of aortic stenosis. Am Heart J. 1998;136:1042–1050. doi: 10.1016/s0002-8703(98)70161-9. [DOI] [PubMed] [Google Scholar]
- 46.Otani K, Takeuchi M, Kaku K, et al. Assessment of the aortic root using real-time 3D transesophageal echocardiography. Cir J. 2010;74:2649–2657. doi: 10.1253/circj.cj-10-0540. [DOI] [PubMed] [Google Scholar]
- 47.Wu VC, Kaku K, Takeuchi M, et al. Aortic root geometry in patients with aortic stenosis assessed by real-time three-dimensional transesophageal echocardiography. J Am Soc Echocardiogr. 2014;27:32–41. doi: 10.1016/j.echo.2013.10.007. [DOI] [PubMed] [Google Scholar]
- 48.Pirat B, Little SH, Igo SR, et al. Direct measurement of proximal isovelocity surface area by real-time three-dimensional color Doppler for quantification of aortic regurgitation volume: an in vitro validation. J Am Soc Echocardiogr. 2009;22:306–313. doi: 10.1016/j.echo.2008.11.031. [DOI] [PMC free article] [PubMed] [Google Scholar]
- 49.Wunderlich NC, Beigel R, Swaans MJ, et al. Percutaneous interventions for left atrial appendage exclusion: options, assessment, and imaging using 2D and 3D echocardiography. JACC Cardiovasc Imaging. 2015;8:472–488. doi: 10.1016/j.jcmg.2015.02.002. [DOI] [PubMed] [Google Scholar]
- 50.Feldman T, Wasserman HS, Herrmann HC, et al. Percutaneous mitral valve repair using the edge-to-edge technique: six-month results of the EVEREST Phase I Clinical Trial. J Am Coll Cardiol. 2005;46:2134–2140. doi: 10.1016/j.jacc.2005.07.065. [DOI] [PubMed] [Google Scholar]
- 51.Leon MB, Smith CR, Mack M, et al. PARTNER Trial Investigators. Transcatheter aortic-valve implantation for aortic stenosis in patients who cannot undergo surgery. N Engl J Med. 2010;363:1597–1607. doi: 10.1056/NEJMoa1008232. [DOI] [PubMed] [Google Scholar]
- 52.Yoshitani H, Takeuchi M, Mor-Avi V, et al. Comparative diagnostic accuracy of multiplane and multislice three-dimensional dobutamine stress echocardiography in the diagnosis of coronary artery disease. J Am Soc Echocardiogr. 2009;22:437–442. doi: 10.1016/j.echo.2009.02.005. [DOI] [PubMed] [Google Scholar]


