

Abstract
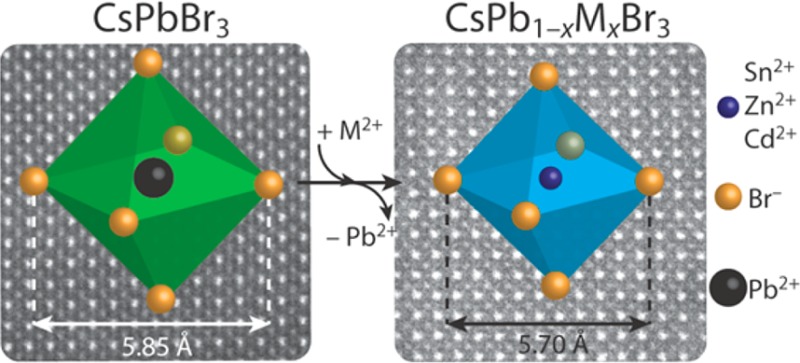
Colloidal CsPbX3 (X = Br, Cl, and I) perovskite nanocrystals (NCs) have emerged as promising phosphors and solar cell materials due to their remarkable optoelectronic properties. These properties can be tailored by not only controlling the size and shape of the NCs but also postsynthetic composition tuning through topotactic anion exchange. In contrast, property control by cation exchange is still underdeveloped for colloidal CsPbX3 NCs. Here, we present a method that allows partial cation exchange in colloidal CsPbBr3 NCs, whereby Pb2+ is exchanged for several isovalent cations, resulting in doped CsPb1–xMxBr3 NCs (M= Sn2+, Cd2+, and Zn2+; 0 < x ≤ 0.1), with preservation of the original NC shape. The size of the parent NCs is also preserved in the product NCs, apart from a small (few %) contraction of the unit cells upon incorporation of the guest cations. The partial Pb2+ for M2+ exchange leads to a blue-shift of the optical spectra, while maintaining the high photoluminescence quantum yields (>50%), sharp absorption features, and narrow emission of the parent CsPbBr3 NCs. The blue-shift in the optical spectra is attributed to the lattice contraction that accompanies the Pb2+ for M2+ cation exchange and is observed to scale linearly with the lattice contraction. This work opens up new possibilities to engineer the properties of halide perovskite NCs, which to date are demonstrated to be the only known system where cation and anion exchange reactions can be sequentially combined while preserving the original NC shape, resulting in compositionally diverse perovskite NCs.
Introduction
The recent development of colloidal CsPbX3 (X = Cl, Br, and I) perovskite nanocrystals (NCs) has resulted in a burst of scientific interest, owing to their outstanding optical properties.1−3 Due to their high photoluminescence quantum yields (PLQYs up to 90%) without any additional surface passivation and tunable optical properties throughout the entire visible spectrum, CsPbX3 NCs are promising new materials for various optoelectronic applications, such as low threshold one- and two-photon pumped4,5 gain materials for lasing and highly efficient LEDs.6 Moreover, recently, colloidal CsPbI3 NCs were used in solution processed photovoltaic cells with device efficiencies exceeding 10%.7
Currently, synthetic protocols for colloidal CsPbX3 NCs with a variety of shapes are available, such as cubes,1,8 nanowires,9,10 and nanoplatelets.2,11,12 Besides all-inorganic CsPbX3 perovskite NCs, colloidal organic–inorganic perovskite NCs have also been recently prepared.2,13 Furthermore, the composition of colloidal halide perovskite NCs can easily be postsynthetically tailored through topotactic halide-exchange reactions with preservation of the size and shape of the parent NCs (despite a small lattice expansion or contraction, depending on the size of the guest halide).14,15 This is in striking contrast to what has been commonly observed for anion exchange reactions in colloidal II–VI semiconductor NCs, which typically result in severe size and shape transformations, often leading to hollow NCs.16,17
Topotactic cation exchange reactions are commonplace in colloidal semiconductor II–VI and III–V NCs, allowing access to a variety of compositions and shapes that are not attainable through direct synthesis protocols.18−22 In contrast, postsynthetic cation exchange in colloidal CsPbX3 perovskite NCs remains elusive and has only been addressed in two recent works, which reported conflicting observations.14,15 While Akkerman et al. report the observation of CH3NH3+ (MA+) for Cs+ exchange in CsPbBr3 NCs as an undesired complication in anion exchange protocols using MA–X salts,15 Nedelcu et al. state that attempts to exchange either Cs+ or Pb2+ for other cations (Rb+, Ag+, Cu+, Ba2+, Sn2+, Ge2+, or Bi3+) in CsPbBr3 NCs were invariably unsuccessful and lead only to the decomposition of the parent NCs.14 The resistance of CsPbBr3 NCs to cation exchange was rationalized by Nedelcu et al. as a consequence of the fact that the perovskite crystal structure is stabilized primarily by the rigid cationic sublattice.14
The introduction of impurity ions in colloidal II–VI and III–V semiconductor NCs provides another synthetic tool to control the optoelectronic properties and to bestow the parent NCs with novel functionalities, such as magnetism due to unpaired electrons in the dopant23 or increased effective Stokes shift due to exciton recombination on the impurity ions.24,25 Furthermore, impurity doping of perovskite thin films has been shown to improve their performance in solar cells.26−28 Recently, Mn2+ doping in colloidal CsPbCl3 perovskite NCs has been achieved by a direct synthesis method, in which PbCl2 and MnCl2 precursors were mixed in the desired ratio, leading to NCs with the characteristic Mn2+ emission.29 However, postsynthetic control over the perovskite composition by introducing different impurity ions has yet to be achieved.
In this work, we present a novel method to perform postsynthetic cation exchange reactions in CsPbBr3 NCs, through which Pb2+ cations are partially replaced by divalent cations (M = Sn2+, Cd2+, and Zn2+), yielding doped CsPb1–xMxBr3 NCs. The Pb2+ for M2+ cation exchange results in a blue-shift of the absorption and emission spectra, while preserving the high PLQYs (>50%) and narrow PL line width (80 meV) of the parent NCs. We attribute the blue-shift in the optical spectra to the contraction of the perovskite cubic unit cell, which results in shorter Pb–Br bonds and hence a stronger ligand field within the Pb-halide octahedra. Interestingly, the blue-shift scales linearly with the lattice contraction. A blue-shift of the PL maximum is also observed upon anion exchange reactions from iodide to chloride.14,15 However, blue-emitting CsPbCl3 NCs obtained by anion exchange methods or direct synthesis protocols have low PLQYs (<15%) and broad PL line widths (>120 meV),1,2,14,15 in contrast to the blue-emitting NCs synthesized with our approach (PLQY > 50%, PL line width ∼80 meV). Our work opens up many new possibilities to engineer the properties of halide perovskite NCs, which are demonstrated to be the only known system where topotactic cation and anion exchange can be sequentially combined, resulting in compositionally diverse colloidal CsPb1–xMxBr3 perovskite NCs (M = Sn2+, Zn2+, and Cd2+; x ≤ 0.1) with size and shape preservation and high PL quantum yields.
Results and Discussion
Optical Properties
Colloidal CsPbBr3 NCs (PL maximum at 512 nm) were reacted inside a nitrogen-purged glovebox at room temperature with metal bromide salts (SnBr2, CdBr2, ZnBr2) and oleylamine dissolved in toluene, leading to a blue-shift of the absorption and PL spectra (Figure 1). The use of metal bromide salts as precursors for the guest cation ensures that solely the cation can be exchanged, since both the parent NCs and the precursor contain the same halide. The spectral position of the PL band blue-shifted over a wide range, depending on the divalent metal cation used and the precursor concentration (Figure 1a–c). Interestingly, although the blue-shift of the absorption and PL spectra is observed in all cases, i.e., for all divalent cations and precursor concentrations, it is more pronounced for specific concentrations and cations. For example, the blue-shift is small, i.e., 30 meV, for both low and high concentrations of SnBr2 (0.25 mM SnBr2, PL maximum at 506 nm; 1.7 mM SnBr2, PL maximum at 504 nm; Figure 1d), but is much larger (170 meV) for a SnBr2 concentration of 0.5 mM, resulting in efficient PL in the blue region of the visible spectrum (PL maximum at 479 nm, PLQY 62%; Figure S1a). By varying the concentration of SnBr2 in toluene while keeping all other reaction parameters constant, the position of the PL maximum can be tuned between 479 and 512 nm. The increase in the SnBr2 concentration also results in the appearance of a weak and broad absorption feature at ∼580 nm. The possible nature of this transition and of the observed spectral blue-shift will be discussed later in this paper.
Figure 1.

Tunable photoluminescence of CsPbBr3 nanocrystals upon reaction with divalent cation bromide salts. Photographs of colloidal suspensions under UV illumination of (a) perovskite NCs after reaction of CsPbBr3 NCs with different concentrations of SnBr2 (0.5, 1.25, and 1.7 mM), (b) parent CsPbBr3 NCs (right vial) and product NCs after reaction of CsPbBr3 NCs with different concentrations of CdBr2 (0.5 and 1.0 mM), and (c) parent CsPbBr3 NCs (right vial) and product NCs after reaction of CsPbBr3 NCs with different concentrations of ZnBr2 (0.5 and 1.0 mM). Photoluminescence (full lines) and absorption (dashed lines) spectra of (d) parent CsPbBr3 NCs (green lines) and product NCs obtained after reaction with different concentrations of SnBr2 (red and brown lines) and (e) parent CsPbBr3 NCs (green lines) and product NCs obtained after reaction with different concentrations of CdBr2 (orange lines) and ZnBr2 (blue lines). In all cases, a blue-shift of both the absorption and the photoluminescence spectra is observed after reacting CsPbBr3 NCs with divalent cation bromides, while the well-defined absorption features and the narrow PL fwhm (∼80 meV) are preserved.
Reaction of the CsPbBr3 NCs with other divalent ions, i.e., Cd2+ and Zn2+, leads to more pronounced blue-shifts than reaction with SnBr2, resulting in efficient PL between 452 and 512 nm for CsPbBr3 NCs reacted with CdBr2 and between 462 and 512 nm for CsPbBr3 NCs reacted with ZnBr2 (Figure 1e). The key spectral features of the parent CsPbBr3 NCs, such as the sharp optical absorption edge, well-defined absorption peaks, and the narrow PL line width (fwhm ≈ 80 meV), are maintained after reaction with metal bromide salts. High PLQYs over 60% are observed after reaction with divalent cations for all samples (see Figure S1a). We note that the PL peak shifts further over time (100–200 meV over 4 weeks), due to the presence of metal bromide precursor in the stored colloidal dispersions, since the samples could not be purified due to difficulties with precipitation of the NCs. However, the NCs do not deteriorate and do maintain their size, shape, high PLQYs, and colloidal stability in toluene over the course of (at least) several months. Furthermore, we find that the absorption increases with 2% over the first 90 min of reaction (see Figure S1b). The increase in absorption on longer time scales is hard to quantify, since the absorption spectrum also shifts to higher energies. It has also been observed in other reports that colloidal perovskite NCs require very high centrifugation speeds to be destabilized from colloidal suspension and precipitated.30 In the present case, such high centrifugation speeds also lead to precipitation of the unreacted metal-bromide precursor, while using stronger antisolvents, e.g., methanol, deteriorates the NCs. A recent study by Luther and co-workers reported a novel purification procedure for perovskite NCs, involving methyl acetate as antisolvent, which does not lead to degradation of the NCs, although it still requires high centrifugation speeds.7 We also used this purification method, but we were able to recover only a very small amount of NCs from the reaction mixtures (see Experimental Methods below for details).
The PL lifetimes of the parent CsPbBr3 NCs and the product perovskite NCs after reaction with metal bromide salts were measured, displaying multiexponential decay for all samples, both before and after the cation exchange reactions (Figure S2). Therefore, the average lifetime (τavg) was calculated,31 which reveals that τavg is of the same order of magnitude (∼10 ns) in all cases. Furthermore, we note that the higher the PL energy, the shorter τavg, as expected based on Fermi’s golden rule.32 For the CsPbBr3 NCs reacted with SnBr2, the average exciton lifetime (τavg) decreases from 16.8 ns for the parent CsPbBr3 NCs to 6.8 ns for the product NCs obtained upon reaction with 1.7 mM SnBr2. A decrease in τavg is also observed for the product NCs obtained upon reaction with CdBr2 and ZnBr2, to 6.4 and 7.2 ns, respectively.
Lattice Contraction after Reaction with MBr2 Salts
Transmission electron microscopy (TEM) measurements reveal that the shape and size of the NCs are preserved after reaction with metal–bromide salts (Figures 2, S3, and S4), since cubes of ∼9 nm are observed in all cases. Electron diffraction (ED) analysis shows that the atomic reflections are shifted to larger scattering vectors after the reaction with divalent ions. This indicates that the atomic CsPbBr3 lattice contracts due to the incorporation of the smaller Sn2+/Cd2+/Zn2+ guest cations (Figure 2d,h). The 1D powder ED (PED) patterns (Figure 2d,h) were obtained by azimuthally integrating the 2D ED patterns, displayed as insets in the TEM images (Figure 2a–c,e–g).33 As displayed in Figure 2, the lattice contraction after reaction with Cd2+– and Zn2+–bromide salts is larger than after reaction with SnBr2. This is expected based on the ionic radii of the divalent cations, in case Pb2+ (r(Pb2+) = 119 pm, coordination number (CN) = 6) is replaced by the guest divalent cation (r(Cd2+) = 95 pm, r(Zn2+) = 74 pm, r(Sn2+) = 118 pm, CN = 6 in all cases).34 Quantification of the {100} d-spacing is displayed in Figure 2d,h. The diffraction patterns were calibrated with both TlCl and Au reference samples (see Supplementary Method 1 and Figures S5 and S6 for details).
Figure 2.

Size and shape preservation and lattice contraction of CsPbBr3 nanocrystals (NCs) after reaction with MBr2 (reaction time: ∼16 h). TEM images of (a) parent CsPbBr3 NCs and (b, c) product NCs obtained after reaction of CsPbBr3 NCs with different concentrations of SnBr2 precursor (0.5 and 1.7 mM, respectively). The insets in panels a–c display the 2D electron diffraction (ED) patterns, which result in (d) 1D powder ED (PED) patterns after azimuthal integration (concentration of SnBr2: 0.25, 0.50, 1.0, 1.25, and 1.7 mM, from top to bottom, respectively). The colors of panels a–c correspond to the colors of the 1D PED patterns in panel d. TEM images of (e) parent CsPbBr3 NCs and (f) product NCs obtained after reaction of CsPbBr3 NCs with ZnBr2 and (g) with CdBr2. The insets in panels e–g display the 2D ED patterns, which result in (h) 1D PED patterns after azimuthal integration. The colors of panels e–g correspond to the colors of the 1D PED patterns in panel h. A large lattice contraction is observed upon reaction of CsPbBr3 NCs with Cd2+ and Zn2+ (h), whereas a minor lattice contraction is observed upon reaction with Sn2+ (d). Quantification of the {100} d-spacing is given in panels d and h. Enlarged versions of the TEM images displayed in panels a–c and e–g, as well as the TEM images and ED patterns of the other samples, can be found in Figures S3 and S4.
The lattice contraction of CsPbBr3 NCs after reaction with MBr2 salts is also observed in the high-angle annular dark-field scanning transmission electron microscopy (HAADF-STEM) images (Figure 3). Here, statistical parameter estimation theory is used to extract structure parameters from the images.35,36 One of the structure parameters corresponds to the atomic column positions, which have been used to estimate the absolute distance between neighboring Pb/halide columns in order to quantify the lattice parameter (Figure 3). By fitting a normal distribution to these distance estimates, the mean lattice parameter has been determined. The lattice parameter of the parent CsPbBr3 NCs was calibrated to the value reported in the literature for the cubic perovskite structure of CsPbBr3. A lattice contraction from |a| = 5.849 ± 0.003 Å to |a| = 5.839 ± 0.005 Å is observed upon reaction of CsPbBr3 NCs with 0.5 mM SnBr2. The obtained CsPbBr3 unit vector corresponds well to recent X-ray diffraction experiments for the cubic perovskite crystal structure, but it does not exclude the presence of a small portion of orthorhombic distortions of the octahedra in the atomic lattice.37 Similar analysis on CsPbBr3 NCs reacted with 0.5 mM CdBr2 and 1.0 mM ZnBr2 shows a lattice contraction from |a| = 5.849 ± 0.003 Å to |a| = 5.819 ± 0.008 Å (Cd2+) and |a| = 5.808 ± 0.014 Å (Zn2+), respectively. We do not observe clustered areas with larger/smaller lattice vectors in the images showing the deviations from the mean lattice vector (Figure 3, middle row, red: larger than mean distances, blue: smaller than mean distances). From this, we deduce that the incorporated guest cations are homogeneously distributed throughout the NCs. Thickness profiles obtained from the total scattered intensities of the atomic columns confirm this observation (Figure S7).
Figure 3.

Quantitative high-angle annular dark-field STEM measurements reveal a lattice contraction of (a) parent CsPbBr3 NCs (|a| = 5.849 ± 0.003 Å) upon reaction with (b) 0.5 mM SnBr2 (|a| = 5.839 ± 0.005 Å), (c) 0.5 mM CdBr2 (|a| = 5.819 ± 0.008 Å), and (d) 1.0 mM ZnBr2 (|a| = 5.808 ± 0.014 Å) (reaction time: 16 h). In the HAADF-STEM images, the mixed Pb/halide (bright contrast), Cs (intermediate contrast), and halide (low contrast) atomic columns can be easily assigned (top panels). After detecting the positions of the Pb/halide columns from the HAADF-STEM images, we calculate the interatomic distances, i.e., the lattice spacing (middle panels). Red bars indicate a larger distance than the mean |a|, and blue bars indicate a smaller distance than the mean |a|. The histogram of distances together with the estimated normal distribution reveal a contraction of the cubic perovskite CsPbBr3 atomic lattice upon reaction with SnBr2, CdBr2, and ZnBr2 NCs (bottom panels).
As can be seen, the lattice contraction for Cd- and Zn-dopants (0.5 and 0.7%, respectively) is larger than that for the Sn-doped NCs (0.2%), which is in full agreement with the electron diffraction data presented in Figure 2. The statistical Student’s t test with unequal variances has been used to verify that the found differences are significant.38 Here, the distribution of the measured lattice parameters of the parent CsPbBr3 NCs have been compared to a distribution of the measurements on the doped CsPb1–xMxBr3 NCs at a significance level of 10%, indicating that the distributions have different means. On the basis of these results, we conclude that guest divalent cations are indeed present in the perovskite NCs and are distributed homogeneously across the perovskite lattice.
Elemental Analysis
The results presented above suggest that Pb2+ cations in CsPbBr3 NCs are replaced by other divalent cations, i.e., Sn2+/Cd2+/Zn2+, resulting in a lattice contraction due to the smaller ionic radius of the incorporated cations. To verify the incorporation and the distribution of the guest cations, energy dispersive X-ray spectroscopy (EDS) chemical mapping was performed. We note that the EDS measurements were performed on areas containing a large amount of NCs, in order to obtain a statistically relevant result. The EDS measurements show that Cd (Figure 4a–e) and Zn (Figure 4f–j) are incorporated in the CsPbBr3 NCs in low concentrations. Moreover, no indication for surface preference or phase segregation is observed, which leads us to conclude that the distribution of the guest cations within the CsPb1–xMxBr3 NCs is homogeneous, consistent with the observations presented above. Quantification of the EDS measurements reveals a Cd/Pb ratio of 0.16 for product CsPb1–xCdxBr3 NCs obtained after 16 h of reaction with 0.5 mM CdBr2 (Figures S8–S10) and a Zn/Pb ratio of 0.05 for product CsPb1–xZnxBr3 NCs obtained after 16 h of reaction with 1.0 mM ZnBr2 (Figure S11). CsPbBr3 NCs reacted with 0.5 mM SnBr2 for 16 h were also analyzed with bulk EDS measurements, which reveal a Sn/Pb ratio of 0.1 (Figure S12). We also performed an EDS quantification of product CsPb1–xCdxBr3 perovskite NCs and of portions of the TEM grid surrounding clusters of NCs, i.e., the background. This analysis clearly shows a Cd peak at 3.1 keV for the area containing NCs, whereas Cd-peaks are below the noise level in the background (see Figure S13). The EDS analysis thus clearly demonstrates that divalent guest cations are successfully incorporated in CsPbBr3 NCs upon reaction with MBr2 salts. It should be noted that the elemental concentrations are upper limit estimates, since the samples were not washed prior to the EDS measurements (see Experimental Methods for details). A few selected samples were thoroughly purified by precipitating with methyl acetate, which yielded only very small amounts of NCs (see Experimental Methods for details). The purified NCs showed reduced carbon contamination upon prolonged exposure to the e-beam (see Figure S14). Furthermore, the Sn/Pb ratio for purified NCs (0.085, see Figure S15) was similar to the Sn/Pb ratio for the unpurified samples (0.1, see Figure S12). This leads us to conclude that the above presented cation/Pb ratios are valid upper limit estimates for the incorporated divalent cations. A possible mechanism for the postsynthetic incorporation of divalent cations into CsPbBr3 NCs will be discussed below.
Figure 4.
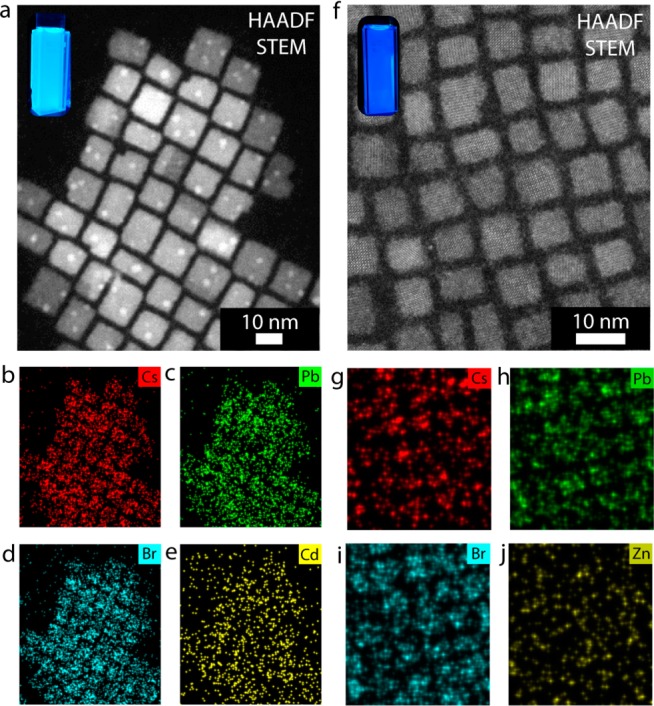
Energy dispersive X-ray spectroscopy mapping of CsPb1–xCdxBr3 and CsPb1–xZnxBr3 nanocrystals. (a) HAADF-STEM image of CsPb1–xCdxBr3 NCs and the corresponding maps of (b) Cs, (c) Pb, (d) Br, and (e) Cd, demonstrating the presence of Cd in the perovskite NCs. The inset in panel a shows a photograph of a colloidal suspension of the NCs under UV illumination. (f) HAADF-STEM image of CsPb1–xZnxBr3 NCs and the corresponding maps of (g) Cs, (h) Pb, (i) Br, and (j) Zn, indicating the presence of Zn in the perovskite NCs. The inset in panel f shows a photograph of a colloidal suspension of the NCs under UV illumination. The bright spots observed in the HAADF-STEM images are metallic Pb nanoparticles, formed upon prolonged exposure to the electron beam (see Figure S16).
It must be noted that we observe bright spots on the CsPbBr3 NCs upon exposure to the electron beam (see Figure 4). High-resolution HAADF-STEM analysis shows that these spots correspond to metallic Pb nanoparticles (Figure S16). This implies that part of the Pb2+ ions are reduced to metallic Pb upon imaging the NCs with an electron beam. Furthermore, the measured atomic ratios indicate that the parent CsPbBr3 NCs are halide-deficient (Cs/Pb/Br = 1:1:2; ratio of cation charge/anion charge = 1.5, Figure S8) and that the halide deficiency is preserved after reaction with MBr2 salts (ratio cation charge/anion charge = 1.5, Figures S9–S12). Cation/anion ratios significantly larger than unity are commonly observed for NCs of II–VI, e.g., CdSe, and of IV–VI, e.g., PbSe, semiconductors synthesized in the presence of X-type ligands, e.g., oleate, and have been rationalized by considering that the stoichiometric NC is coated by a layer of M–X units.39 A similar explanation may apply in the present case, since the CsPbBr3 NCs were synthesized from Cs-oleate and Pb-oleate. Nevertheless, halide deficiency is commonly observed in bulk perovskites, due to the very low activation energies for the creation of anion vacancies in these materials,40−42 and is likely also present in perovskite NCs. Density functional theory calculations show that anion vacancies do not result in midgap trap states in halide perovskites, since their energy levels lie within the conduction band.43 Therefore, despite the presence of halide vacancies, the exciting optoelectronic properties of the parent CsPbBr3 NCs, such as high PLQY and sharp excitonic features, are preserved in the product CsPb1–xMxBr3 NCs.
Cation Exchange Mechanism in CsPbBr3 NCs
The results presented above clearly show that divalent guest cations (Sn2+, Cd2+, and Zn2+) can be incorporated into CsPbBr3 NCs by postsynthetic cation exchange reactions. Considering that aliovalent exchange of Cs+ (radius: 1.88 Å) for M2+ would strongly destabilize the perovskite structure, since it would result in smaller M2+ cations in sites with coordination number 12 and would require charge compensation, we will assume below that only isovalent exchange of Pb2+ for M2+ has taken place, leading to partial substitutional replacement of PbBr6 octahedra by MBr6 octahedra (Figure 5).
Figure 5.
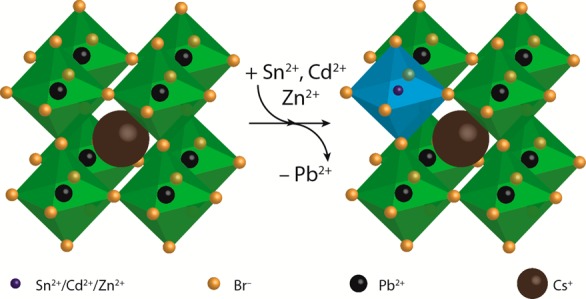
Schematic overview of partial cation exchange in CsPbBr3 nanocrystals. Pb2+ cations are partially replaced by other divalent cations (Sn2+, Cd2+, and Zn2+) by postsynthetic cation exchange reactions, resulting in divalent-cation-doped CsPb1–xMxBr3 NCs (the MBr6 octahedra are schematically depicted by the blue metal–halide octahedra). Incorporation of smaller divalent cations results in contraction of the atomic lattice, which induces a blue-shift of the optical transitions (absorption and PL). The halide anions are depicted smaller for clarity.
Cation exchange reactions have been extensively investigated in NCs of II–VI, IV–VI, III–V, and I–VI semiconductors18−22,44,45 and have been shown to consist of several inherently linked elementary kinetic steps, which must proceed in a concerted way. The first step is the extraction of the native cation from the parent NCs, which may occur by a direct place exchange reaction, i.e., extraction of the native cation and incorporation of the guest cation in a direct reaction mediated by a ligand in solution, e.g., Zn2+ for Cd2+ exchange in ZnSe, mediated by oleate ligands,44 or by an independent chemical pathway that is only kinetically coupled to the incorporation of the guest cation, e.g., cation exchange in Cu2–xS NCs in the presence of excess phosphines.46 The rates of extraction of the native cation and incorporation of the guest cation must be balanced; otherwise, the accumulation of cation vacancies eventually leads to the collapse of the NC.20,21 There are several factors involved in the cation extraction process, such as breaking of the cation–anion bonds within the NC and formation of cation–ligand bonds, while the incorporation of the guest cation requires breaking the cation–ligand bonds and formation of the cation–anion bonds in the NC.18,20 The thermodynamic driving force for the cation exchange is determined by the energy balance of the overall reaction. It should also be noted that the cation exchange process is essentially a surface reaction, which in the absence of cation diffusion in the NC would stop as soon as all surface cations had been exchanged by the guest cations.44 Therefore, the cation exchange rates are often limited by the diffusion rates of the outgoing and incoming cations.18,20,44 Cation diffusion in semiconductor NCs is often attributed to vacancy-mediated migration,18,20,44,45 and its rate is therefore limited by the activation energies for vacancy formation.
Cation exchange reactions have not yet been studied in detail in perovskite NCs, but topotactic anion exchange has been shown to be very efficient and fast in CsPbX3 (X= Cl, Br, and I) halide perovskite NCs,14,15 due to the low activation energy for the formation and diffusion of halide vacancies in these materials.14,15 In contrast, cation diffusion in perovskites is a very slow process, owing to the high activation energies for the formation of cation vacancies and the lack of interstitial sites for interstitial diffusion. A recent study on bulk CH3NH3PbI3 has concluded that vacancy-assisted iodide diffusion in this perovskite material has an activation energy of only 0.58 eV, leading to fast diffusion even at room temperature (diffusion coefficient: 10–12 cm2.s–1), while cation diffusion has much higher activation energies (0.84 and 2.31 eV for CH3NH3+ and Pb2+, respectively).47 As a result, CH3NH3+ diffusion is 4 orders of magnitude slower than iodide diffusion, and the Pb2+ sublattice is essentially immobile.47 This implies that cation exchange processes involving Pb2+ in CsPbX3 perovskites would be limited by very slow diffusion fluxes for both the outgoing Pb2+ and the incoming M2+ guest cations. Our results show that this is indeed the case, since the Pb2+ for M2+ exchange reaction is very slow and only occurs partially, despite the large excess of M2+ cations with respect to the parent CsPbBr3 NCs (from 8 × 10³ to 3 × 10⁵, see Experimental Methods). The number of Pb2+ cations in a 9 nm CsPbBr3 NC is ∼3600 (unit cell volume: 0.2 nm3, NC volume: 729 nm3). This means that even in the low precursor concentration regime there is a 2-fold excess of guest M2+ cations with respect to Pb2+ implying that full exchange would be possible if a sufficiently strong driving force would be present. As it will be discussed below, the fact that the cation exchange does not reach completion despite the large M/Pb ratios used shows that the driving force is small and that the reaction may in fact be self-limited.
The use of metal bromide precursors has multiple benefits in our cation exchange protocol, leading to successful partial exchange of Pb2+ for M2+ cations in CsPbBr3 NCs, which results in doped CsPb1–xMxBr3 NCs. The presence of Br in the guest cation precursor allows us to take advantage of the ease of formation of halide vacancies in CsPbX3 NCs and to explore the fact that CsPbX3 NCs quickly establish an equilibrium with solvated halides in the solution phase, especially in the presence of amines, allowing fast cross-exchange between NCs with different halides.14,15 Given that MBr2 does not dissociate in toluene, it binds to the surface Br vacancies as a molecular unit, thereby incorporating MBr2 in the NC. This releases energy due to the formation of bonds between the incoming Br and the NC but does not consume energy because the M–Br bonds do not need to be broken. The energy released can then be used to break the bonds between a PbBr2 unit and the NC. Because the bonds formed and broken are similar, the energy balance is close to zero; therefore, the surface Pb2+ cations can be quickly exchanged into guest M2+ cations, despite the low temperatures, i.e., room temperature, used in our cation exchange protocol. To allow the cation exchange process to continue, two diffusion fluxes have to be established: inward diffusion of guest M2+ cations and outward diffusion of Pb2+ cations. As discussed above, these fluxes will be slow, since they have high activation energies, and will be primarily driven by the increase in entropy that results from the formation of CsPb1–xMxBr3 solid solutions. However, the exchange of Pb2+ by smaller M2+ cations leads to a progressive contraction of the lattice, which leads to strain within the NC. This increasing strain field counteracts the entropic gain, eventually becoming sufficiently strong to halt the cation exchange process. This could be a reason for a self-limited cation exchange, as we have observed here for several isovalent ions. A schematic representation of the cation exchange mechanism proposed above is given in Figure S17.
The fact that the lattice contraction (and therefore the extent of Pb2+ for M2+ exchange) does not directly scale with the concentration of MBr2 precursors but instead reaches a maximum at intermediate concentrations can be rationalized by considering that the cation exchange is actually driven by the concentration of halide vacancies in template CsPbBr3 NCs as discussed above. The formation of halide vacancies is promoted by the OLAM molecules present in solution,14,15 which nevertheless can form OLAM–Br complexes with halides from both NCs and MBr2 precursors. As a result, the increase in the concentration of MBr2 in the reaction medium will eventually decrease the cation exchange rates by outcompeting the NCs for the limited supply of OLAM, thereby decreasing the formation rate of halide vacancies.
We have also performed a series of experiments at fixed SnBr2/NC concentration and total volume but different OLAM concentrations (Figures S18 and S19). We find that the position of the PL peak after the reaction depends on the amount of OLAM present in solution, but the exact trend depends on the reaction time: For short reaction times (48 h, Figure S18), the blue-shift is larger for lower OLAM concentrations, while for longer reaction times (84 h, Figure S19), the opposite trend is observed. These observations are consistent with the mechanism proposed above and can be rationalized by considering that the cation exchange is driven by the formation of anion vacancies in the NCs, but it is rate-limited by inward diffusion of the guest cations, i.e., surface sites have to be made available to allow the process to proceed. Therefore, increasing the concentration of surface halide vacancies does not directly increase the extent of the cation exchange at shorter reaction times because the cation diffusion rates remain constant. Under these conditions, OLAM will extract from the NC surface not only Br but also SnBr2. Therefore, higher OLAM concentrations decrease the relative extent of the cation exchange in the short reaction time regime by shifting the equilibrium toward solvated SnBr2. The inward diffusion of SnBr2 competes with its removal from the surface by OLAM and, albeit slowly, gradually moves Sn2+ away from the surface, thereby incorporating it into the NC lattice. As a result, after sufficiently long reaction times, e.g., 84 h (Figure S19), the concentration of guest cations incorporated in the NCs will reflect the equilibrium concentration of halide vacancies and will thus be larger for higher OLAM concentrations. It should be noted that higher OLAM concentrations induce shape distortions and structural changes after long reaction times (Figure S19), indicating that large excesses of OLAM lead to partial deterioration of the NCs upon prolonged reaction times, probably due to an imbalance between the rate of formation of halide vacancies and the cation exchange rates. We have also observed that the PL intensity of the product CsPb1–xSnxBr3 NCs is higher for reactions carried out under higher OLAM concentrations (see Figure S18), which can be attributed to a better surface passivation, by either OLAM molecules or oleylammonium bromide formed in situ.30
Lattice Contraction and Blue-Shift of the Optical Transitions
Interestingly, the PL energy of doped CsPb1–xMxBr3 perovskite NCs scales linearly with that of the lattice vector (Figure 6) independently of the type of cation that has been incorporated. This is most evident for the Sn-doped NCs, for which more data points are available (Figure 6a), but it is also clear when the other two cations are taken into account (Figure 6b).
Figure 6.
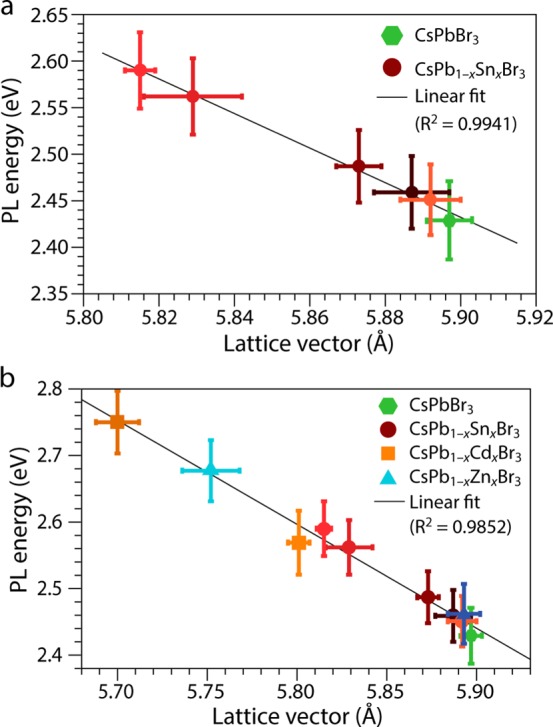
Photoluminescence (PL) energy and lattice vector correlation in CsPb1–xMxBr3 perovskite NCs. (a) PL energy as a function of the lattice vector in doped CsPb1–xSnxBr3 NCs obtained by postsynthetic Pb2+ for Sn2+ cation exchange in parent CsPbBr3 NCs. (b) PL energy as a function of the lattice vector in doped CsPb1–xMxBr3 (M= Sn, Cd, and Zn) NCs obtained by postsynthetic Pb2+ for M2+ cation exchange in parent CsPbBr3 NCs. The different colors of the symbols in panels a and b correspond to the colors used to identify the different samples in Figures 1 and 2
The band gaps of ABX3 perovskites are known to increase with the increase of the electronegativity of both B and X atoms and with the decrease of the unit cell volume.48 It is thus quite remarkable that the trends for the three cations are very similar despite their different radii, electronic configurations, and properties (Pb2+ [5d106s26p0]: r = 119 pm, electronegativity χ = 1.6; Sn2+ [4d105s25p0]: r = 118 pm, χ = 1.7; Cd2+ [4d105s0]: r = 95 pm, χ = 1.5; Zn2+ [3d104s0]: r = 74 pm, χ = 1.7; polarizability and Lewis hardness decrease from Pb2+ to Zn2+). This implies that the observed blue-shift of the optical transitions is primarily due to the lattice contraction, and that the MBr6 guest octahedra are electronically decoupled from the PbBr6 framework. This is particularly clear for the Sn-doped NCs, since it is reported in literature that the band gap of CsSnBr3 and CsPb1–xSnxBr3 are red-shifted with respect to that of CsPbBr3.49,50 This shows that the band-edge absorption and the PL transition of the CsPb1–xSnxBr3 NCs prepared in this work are solely determined by the PbBr6 octahedra, despite the presence of SnBr6 groups in the NC. The additional feature observed at lower energies (540–600 nm) in the absorption spectra of the CsPb1–xSnxBr3 NCs (Figure 1d) can thus be ascribed to these electronically isolated SnBr6 octahedra.
The PL transition of ABX3 halide perovskites has also been reported to blue-shift upon proceeding along the I, Br, and Cl series, as clearly illustrated by the PL tunability achieved by synthetic and postsynthetic compositional control in both bulk and nanocrystalline ABX3.14,15,51,52 Although this is accompanied by a contraction of the unit cell, the PL shift does not depend linearly on the lattice contraction, since the widening of the band gap is largely due to the increase in electronegativity along the halide series, which effectively increases the ionic character of the B–X bond.48,51,52
In fact, our work provides the first clear observation of a linear relationship between lattice vector and PL energy in perovskites. A recent work reported a blue-shift of the PL peak of bulk CsSnBr3 upon warming (lattice expansion),53 in striking contrast with our results. Similar observations, i.e., PL blue-shift with increasing temperature, have also been reported for CsPbBr3 NCs54 and bulk CsSnI3.55 However, it should be noted that this behavior (linear increase of the band gap with increasing temperature) is anomalous, since most semiconductors show the opposite temperature-dependence, i.e., linear increase of the band gap with decreasing temperature.55−58 This anomalous temperature dependence is also observed for copper halides (CuBr and CuCl), lead chalcogenides, and black phosphorus and has been attributed to a dominance of the lattice thermal expansion contribution over the electron–phonon interaction contribution.55,57 In the specific case of CsSnBr3 and CsPbBr3, the widening of the band gap upon lattice expansion is ascribed to simultaneous narrowing and stabilization of both the valence and conduction bands, as a result of the antibonding character of their maximum and minimum, respectively.53
PL shifts have also been recently reported for MAPbX3 bulk films and single crystals subjected to high pressures.59,60 Interestingly, small red-shifts (≤50 meV) were observed in the low-pressure regime (below 0.35–1 GPa), while strongly nonlinear blue-shifts (up to 200 meV) were observed in the high-pressure regime (above 1–2.5 GPa) and were ascribed to amorphization of the MAPbX3 lattice.59,60 This explanation is however inadequate for the PL blue-shifts reported in our work, since we do not observe any signs of loss of crystallinity, disorder, or phase transitions in the doped CsPb1–xMxBr3 NCs obtained by postsynthetic Pb2+ for M2+ cation exchange, despite very clear lattice contractions. It should be pointed out that also from this perspective the behavior of bulk ABX3 halide perovskites seems to be anomalous, since the PL of most common semiconductors, e.g., GaN and CdTe, blue-shifts linearly with increasing pressure.61,62
The behavior observed for the CsPb1–xMxBr3 NCs prepared in the present work by postsynthetic Pb2+ for M2+ cation exchange in 9 nm CsPbBr3 NCs is thus in line with the normal pressure dependence of the band gap energies of bulk semiconductors, but it is opposite to what is observed for bulk ABX3 halide perovskites.59,60 This is striking and is likely due to nanoscale effects. The contribution of quantum confinement effects to the blue-shift observed in the optical spectra of the CsPbBr3 NCs after the cation exchange reaction is however negligible, since the NCs under study here are larger than the estimated exciton Bohr diameter for CsPbBr3 (viz., 7 nm)1 and are therefore in the weak confinement regime. Although the reduction in the NC size should result in an increase in quantum confinement, the effect would be too small to account for the magnitude of the spectral shifts observed after the cation exchange reactions (up to 300 meV, which would require a size reduction from 9 to ∼5 nm, according to the theoretical size dependence of the band gap reported in ref (1)). Furthermore, Protesescu et al. have shown that blue-emitting CsPbBr3 NCs are in the sub 4 nm size regime,1 whereas the CsPb1–xMxBr3 NCs obtained in this work have a diameter of 9 nm and yet display efficient PL in the blue region of the electromagnetic spectrum.
We thus propose that the remarkable behavior observed here for doped CsPb1–xMxBr3 NCs indicates that they can accommodate larger isotropic compressive strains than bulk ABX3 halide perovskites, and as a result, all PbBr6 octahedra within a NC contract without significant (additional) distortion so that the compressive strain is homogeneously distributed throughout the NC (as indicated by Figure 3 above). Distortion and tilting of the BX6 octahedra is known to induce band gap reduction.48 These distortions are however always accompanied by lattice constant changes that act in the opposite direction, thereby decreasing the extent of the red-shift.48 Recent X-ray diffraction analysis of CsPbBr3 NCs suggests that orthorhombic distortions are an important feature of these materials.37 Although the linear relationship observed in the present work between the degree of lattice contraction and the blue-shift of the PL of CsPb1–xMxBr3 NCs (Figure 6) does not rule out the possibility of orthorhombic distortions in the NCs, it implies that their contribution does not significantly change with the nature of M or the extent of the replacement and therefore that the lattice contraction is the dominant effect. The contraction of the PbBr6 octahedra leads to shorter Pb–Br bonds and therefore stronger interactions between the Pb and Br orbitals. This widens the band gap because the conduction band minimum (CBM) is composed of the antibonding combinations between Pb(6p) and Br(4p) orbitals43 and therefore should shift to higher energies with stronger interactions. Although the valence band maximum is also antibonding,43 we expect it to shift less than the CBM because it emerges from the relatively weaker interaction between the Br(4p6) orbitals and the Pb(6s2) orbitals, which are stabilized by lone pair and relativistic effects.53 In contrast, the Pb(6p)–Br(4p) interaction is largely responsible for the chemical bonding in APbX3 perovskites as it leads to charge transfer from the Pb(6p) to the X(np) orbitals.43
Conclusions
We present a postsynthetic cation exchange method, which allows us to partially exchange Pb2+ ions in CsPbBr3 NCs for several other divalent cations (Sn2+, Cd2+, and Zn2+). This isovalent cation exchange results in a blue-shift of the PL bands, without loss of the high PLQYs (>60%), narrow emission bandwidth, and sharp excitonic absorption transitions. The blue-shift is attributed to contraction of the perovskite lattice due to the incorporation of smaller divalent guest cations (Sn2+/Cd2+/Zn2+), resulting in shorter Pb–halide bonds and hence an increased interaction between Pb and Br orbitals. We show that the blue-shifted PL energy scales linearly with the lattice vector of the doped CsPb1–xMxBr3 NCs, in striking contrast to what has been reported for bulk perovskite materials. This is the first example of postsynthetic cation exchange in CsPbBr3 perovskite NCs, demonstrating that halide perovskite NCs are the only known system in which the complete composition can be postsynthetically tailored with size and shape preservation by sequentially combining topotactic anion and cation exchanges. This opens up a library of possible compositions attainable for colloidal CsPbX3 NCs, which might possess unprecedented and unparalleled optoelectronic properties and may prove beneficial for a number of applications.
Experimental Methods
Materials
Cesium carbonate (Cs2CO3, 99.9%), 1-octadecene (ODE, 90%), oleic acid (OA, 90%), lead bromide (PbBr2, 99.999%), oleylamine (OLAM, 70%), tin(II) bromide (SnBr2), cadmium bromide tetrahydrate (CdBr2·4H2O, 98%), zinc bromide (ZnBr2, 99.999%), anhydrous toluene (99.8%), anhydrous hexane (95%), and anhydrous methyl acetate (99.5%) were obtained from Sigma-Aldrich. OLAM and OA were degassed at 120 °C for 1 h prior to use. All others chemicals were used as received.
CsPbBr3 Nanocrystal Synthesis
The CsPbBr3 NCs were prepared according to the method described by Protesescu et al.1 First, Cs-oleate precursor stock solution was prepared by loading 0.814 g of Cs2CO3 , 2.5 mL of OA, and 40 mL of ODE into a 100 mL round-bottomed flask. The mixture was dried under vacuum for approximately 1 h at 120 °C and then heated under N2 to 150 °C until all Cs2CO3 had reacted with OA. ODE (5 mL) and PbBr2 (0.069 g) were loaded into a separate 25 mL flask and dried under vacuum for 1 h at 120 °C. OLAM (0.5 mL) and OA (0.5 mL) were injected at 120 °C under N2 atmosphere. After PbBr2 had dissolved, the temperature was raised to 180 °C and a 0.4 mL portion of the Cs-oleate stock solution was quickly injected. We note that the Cs-oleate stock solution had to be preheated to ∼100 °C before injection. After 5–10 s, the reaction mixture was cooled by an ice-water bath in order to quench the reaction.
Purification of the Nanocrystals
The CsPbBr3 NCs were purified following the method described by De Roo et al.30 (for a synthesis based on 69 mg of PbBr2). The crude synthesis solution was centrifuged for 3 min at 10 000 rpm, and the colored supernatant was discarded. Then, 300 μL of hexane was added, and the NCs were dispersed using a vortex mixer. Subsequently, the suspension was again centrifuged for 3 min at 10 000 rpm, after which the precipitate, containing larger NCs and agglomerates, was discarded. Another 300 μL of hexane was added to the supernatant, resulting in a colloidal dispersion of CsPbBr3 NCs.
A second purification procedure, based on recent work by Luther and co-workers,7 was also used for a few selected samples of colloidal perovskite NCs after Pb2+ for Sn2+ cation exchange (see below). The additional purification of the colloidal CsPb1–xSnxBr3 perovskite NCs was performed by adding 1 mL of methyl acetate to the crude NC solution, followed by centrifugation at 13 000 rpm for 1 h. The amount of precipitate was extremely small. After removing the supernatant, the precipitate was redispersed in 300 μL of hexane. Subsequently, 300 μL of methyl acetate was added, and the NCs were again centrifuged at 13 000 rpm. The supernatant was discarded, and the even smaller amount of precipitate was redispersed in 50 μL of hexane before being dropcast on a copper TEM grid for further analysis.
Cation Exchange
Cation exchange precursor stock solutions were prepared by dissolving 1 mmol of metalbromide salt (MBr2, with M = Sn2+, Zn2+, and Cd2+) in 10 mL of toluene (0.1 M MBr2), in the presence of 100 μL of OLAM. In a typical cation exchange experiment, 1.5 mL of diluted NCs in toluene (concentration: ∼0.01 μM, using an extinction coefficient of 37.9 cm–1 μM–1 at 335 nm, for cubes of roughly 9 nm)30 and 0.5 mL of cation precursor (different concentrations, ranging between 0.125 and 1.67 mM, [M2+]/[NC] ratio varied between ∼8000 and ∼300 000) were mixed and stirred at room temperature for ∼16 h. In the majority of the cases, the NCs were not purified after the cation exchange reactions, due to difficulties with precipitation of the NCs. The second purification procedure described above, in which methyl acetate is used as antisolvent, was applied to a few selected samples after reaction with SnBr2 but yielded only very small amounts of NCs, only enough to get submonolayer coverage on a TEM grid.
The influence of the amount of OLAM was investigated by replacing a volume of toluene (5, 10, or 30 μL) by OLAM, while keeping all other variables unchanged, i.e., total volume, concentration of NCs and SnBr2, as well as the SnBr2/NCs ratio. The products of the reaction were analyzed after 48 and 84 h.
Transmission Electron Microscopy and Energy Dispersive X-ray Spectroscopy
TEM measurements were performed using a Tecnai20F (FEI) microscope equipped with a field-emission gun and a Gatan 694 CCD camera. The microscope was operated at 200 kV. EDS measurements were performed on FEI Talos F200X and an aberration corrected “cubed” FEI Titan 60–300 electron microscope equipped with a ChemiSTEM system63 operated at 200 and 300 kV, respectively. Acquisition time for EDS measurements was ∼300 s. Samples for TEM imaging were prepared by dripping a diluted nanocrystal solution in toluene on a carbon-coated polymer film copper grid (300 mesh). The solvent (toluene) was allowed to evaporate prior to imaging.
HAADF-STEM
High-resolution high-angle annular dark field scanning transmission electron microscopy (HAADF-STEM) measurements were performed using an aberration corrected cubed FEI Titan 60–300 electron microscope operated at 300 kV.
1D Powder Electron Diffraction
PED patterns were obtained by azimuthally integrating the 2D ED patterns (with the freely available software package CrysTBox)33 acquired on a Tecnai-12 transmission electron microscope using a selected-area aperture. 2D ED patterns were acquired on areas containing a large number of nanocrystals to make the 1D PED patterns statistically valid (see Supplementary Method 1 and Figures S5 and S6 for details).
Optical Spectroscopy
Samples for optical measurements were prepared by diluting the colloidal dispersion of NCs with anhydrous toluene under nitrogen and storing them in sealed quartz cuvettes. Absorption spectra were measured on a double-beam PerkinElmer Lambda 16 UV/vis spectrometer. PL spectra were recorded on an Edinburgh Instruments FLS920 Spectrofluorimeter equipped with a 450 W xenon lamp as excitation source and double grating monochromators. PL decay curves were obtained by time-correlated single-photon counting on a Hamamatsu H7422–02 photomultiplier tube with low dark count rate (<10 cts/s). A pulsed diode laser (EPL-445 Edinburgh Instruments, 375 nm, 55 ps pulse width, 0.2 MHz repetition rate) was used as the excitation source.
Photoluminescence Quantum Yields
The PLQYs of the perovskite NCs were determined with respect to the fluorophore Lumogen red 350 (PLQY = 95%).64 Samples for PLQY measurements were prepared by diluting the colloidal dispersion of NCs with anhydrous toluene under nitrogen in sealed quartz cuvettes, keeping the optical density of both the Lumogen Red and the perovskite NCs below 0.1 at 442 nm in order to minimize reabsorption. The absorption and PL emission spectra were measured using the instruments mentioned above. The PLQYs were calculated using the following equation:
in which T is the transmission at 442 nm of the sample, Tref is the transmission at 442 nm of Lumogen Red, Φ is the integrated PL photon flux of the sample, Φref is the integrated PL photon flux of Lumogen Red, and QYref is the QY of Lumogen Red (95%) (see Supplementary Method 2 and Figure S20 for more details).
Acknowledgments
W.v.d.S. and C.d.M.D. acknowledge financial support from the division of Chemical Sciences (CW) of The Netherlands Organization for Scientific Research (NWO) under grant number ECHO.712.012.001. J.J.G. and D.V. acknowledge financial support from the Debye Graduate program. S.B. acknowledges financial support from the European Research Council (ERC Starting Grant # 335078-COLOURATOMS). K.H.W.v.d.B., S.B., S.V.A. and T.A. acknowledge financial support from the Research Foundation Flanders (FWO, Belgium) through project fundings (G.0374.13N, G.0368.15N, G.0369.15N), a Ph.D. grant to K.H.W.v.d.B, and a postdoctoral research grant to T.A.
Supporting Information Available
The Supporting Information is available free of charge on the ACS Publications website at DOI: 10.1021/jacs.6b13079.
PLQY measurements, in situ absorption measurements, PL lifetime measurements, additional TEM images and ED patterns for CsPb1–xSnxBr3 NCs and CsPb1–xZnxBr3 NCs, EDS spectra of CsPbBr3 NCs, CsPb1–xSnxBr3 NCs, CsPb1–xZnxBr3 NCs, and CsPb1–xCdxBr3 NCs, HRTEM images of CsPbBr3 NCs, PL spectra of CsPb1–xSnxBr3 NCs after reaction with higher concentration of OLAM, and supplementary methods (PDF)
Author Present Address
W.v.d.S.: Optoelectronic Materials Section, Department of Chemical Engineering, Delft University of Technology, van der Maasweg 9, 2629 HZ Delft, The Netherlands.
Author Contributions
W.v.d.S. and J.J.G. contributed equally to this work.
The authors declare no competing financial interest.
Supplementary Material
References
- Protesescu L.; Yakunin S.; Bodnarchuk M. I.; Krieg F.; Caputo R.; Hendon C. H.; Yang R. X.; Walsh A.; Kovalenko M. V. Nano Lett. 2015, 15, 3692. 10.1021/nl5048779. [DOI] [PMC free article] [PubMed] [Google Scholar]
- Weidman M. C.; Seitz M.; Stranks S. D.; Tisdale W. A. ACS Nano 2016, 10, 7830. 10.1021/acsnano.6b03496. [DOI] [PubMed] [Google Scholar]
- Sun S.; Yuan D.; Xu Y.; Wang A.; Deng Z. ACS Nano 2016, 10, 3648. 10.1021/acsnano.5b08193. [DOI] [PubMed] [Google Scholar]
- Yakunin S.; Protesescu L.; Krieg F.; Bodnarchuk M. I.; Nedelcu G.; Humer M.; De Luca G.; Fiebig M.; Heiss W.; Kovalenko M. V. Nat. Commun. 2015, 6, 8056. 10.1038/ncomms9056. [DOI] [PMC free article] [PubMed] [Google Scholar]
- Xu Y.; Chen Q.; Zhang C.; Wang R.; Wu H.; Zhang X.; Xing G.; Yu W. W.; Wang X.; Zhang Y.; Xiao M. J. Am. Chem. Soc. 2016, 138, 3761. 10.1021/jacs.5b12662. [DOI] [PubMed] [Google Scholar]
- Zhang X.; Lin H.; Huang H.; Reckmeier C.; Zhang Y.; Choy W. C. H.; Rogach A. L. Nano Lett. 2016, 16, 1415. 10.1021/acs.nanolett.5b04959. [DOI] [PubMed] [Google Scholar]
- Swarnkar A.; Marshall A. R.; Sanehira E. M.; Chernomordik B. D.; Moore D. T.; Christians J. A.; Chakrabarti T.; Luther J. M. Science 2016, 354 (6308), 92. 10.1126/science.aag2700. [DOI] [PubMed] [Google Scholar]
- Lignos I.; Stavrakis S.; Nedelcu G.; Protesescu L.; de Mello A. J.; Kovalenko M. V. Nano Lett. 2016, 16, 1869. 10.1021/acs.nanolett.5b04981. [DOI] [PubMed] [Google Scholar]
- Zhang D.; Eaton S. W.; Yu Y.; Dou L.; Yang P. J. Am. Chem. Soc. 2015, 137, 9230. 10.1021/jacs.5b05404. [DOI] [PubMed] [Google Scholar]
- Imran M.; Di Stasio F.; Dang Z.; Canale C.; Khan A. H.; Shamsi J.; Brescia R.; Prato M.; Manna L. Chem. Mater. 2016, 28, 6450. 10.1021/acs.chemmater.6b03081. [DOI] [PMC free article] [PubMed] [Google Scholar]
- Akkerman Q. A.; Motti S. G.; Srimath Kandada A. R.; Mosconi E.; D’Innocenzo V.; Bertoni G.; Marras S.; Kamino B. A.; Miranda L.; De Angelis F.; Petrozza A.; Prato M.; Manna L. J. Am. Chem. Soc. 2016, 138, 1010. 10.1021/jacs.5b12124. [DOI] [PMC free article] [PubMed] [Google Scholar]
- Sichert J. A.; Tong Y.; Mutz N.; Vollmer M.; Fischer S.; Milowska K. Z.; García Cortadella R.; Nickel B.; Cardenas-Daw C.; Stolarczyk J. K.; Urban A. S.; Feldmann J. Nano Lett. 2015, 15, 6521. 10.1021/acs.nanolett.5b02985. [DOI] [PubMed] [Google Scholar]
- Protesescu L.; Yakunin S.; Bodnarchuk M. I.; Bertolotti F.; Masciocchi N.; Guagliardi A.; Kovalenko M. V. J. Am. Chem. Soc. 2016, 138, 14202. 10.1021/jacs.6b08900. [DOI] [PMC free article] [PubMed] [Google Scholar]
- Nedelcu G.; Protesescu L.; Yakunin S.; Bodnarchuk M. I.; Grotevent M. J.; Kovalenko M. V. Nano Lett. 2015, 15, 5635. 10.1021/acs.nanolett.5b02404. [DOI] [PMC free article] [PubMed] [Google Scholar]
- Akkerman Q. A.; D’Innocenzo V.; Accornero S.; Scarpellini A.; Petrozza A.; Prato M.; Manna L. J. Am. Chem. Soc. 2015, 137, 10276. 10.1021/jacs.5b05602. [DOI] [PMC free article] [PubMed] [Google Scholar]
- Hodges J. M.; Kletetschka K.; Fenton J. L.; Read C. G.; Schaak R. E. Angew. Chem., Int. Ed. 2015, 54, 8567. 10.1002/anie.201505502. [DOI] [PubMed] [Google Scholar]
- Wu H.; Sato R.; Yamaguchi A.; Kimura M.; Haruta M.; Kurata H.; Teranishi T. Science 2016, 351, 1306. 10.1126/science.aad5520. [DOI] [PubMed] [Google Scholar]
- Beberwyck B. J.; Surendranath Y.; Alivisatos A. P. J. Phys. Chem. C 2013, 117, 19759. 10.1021/jp405989z. [DOI] [Google Scholar]
- Gupta S.; Kershaw S. V.; Rogach A. L. Adv. Mater. 2013, 25, 6923. 10.1002/adma.201302400. [DOI] [PubMed] [Google Scholar]
- De Trizio L.; Manna L. Chem. Rev. 2016, 116, 10852. 10.1021/acs.chemrev.5b00739. [DOI] [PMC free article] [PubMed] [Google Scholar]
- van der Stam W.; Bladt E.; Rabouw F. T.; Bals S.; de Mello Donega C. ACS Nano 2015, 9, 11430. 10.1021/acsnano.5b05496. [DOI] [PMC free article] [PubMed] [Google Scholar]
- Li H.; Brescia R.; Krahne R.; Bertoni G.; Alcocer M. J. P.; D’Andrea C.; Scotognella F.; Tassone F.; Zanella M.; De Giorgi M.; Manna L. ACS Nano 2012, 6, 1637. 10.1021/nn204601n. [DOI] [PubMed] [Google Scholar]
- Schwartz D. A.; Norberg N. S.; Nguyen Q. P.; Parker J. M.; Gamelin D. R. J. Am. Chem. Soc. 2003, 125, 13205. 10.1021/ja036811v. [DOI] [PubMed] [Google Scholar]
- Knowles K. E.; Nelson H. D.; Kilburn T. B.; Gamelin D. R. J. Am. Chem. Soc. 2015, 137, 13138. 10.1021/jacs.5b08547. [DOI] [PubMed] [Google Scholar]
- Meinardi F.; Colombo A.; Velizhanin K. A.; Simonutti R.; Lorenzon M.; Beverina L.; Viswanatha R.; Klimov V. I.; Brovelli S. Nat. Photonics 2014, 8, 392. 10.1038/nphoton.2014.54. [DOI] [Google Scholar]
- Pérez-del-Rey D.; Forgács D.; Hutter E. M.; Savenije T. J.; Nordlund D.; Schulz P.; Berry J. J.; Sessolo M.; Bolink H. J. Adv. Mater. 2016, 28, 9839. 10.1002/adma.201603016. [DOI] [PubMed] [Google Scholar]
- Frolova L. A.; Anokhin D. V.; Gerasimov K. L.; Dremova N. N.; Troshin P. A. J. Phys. Chem. Lett. 2016, 7, 4353. 10.1021/acs.jpclett.6b02122. [DOI] [PubMed] [Google Scholar]
- Abdelhady A. L.; Saidaminov M. I.; Murali B.; Adinolfi V.; Voznyy O.; Katsiev K.; Alarousu E.; Comin R.; Dursun I.; Sinatra L.; Sargent E. H.; Mohammed O. F.; Bakr O. M. J. Phys. Chem. Lett. 2016, 7, 295. 10.1021/acs.jpclett.5b02681. [DOI] [PubMed] [Google Scholar]
- Liu W.; Lin Q.; Li H.; Wu K.; Robel I.; Pietryga J. M.; Klimov V. I. J. Am. Chem. Soc. 2016, 138, 14954. 10.1021/jacs.6b08085. [DOI] [PubMed] [Google Scholar]
- De Roo J.; Ibáñez M.; Geiregat P.; Nedelcu G.; Walravens W.; Maes J.; Martins J. C.; Van Driessche I.; Kovalenko M. V.; Hens Z. ACS Nano 2016, 10, 2071. 10.1021/acsnano.5b06295. [DOI] [PubMed] [Google Scholar]
- van Driel A. F.; Nikolaev I. S.; Vergeer P.; Lodahl P.; Vanmaekelbergh D.; Vos W. L. Phys. Rev. B: Condens. Matter Mater. Phys. 2007, 75, 035329. 10.1103/PhysRevB.75.035329. [DOI] [Google Scholar]
- Delerue C.; Lannoo M.. Nanostructures - Theory and Modeling; Springer: Berlin, 2004. [Google Scholar]
- Klinger M.; Jäger A. J. Appl. Crystallogr. 2015, 48, 2012. 10.1107/S1600576715017252. [DOI] [PMC free article] [PubMed] [Google Scholar]
- Atkins P. W.; Overton T.; Rourke J.; Weller M.; Armstrong F.. Shriver & Atkins’ Inorganic Chemistry, 5th ed.; Oxford University Press: Oxford, U.K., 2010. [Google Scholar]
- van Aert S.; Verbeeck J.; Erni R.; Bals S.; Luysberg M.; van Dyck D.; van Tendeloo G. Ultramicroscopy 2009, 109, 1236. 10.1016/j.ultramic.2009.05.010. [DOI] [PubMed] [Google Scholar]
- de Backer A.; van den Bos K. H. W.; van den Broek W.; Sijbers J.; van Aert S. Ultramicroscopy 2016, 171, 104. 10.1016/j.ultramic.2016.08.018. [DOI] [PubMed] [Google Scholar]
- Cottingham P.; Brutchey R. L. Chem. Commun. 2016, 52, 5246. 10.1039/C6CC01088A. [DOI] [PubMed] [Google Scholar]
- Student Biometrika 1908, 6, 1. 10.1093/biomet/6.1.1. [DOI] [Google Scholar]
- Boles M. A.; Ling D.; Hyeon T.; Talapin D. V. Nat. Mater. 2016, 15, 141. 10.1038/nmat4526. [DOI] [PubMed] [Google Scholar]
- Walsh A.; Scanlon D. O.; Chen S.; Gong X. G.; Wei S.-H. Angew. Chem., Int. Ed. 2015, 54, 1791. 10.1002/anie.201409740. [DOI] [PMC free article] [PubMed] [Google Scholar]
- Yang T.-Y.; Gregori G.; Pellet N.; Gratzel M.; Maier J. Angew. Chem., Int. Ed. 2015, 54, 7905. 10.1002/anie.201500014. [DOI] [PubMed] [Google Scholar]
- Buin A.; Pietsch P.; Xu J.; Voznyy O.; Ip A. H.; Comin R.; Sargent E. H. Nano Lett. 2014, 14, 6281. 10.1021/nl502612m. [DOI] [PubMed] [Google Scholar]
- Brandt R. E.; Stevanović V.; Ginley D. S.; Buonassisi T. MRS Commun. 2015, 5, 265. 10.1557/mrc.2015.26. [DOI] [Google Scholar]
- Groeneveld E.; Witteman L.; Lefferts M.; Ke X.; Bals S.; van Tendeloo G.; de Mello Donega C. ACS Nano 2013, 7, 7913. 10.1021/nn402931y. [DOI] [PubMed] [Google Scholar]
- Lesnyak V.; Brescia R.; Messina G. C.; Manna L. J. Am. Chem. Soc. 2015, 137, 9315. 10.1021/jacs.5b03868. [DOI] [PMC free article] [PubMed] [Google Scholar]
- van der Stam W.; Berends A. C.; Rabouw F. T.; Willhammar T.; Ke X.; Meeldijk J. D.; Bals S.; de Mello Donega C. Chem. Mater. 2015, 27, 621. 10.1021/cm504340h. [DOI] [Google Scholar]
- Eames C.; Frost J. M.; Barnes P. R. F.; O’Regan B. C.; Walsh A.; Islam M. S. Nat. Commun. 2015, 6, 7497. 10.1038/ncomms8497. [DOI] [PMC free article] [PubMed] [Google Scholar]
- Castelli I. E.; Garcia-Lastra J. M.; Thygesen K. S.; Jacobsen K. W. APL Mater. 2014, 2, 081514. 10.1063/1.4893495. [DOI] [Google Scholar]
- Jellicoe T. C.; Richter J. M.; Glass H. F. J.; Tabachnyk M.; Brady R.; Dutton S. E.; Rao A.; Friend R. H.; Credgington D.; Greenham N. C.; Böhm M. L. J. Am. Chem. Soc. 2016, 138, 2941. 10.1021/jacs.5b13470. [DOI] [PubMed] [Google Scholar]
- Hao F.; Stoumpos C. C.; Chang R. P. H.; Kanatzidis M. G. J. Am. Chem. Soc. 2014, 136, 8094. 10.1021/ja5033259. [DOI] [PubMed] [Google Scholar]
- Chen Q.; De Marco N.; Yang Y.; Song T.-Z.; Chen C.-C.; Zhao H.; Hong Z.; Zhou H.; Yang Y. Nano Today 2015, 10, 355. 10.1016/j.nantod.2015.04.009. [DOI] [Google Scholar]
- Li C.; Wei J.; Sato M.; Koike H.; Xie Z.-Z.; Li Y.-Q.; Kanai K.; Kera S.; Ueno N.; Tang J.-X. ACS Appl. Mater. Interfaces 2016, 8, 11526. 10.1021/acsami.6b02692. [DOI] [PubMed] [Google Scholar]
- Fabini D. H.; Laurita G.; Bechtel J. S.; Stoumpos C. C.; Evans H. A.; Kontos A. G.; Raptis Y. S.; Falaras P.; Van der Ven A.; Kanatzidis M. G.; Seshadri R. J. Am. Chem. Soc. 2016, 138, 11820. 10.1021/jacs.6b06287. [DOI] [PubMed] [Google Scholar]
- Wei K.; Xu Z.; Chen R.; Zheng X.; Cheng X.; Jiang T. Opt. Lett. 2016, 41, 3821. 10.1364/OL.41.003821. [DOI] [PubMed] [Google Scholar]
- Yu C.; Chen Z.; Wang J. J.; Pfenninger W.; Vockic N.; Kenney J. T.; Shum K. J. Appl. Phys. 2011, 110, 063526. 10.1063/1.3638699. [DOI] [Google Scholar]
- Cardona M.; Thewalt M. L. W. Rev. Mod. Phys. 2005, 77, 1173. 10.1103/RevModPhys.77.1173. [DOI] [Google Scholar]
- Villegas C. E. P.; Rocha A. R.; Marini A. Nano Lett. 2016, 16, 5095. 10.1021/acs.nanolett.6b02035. [DOI] [PubMed] [Google Scholar]
- Osherov A.; Hutter E. M.; Galkowski K.; Brenes R.; Maude D. K.; Nicholas R. J.; Plochocka P.; Bulovic V.; Savenije T. J.; Stranks S. D. Adv. Mater. 2016, 28, 10757. 10.1002/adma.201604019. [DOI] [PubMed] [Google Scholar]
- Wang Y.; Lu X.; Yang W.; Wen T.; Yang L.; Ren X.; Wang L.; Lin Z.; Zhao Y. J. Am. Chem. Soc. 2015, 137, 11144. 10.1021/jacs.5b06346. [DOI] [PubMed] [Google Scholar]
- Szafranski M.; Katrusiak A. J. Phys. Chem. Lett. 2016, 7, 3458. 10.1021/acs.jpclett.6b01648. [DOI] [PubMed] [Google Scholar]
- Teisseyre H.; Perlin P.; Suski T.; Grzegory I.; Jun J.; Porowski S. J. Phys. Chem. Solids 1995, 56, 353. 10.1016/0022-3697(94)00196-0. [DOI] [PubMed] [Google Scholar]
- Gilliland S.; Gonzalez J.; Guder H. S.; Segura A.; Mora I.; Munoz V. Phys. Status Solidi B 2003, 235, 441. 10.1002/pssb.200301599. [DOI] [Google Scholar]
- Schlossmacher P.; Klenov D. O.; Freitag B.; Von Harrach H. S. Microsc. Today 2010, 18, 14. 10.1017/S1551929510000404. [DOI] [Google Scholar]
- de Mello Donega C.; Hickey S. G.; Wuister S. F.; Vanmaekelbergh D.; Meijerink A. J. Phys. Chem. B 2003, 107, 489. 10.1021/jp027160c. [DOI] [Google Scholar]
Associated Data
This section collects any data citations, data availability statements, or supplementary materials included in this article.