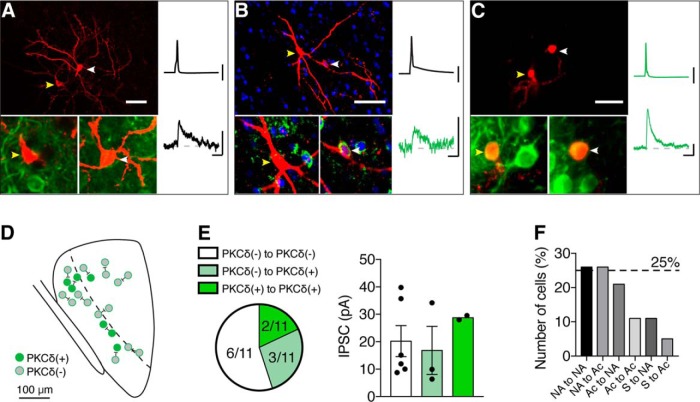
Figure 7.
PKCδ(+) and PKCδ(−) neurons form local connections in the CeL. A–C, Example images (left-hand panels; scale bars, 50 µm) of connected cells that were biocytin filled and recovered with a fluorescent streptavidin (red). Insets show closeups of each cell with PKCδ staining (green fluorescence; DAPI is shown in blue in B to help locate the postsynaptic neuron). Yellow arrowheads indicate the presynaptic neuron, and white arrowheads indicate the postsynaptic neuron. Example average traces for each recovered pair are shown in the right-hand panels, Calibration: 50 mV, 10 pA, 20 ms. A, PKCδ(−) → PKCδ(−) connection. B, PKCδ(−) → PKCδ(+) connection. C, PKCδ(+) → PKCδ(+) connection. D, Approximate locations of each successfully identified pair. E, Connected paired recordings were predominantly between PKCδ(−) cells (∼ 55%; 6 of 11 successfully recovered and stained connected paired recordings), whereas ∼27% of connections were PKCδ(−) → PKCδ(+) (3 of 11) and ∼18% (2 of 11) were PKCδ(+) → PKCδ(+). No PKCδ(+) → PKCδ(−) connections were observed in these experiments. IPSC amplitudes of each type were as follows: PKCδ(−) → PKCδ(−), 20.23 ± 5.6 pA; PKCδ(−) → PKCδ(+), 16.8 ± 8.7 pA; PKCδ(+) → PKCδ(+), 28.75 ± 0.7 pA. F, In terms of firing properties, the majority of connections occurred between LF-NA → LF-NA (∼26%, n = 5 of 19), LF-NA → ES-Ac (∼26%, n = 5 of 19), and ES-Ac → LF-NA (∼21%, 4 of 19) neurons. ES-Ac → ES-Ac connections were less common (∼11%, 2 of 19), and in all connections that involved a stuttering (S) neuron (∼16%, n = 3 of 19), the S neuron was the presynaptic cell.

