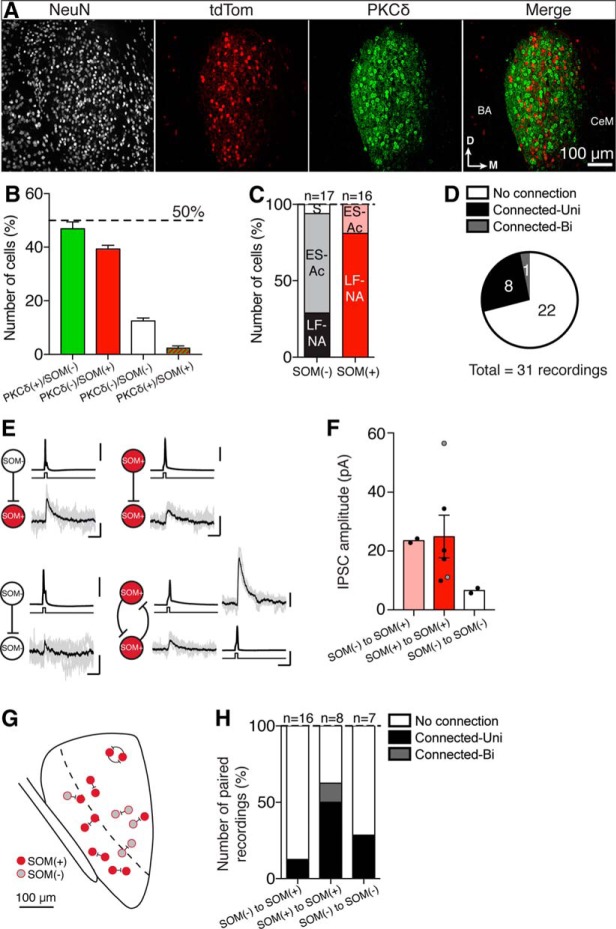
Figure 8.
Somatostatin-positive neurons form local connections in the central lateral amygdala of somatostatin-cre mice. The CeL of SOM-Cre C57BL/6J mice was injected with an AAV-DIO-tdtomato to fluorescently label SOM(+) cells. A, Subsections (50 µm thick) of injected CeL were stained with a NeuN antibody and a PKCδ antibody. Representative sections at bregma −1.60 mm are shown. B, NeuN-positive cells were counted for PKCδ and SOM labeling; 47 ± 3% (mean, n = 122 ± 27 neurons/1.3 × 10−3 mm3) of total counted neurons were PKCδ(+) but SOM(−), whereas 39 ± 1% (mean, n = 100 ± 16 neurons/1.3 × 10−3 mm3) of total neurons were SOM(+)/PKCδ(−), with very little overlap [i.e., SOM(+) and PKCδ(+): 2 ± 1% (mean, n = 3 ± 1 neurons/1.3 × 10−3 mm3) and 12 ± 1% negative for both (mean, n = 32 ± 6 neurons/1.3 × 10−3 mm3)]. C, Whole-cell recordings were performed and complete firing properties for 33 neurons were recorded from SOM(+) and SOM(−) neurons. As with wild-type mice LF-NA (∼55%), ES-Ac (∼42%) and stuttering (S; 3%) neurons were observed. SOM(−) neurons were mostly ES-Ac (∼65%, LF-NA 29%, S 6%, n = 17 neurons), whereas SOM(+) neurons were mostly LF-NA (∼81%, ES-Ac 19%, n = 16 neurons). D, ∼29% of paired recordings showed either a unidirectional (n = 8 paired recordings) or bidirectional (n = 1 paired recording) connection, whereas in 71% of recordings no connection was detected. E, Unidirectional connections were observed between different combinations of SOM(−) and SOM(+) neurons: SOM(−) → SOM(+) (n = 2); SOM(+) → SOM(+) (n = 4); SOM(−) → SOM(−) (n = 2); and one bidirectional connection was recorded that occurred between two SOM(+) neurons. Calibration: 50 mV, 20 pA, 20 ms. Current injection applied to the presynaptic cell is illustrated in black under each trace. F, Shows IPSC amplitudes for each connection type: SOM(−) → SOM(+) mean amplitude, 23.5 pA (n = 2 pairs); SOM(+) → SOM(+) mean amplitude, 24.9 ± 7.3 pA (n = 5 pairs – 4 unidirectional IPSCs, 2 bidirectional IPSCs); SOM(−) → SOM(−) mean amplitude, 6.6 pA (n = 2 pairs). Gray dots represent IPSCs from the bidirectional connection. G, Diagram showing the approximate location of connected paired recordings within the CeL. H, Shows the number of paired recordings where a connection either was or was not detected for each SOM(+) and SOM(−) combination. A connection was more likely to be observed when recording from two SOM(+) neurons (∼62% connection success rate) as opposed to a SOM(−) → SOM(+) (∼12% connection success rate) or a SOM(−) → SOM(−) combination (∼28% connection success rate).

