Abstract
Background:
Glioma, the most common primary brain neoplasm, describes a heterogeneous tumor of multiple histologic subtypes and cellular origins. At clinical presentation, gliomas are graded according to the World Health Organization guidelines (WHO), which reflect the malignant characteristics of the tumor based on histopathological and molecular features. Lower grade diffuse gliomas (LGGs) (WHO Grade II–III) have fewer malignant characteristics than high-grade gliomas (WHO Grade IV), and a better clinical prognosis, however, accurate discrimination of overall survival (OS) remains a challenge. In this study, we aimed to identify tissue-derived image features using a machine learning approach to predict OS in a mixed histology and grade cohort of lower grade glioma patients. To achieve this aim, we used H and E stained slides from the public LGG cohort of The Cancer Genome Atlas (TCGA) to create a machine learned dictionary of “image-derived visual words” associated with OS. We then evaluated the combined efficacy of using these visual words in predicting short versus long OS by training a generalized machine learning model. Finally, we mapped these predictive visual words back to molecular signaling cascades to infer potential drivers of the machine learned survival-associated phenotypes.
Methods:
We analyzed digitized histological sections downloaded from the LGG cohort of TCGA using a bag-of-words approach. This method identified a diverse set of histological patterns that were further correlated with OS, histology, and molecular signaling activity using Cox regression, analysis of variance, and Spearman correlation, respectively. A support vector machine (SVM) model was constructed to discriminate patients into short and long OS groups dichotomized at 24-month.
Results:
This method identified disease-relevant phenotypes associated with OS, some of which are correlated with disease-associated molecular pathways. From these image-derived phenotypes, a generalized SVM model which could discriminate 24-month OS (area under the curve, 0.76) was obtained.
Conclusion:
Here, we demonstrated one potential strategy to incorporate image features derived from H and E stained slides into predictive models of OS. In addition, we showed how these image-derived phenotypic characteristics correlate with molecular signaling activity underlying the etiology or behavior of LGG.
Keywords: Bog-of-words, low-grade glioma, machine learning, machine vision
Introduction
Classification and grading of gliomas have recently been updated to include molecular information in addition to histological information. In general, gliomas are Graded from I to IV. Grade II represents low-grade gliomas and Grades III and IV are progressively higher in malignancy status, as determined by the presence or absence of certain histological features, including mitotically active cells, endothelial proliferation, nuclear atypia, microvascular proliferation, and presence of absence of necrosis.[1] Patients with this disease have highly variable overall survival (OS) ranging from a few months to several years.[2,3] Such variation in the disease evolution of lower grade diffuse gliomas (LGGs) creates significant challenges for prognostication and management.[4,5] The ability to accurately predict OS outcome would facilitate the design of appropriate surveillance and/or treatment strategies to assess disease aggressiveness.[2,6,7] Toward the construction of such models, it is essential to first identify tumor-derived factors that have previously been associated with the likely course of the disease. To date, several tumor-derived features have been reported to be associated OS; these include clinical variables, including patient age and extent of resection, whether the tumor crosses the midline, neurological deficits, and astrocytic histology; imaging variables, including enhancing fraction, tumor volume; and molecular alterations, such as isocitrate dehydrogenase (IDH1/2) mutation status (collectively referred to as IDH mutations), MGMT promoter methylation status, 1p and 19q chromosomal arm co-deletion, and TP53 mutation.[8,9,10] More recently, studies by the LGG working group of The Cancer Genome Atlas (TCGA) have identified multiple molecular subtypes of LGG – predominantly IDH wild-type, IDH mutant with 1p and 19q co-deleted, and IDH mutant-only groups.[11,12] Using these groupings, it has been shown that IDH wild-type LGGs have molecular characteristics and behavior such as glioblastoma and have been associated with shorter OS.[12,13] On the other hand, LGGs with astrocytic lineage (astrocytomas) are seen to be more aggressive relative to those with oligodendroglial origin. These have fairly diverse morphological characteristics (e.g., “fried egg” morphology for oligodendroglioma (OD) vs. highly pleomorphic, atypical nuclei for astrocytomas.[14] Therefore, morphological features that capture this information have been explored in the classification of this disease.[15,16] The availability of public domain Hematoxylin & Eosin (H and E) slide data from efforts such as the TCGA permits the use of such data for the inference of data-derived phenotypic characteristics that might serve to complement the molecular markers for the diagnosis and prognosis of disease. Indeed, an integrated phenotypic-genotypic classification systems are now being implemented to increase the prognostic value of the classifications.[17] Thus, there is a recognition that integrative features can better prognosticate disease outcome; however, the roles of machine learned visual dictionaries as complements to molecular characteristics and expert annotations remain to be explored in this classification system, specifically in the context of LGGs.
In this study, we used a machine learning approach to identified tissue-derived image features of LGGs capable of predicting patient OS. We hypothesized that the orientation of nuclei within a visual field will change depending on the malignant attributes of the tumor and that detection of these regional attributes can be quantified using a bag-of-words (BoWs) image analysis approach. Using these data, we could identify discriminative histology-derived patterns of nuclei associated with OS to be used in the construction of a generalized prognostic model. Further, we compare the efficacy of prognostication using molecular information combined with histological annotations provided by TCGA, the visual dictionary alone and the visual dictionary combined with molecular information. Finally, we aimed to identify molecular correlates of these visual words by correlating their abundance in the images with the corresponding molecular data for these samples.
Methods
It was previously reported that astrocytic tumors [Figure 1] have worse prognosis than other histological subtypes[8,18] such as oligodendroglial tumors (which have a “fried egg” morphology and “chicken-wire” capillary pattern on H and E stained slides [Figure 1]).[14] These findings indicate that image characteristics derived from H and E stained slides (morphology, spatial patterns of cellular organization) could be associated with OS. Thus, we investigated what image features might associate with OS using a machine learning approach. To this end, we developed a methodology for image feature extraction based on a “BoWs” approach[19] to create a regional representation of statistically distinguishable image-derived phenotypes from whole-tissue mounts.
Figure 1.
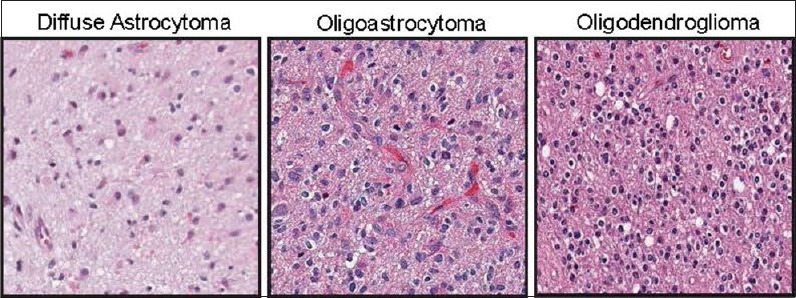
Representative H and E stained sections of the histological subtypes of glioma included in this study. Left, diffuse astrocytoma, characterized by relatively low cell density and highly pleomorphic nuclei. Middle, oligoastrocytoma, characterized by mixed features of astrocytoma and oligodendroglioma. Right, oligodendroglioma, characterized by a distinctive clear protoplasmic area, relatively round bland nuclei, and high cell density
General bag-of-words methodology
The BoWs workflow consists of four steps. These include (1) partitioning an image into smaller image patches and extracting statistical features for each patch; (2) inferring a visual dictionary (codebook) for representation, using a clustering approach, such as K-means clustering, over the statistical features of the image patches; (3) performing frequency analysis on the dictionary for each tissue, i.e., how often each machine learned phenotype is encountered; and (4) correlating dictionary-derived histograms with clinical outcomes, such as LGG with short OS and LGG with long OS. This approach has previously been applied successfully to various biomedical imaging questions; for example, in histology, it has been used to identify representative regions of larger tissues, automatically classify fundamental tissue lineages, and detect pathological malignancies in basal cell carcinoma.[20,21,22,23] In the context of tumors of the central nervous system, similar BoW-based approaches have been applied to discriminate medulloblastomas from normal tissue.[24] Others have shown that classification of distinct histological features, such as necrosis, could be robustly identified in glioblastoma multiforme (GBM) using sparse learning and that these features could be linked to disease outcome.[25] Other machine learning approaches which use image partitioning in combination with morphometric features of nuclei, but do not rely on the BoWs paradigm, have also been applied to grading gliomas.[26]
The BoWs paradigm is commonly used in computer vision to obtain visual dictionaries that can be used to identify discriminant visual words for global classification of the source image. Such dictionaries are typically obtained by clustering similar images together using algorithms such as K-means.[20] Each cluster centroid represents an image subregion with distinct image features and is denoted a “visual word.” All the images can be described as histograms over such derived “visual words,” yielding a “BoWs” representation for the image. Detailed descriptions of this approach can be found elsewhere.[19,27] To train a robust BoWs model, a representative sampling of different tissue patterns must be obtained. In this study, we used histological sections from the TCGA-LGG cohort, which includes Grade II–III tumors, as an input. Nuclei are then segmented, and the image is partitioned into smaller image patches. From these patches, image features (measurements of spatial cell organization) are extracted. Multiple feature spaces have been proposed to be used in BoW analysis, many of which are based on extraction of raw pixel-based texture descriptors, referred to as texton-based approaches.[24,28,29] However, in the context of this disease, the morphometric and contextual properties of nuclei have been associated with malignancy status. To capture this information, derivations of Zernike moments were calculated from binary nuclear masks, creating a computationally efficient feature set which simultaneously captures morphometric and contextual features of the tissue through quantifying spatial patterns.[30] The resulting feature vectors from all the patches are then clustered using the K-means algorithm. Following this step, a frequency histogram representation of each image in terms of the derived clusters is obtained. The histogram features for each tumor specimen are correlated to a response variable. Finally, the companion molecular data from the TCGA are used to map molecular pathway activity to the identified visual words.
Details of bag-of-words methodology for this study
We performed analysis of lower grade gliomas in the TCGA archive consisting of Grade II–III tumors, following TCGA notation/terminology.[31,32] The patient cohort used in this study was selected on the basis of available OS information in addition to companion histological sections. The cohort was then divided into terciles based on OS. Histological sections from the top (long OS) and bottom (short OS) terciles were then downloaded from the TCGA ftp site (https://www.tcga-data.nci.nih.gov/tcgafiles/ftp_auth/distro_ftpusers/anonymous/tumor/lgg/) and subjected to subsequent analysis. There were 27 patients in the short OS group and 26 in the long OS group. Patient demographics for these groups are summarized in Table 1. The median OS was 15 months in the short OS group, compared to 83.65 months in the long OS group. Further, many of the characteristics in the short OS group mirrored the clinical characteristics of poor prognosis LGGs reported in other studies[8,18,33] (mean age >40 years, predominantly astrocytic histology, and Karnofsky performance status (KPS) of ~80) suggesting suitability of this cohort as a representative dataset for analysis of disease outcome.
Table 1.
Patient demographic and clinical characteristics
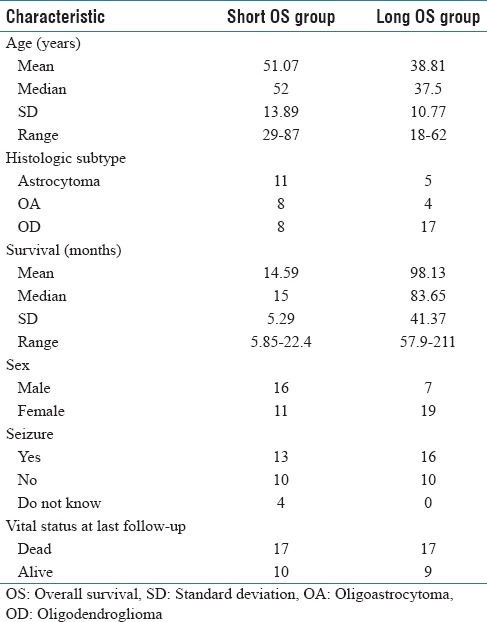
Image preprocessing
Histological sections from TCGA were downloaded in SVS format. These files were scaled to 1 pixel/µm, approximately equal to a standard ×10 objective, and entire sections were saved as png files using Fiji.[34,35,36] Histological sections were analyzed using a custom algorithm developed using Pipeline Pilot 9.2 (Biovia, San Diego), illustrated in Figure 2. In this workflow, H and E components were separated using the color separation component in Pipeline Pilot. Next, a background correction (rolling ball and percentile filtering) was performed on the hematoxylin component image, followed by recontrasting of the image. Nuclear segmentation was performed on the corrected hematoxylin image using an edge touching algorithm to create a preliminary nuclear mask. This mask was further refined using binary operators, including opening, closing, and Gaussian smoothing. The quality of nuclear segmentation was visually evaluated on a panel of representative tissue sections with color-overlaid nuclear masks [Supplementary Figure 1 (162.2KB, tif) ]. The image was then tiled into 256 × 256 pixel patches with a 50-pixel overlap, and statistical image features were extracted. Next, the eosin component image was thresholded using a global value. The area of the thresholded object was then used to calculate a tile-based tissue area fraction, computed as the ratio of the masked eosin area to the total area of the tile. This feature was used to remove artifacts and define tissue areas for downstream image analysis (i.e., restrict image analysis to tiles with at least 50% of the area occupied by tissue).
Figure 2.
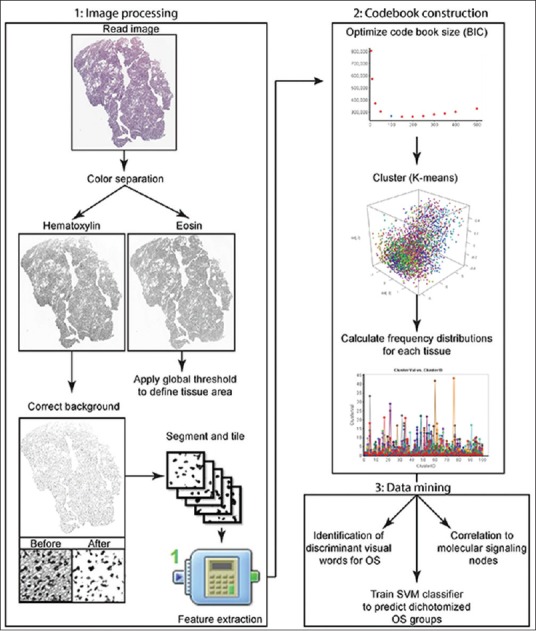
Schematic of the analytical workflow. The overall workflow used in this study is broken into three major parts: image processing utilized to extract statistical features, construction of a bag-of-words model, and data mining. BIC: Bayesian information criterion, OS: Overall survival, SVM: Support vector machine, OD: Oligodendroglioma
Visualization of nuclear segmentation quality. A randomized panel of histological patches with color-coded nuclear overlay masks. Gray regions represent negative space
Feature extraction
From each image tile, the nuclear mask was used to obtain spatial, central, and normalized central moments in addition to calculation of statistical features of 3 × 3 intensity co-occurrence. The rationale for using this feature set is outlined below.
Image moments are a well-established tool in machine vision for pattern recognition tasks.[37] The most basic image moments are spatial or geometric moments. When applied to binary masks, these quantify a blob's area, center of gravity, and relative orientation. Central moments can then be derived by reducing the spatial moments around the center of gravity, making them translationally invariant. However, both spatial and central moments are dependent on the scale of the binary object. To compensate for this, further normalization can be done by correcting for the blob's area, these are known as normalized moments.[38] For the purpose of our work, all image moments were calculated using the region intensity statistics component in Pipeline Pilot. In addition to utilizing image moments, we obtained statistical parameters (energy, contrast, correlation, homogeneity, and entropy) of a co-occurrence matrix from the binary image. When these parameters are derived from a binary image, information regarding the transitional regions (edges) and object connectivity are obtained.[39]
Visual dictionary creation
The next step in the BoWs workflow is the creation of a visual dictionary. This was done by first removing artifacts (glass and tissue folds) based on the tissue area fraction (defined above). The visual dictionary was obtained through K-means clustering performed on the feature vectors for each image tile, pooled from all the images across the patients. The optimal size of the dictionary was obtained using the Bayesian information criterion (BIC). For this image dataset, the optimal number of clusters was 100 [Figure 3a]. A visual dictionary was then obtained by identifying the image patch (tile) nearest to the corresponding cluster centroid [Figure 3b]. A histogram representation for each tissue was then constructed in terms of the obtained clusters (visual words from K-means clustering), resulting in a “BoWs” representation for that image.
Figure 3.
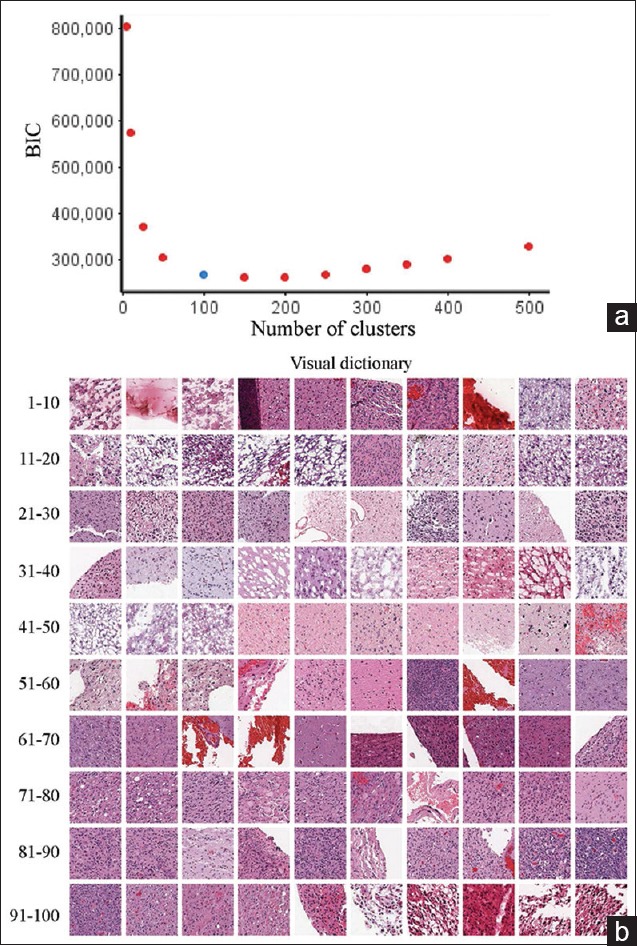
Visual dictionary optimization and visualization. (a) To determine the optimal size of the dictionary, the Bayesian information criterion was calculated from a putative range of potential numbers of clusters and plotted. The knee point is at approximately 100 clusters; therefore, this was the dictionary size used in the subsequent analysis. (b) The visual dictionary was then compiled by selecting tiles that had the nearest Euclidean distance to the centroid of each cluster. Tiles are shown in cluster order (1–10, 11–20, etc.)
Statistical analysis
To identify visual words associated with OS, multivariate Cox regression analysis was performed after adjustment for clinical variables known to be associated with malignant transformation-free survival[8] such as: age at disease onset; KPS, which is a standardized metric used to rate the level of impairment due to the disease; site of primary tumor resection or biopsy; and IDH mutation status. This approach identified visual words whose proportions are significantly associated with OS even after adjustment for these clinical factors. To further validate the combined utility of the identified visual words, another Cox regression was performed using the above-mentioned clinical attributes, and the decision value obtained from a support vector machine (SVM) model based on the visual words.
To determine the molecular correlates of the derived visual words, a Spearman rank correlation was used. BoWs – derived cluster proportions values were correlated with molecular pathway activity scores based on PARADIGM,[40] from the portal.[41] (https://www.confluence.broadinstitute.org/display/GDAC/Home). PARADIGM scores summarize pathway activity based on a combination of mutation and expression values for each gene in the pathway. P-values were then adjusted for multiple testing using the false discovery rate method resulting in a q-value.[42] A final list of significant correlations was obtained by retaining those correlations with a q < 0.05. To make this information more accessible, a representative tag cloud was constructed for each visual word. Here, the size of the pathway term represents the weighted prevalence of that pathway's components (with weights determined using the reciprocal of the q-value).
We also sought to determine if the clustering derived visual words were capable of discriminating histological categories. As previously mentioned, each histological section within the LGG cohort of TCGA was annotated for its histological category (astrocytoma, OD, or oligoastrocytoma). To determine if the visual word proportion was significantly different between histological subtypes, we used a one-factor analysis of variance.
Results
Identification of visual words correlated with overall survival
On Cox regression analysis, 14 of the 100 visual words were associated with OS after adjustment for clinical covariates [Table 2]. Likewise, the integrated predictive score from the 14 significant visual words that resulted from the SVM classifier was highly associated with OS (p < 0.0001) in addition to age and KPS, which were also significant at the p = 0.05 level.
Table 2.
Visual words significantly correlated with overall survival on Cox regression after adjustment for clinical factors known to be associated with malignant transformation-free survival
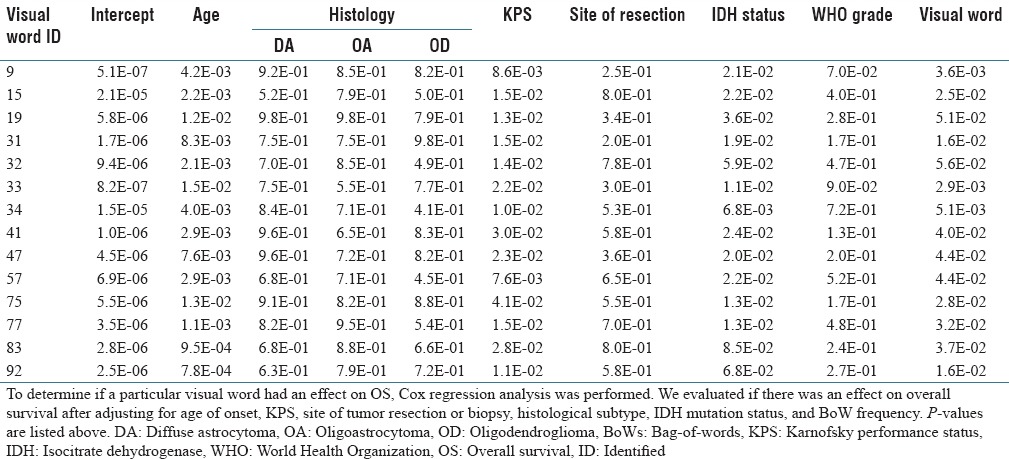
The 14 identified visual words represented diverse patterns of cellular organization, including vascularization, hypercellularity, cellular clustering, and spindle cell morphologies. In addition, other histological features such as regions with a high density of thin vasculature and calcifications are also detected. Some of these histological features were also encoded for by multiple visual words, which suggest the importance of these histological features associated with OS, and possibly, time-to-MT. Indeed, three of the 14 visual words identified were enriched for image patches containing elevated numbers of thin blood vessels. Interestingly, the analytical approach that we used considers only the arrangement of nuclei, suggesting that the microcosm around densely vascularized regions has predictive potential for OS. Indeed, it has been previously been reported that glioma cells collect around blood vessels at infiltrative margins of the tumor.[43] Consistently, we observed that visual words representing these dense-vascularized margins were enriched in patients with relatively shorter OS [Supplementary Figure 2 (254.3KB, tif) ].
Box plots of bag-of-words histogram values versus dichotomized overall survival. The box extremes represent the 25th and 75th percentiles; the median is denoted by the line in the middle. The dot represents the mean, and whiskers were calculated using the Tukey method. Graphs were made using Pipeline Pilot
Identification of visual words correlated with histological subtype
Given that histological subtype is associated with OS, we wished to identify visual words that discriminate between histological subtypes. We identified 11 such visual words using the previously described method. To visually assess these observations, box plots of the BoWs frequency for each patient were plotted by histological subtype [Supplementary Figure 3 (122KB, tif) ]. Interestingly, there was no overlap between the visual words significantly associated with histological subtype and those significantly associated with OS.
Box plots of bag-of-word histogram values versus histological subtype. The box extremes represent the 25th and 75th percentiles; the median is denoted by the line in the middle. The dot represents the mean, and whiskers were calculated using the Tukey method. Graphs were made using Pipeline Pilot
Visual words significantly associated with overall survival also predict dichotomized overall survival
Once visual words significantly associated with OS were identified, we wanted to determine if the combination of these visual words could be used to create a generalized model capable of discriminating 24-month OS. This would not only serve as a validation of the identified visual correlates but also provide a pathway toward a clinically relevant, predictive prognostic tool. A SVM was used to model 24-month OS as a function of the visual words. To evaluate the generalizability of this model, a 10-fold cross-validation was performed, and a receiver operator characteristic curve was constructed from these results [Figure 4a].
Figure 4.
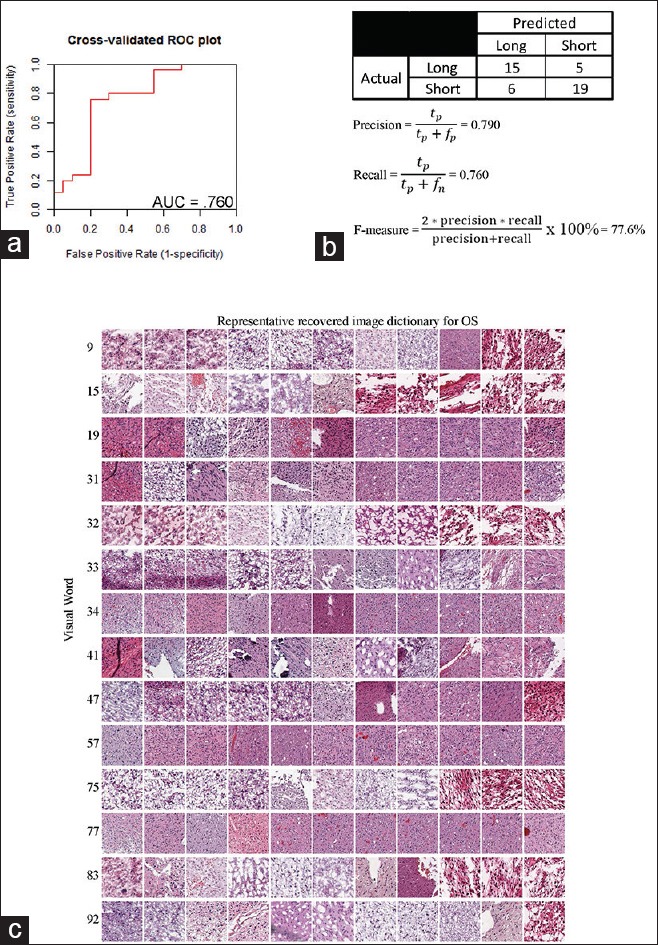
Validation of parameters of the constructed support vector machine model. To determine the generalizability of the trained support vector machine model, 10-fold cross-validation was used. (a) These data were subsequently used to create a receiver operating characteristic plot. (b) From this, a confusion matrix and accompanying statistical parameters were also derived. (c) A visual dictionary of representative recovered tiles for the 14 significant visual words was also constructed by taking a sampling of the tiles nearest to the centroid of the visual word
This method was used to identify tissue-derived image features capable of discriminating the short and long OS groups (dichotomized at the 24-month point) in the LGG cohort. The recovered image-derived dictionary is presented in Figure 4c. The SVM classifier area under the curve (AUC) was 0.76. A confusion matrix was derived from the point on the receiver operating characteristic curve with optimal model predictive values [Figure 4b]. We also calculated an F-score, which is a commonly used metric of the overall accuracy of a binary model. This metric ranges from 0 to 1, where 0 reflects a very inaccurate classification and 1 reflects a fully accurate model. The F-score for this classifier was 0.78.
We next studied how prognostication performance would be effected by utilizing a combination of genomic and image-derived phenotypic attributes. To do so, we implemented a similar workflow to the one described above where histological classifications provided by the TCGA or the tissue-derived dictionary in addition to clinical factors and IDH status are used as inputs in a SVM model. This resulted in a 10-fold cross-validated AUC of 0.67 for the model based on TCGA histology-annotated and IDH status, an AUC of 0.82 for the machine-learned dictionary with IDH status, and an AUC of 0.89 for the model based on the TCGA annotations, machine learned dictionary, age, tumor location, grade, KPS, and IDH status (data not shown). These data demonstrate the feasibility and value of combining machine-learned visual dictionary with established clinical and molecular biomarkers to improve prognostication.
Identifying gene pathways underlying overall survival - associated visual words
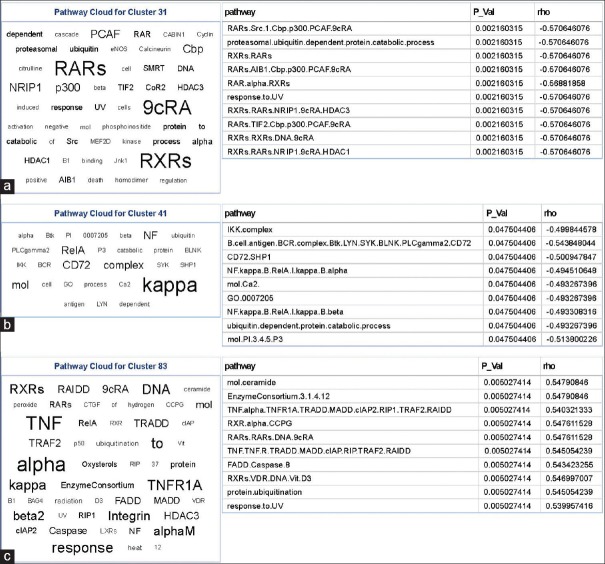
Exploration of machine-learned phenotype-genotype interactions can reveal mechanistically interesting pathways associated with grade or disease progression. Indeed, these types of analysis have shown significant associations between the oligodendroglioma component of GBM and PDGFRA amplification.[15] To understand the biological basis of the identified visual words in our system, we studied the relationship between the discriminative visual words (classifier-associated features) and activity of molecular signaling cascades. Using the tag cloud representation for PARADIGM pathway-activity levels significantly associated with visual words, Figure 5, we identified multiple interesting molecular signaling motifs which have previously been associated with OS [Figure 5].
Figure 5.
(a-c) Tag clouds representing key words in signaling pathways correlated to bag-of-words features. Molecular signaling cascades were mapped back to bag-of-words features identified by Cox regression. To simplify the visualization of these data, a tag cloud was constructed. This was done by first weighting the prevalence of each molecular signaling cascade by multiplying it by inverse of the q value from the Spearman rank correlation test. Naturalistic and short words were then filtered out and piped into the “Tag Cloud” component in Pipeline Pilot. The tag cloud is accompanied by the top ten signaling cascades correlating with that visual word
One of the pathways identified through this method was centered around retinoic acid signaling [Figure 5a]. Upregulation of this cascade signals for differentiation and regulation of cellular proliferation and death. Retinoic acid receptor and retinoic acid X receptor signaling were both negatively correlated with their respective visual word which has a lower frequency in patients with shorter OS, i.e., those with more malignant phenotype. This observation is consistent with other studies that have demonstrated this paradoxical upregulation of retinoic acid receptor signaling with higher grade gliomas.[44] While a mechanistic explanation of this observation has yet to be elucidated, it has been proposed that elevated retinoic acid signaling has an alternate function in glioma that may involve providing a prosurvival signal to a population of poorly differentiated cells.[44]
Another cascade identified by this method was centered around IKK: Nuclear factor-κB (NF-κB) signaling [Figure 5b]. When stimulated, this pathway promotes a Pro-oncogenic environment by modulating the expression of a large number of genes involved in: cell survival, differentiation, and proliferation.[45] Likewise, activation of this pathway has been positively associated with the grade of gliomas.[46] Consistent with this observation, we report a negative correlation between this signaling cascade and its respective visual word which is elevated in long OS group, indicated that NF-κB signaling is increased in the short OS group.
Another set signaling of cascades that has an association was ceramide [Figure 5c]. This pathway is a regulator of proliferation, differentiation, and death. It has been shown in human gliomas that this signaling pathway is negatively correlated with grade and patient survival.[47] Consistently, we see that the corresponding visual word to this is also depleted in short OS cases. Other similar cell death pathways, such as Fas-associated death domain-containing Protein (FADD) and caspase-8, were also identified to be significant with this visual word. It was also noted that this visual word also had significant correlations with pathways previously identified, but with a different sign suggesting, these pathways may have a context-dependent role. Collectively, these data provide potentially interesting insights into the molecular correlates of the identified visual words; however, detailed experiments to confirm these associations are required but outside the scope of this paper.
Discussion
In this work, we have provided a method to cluster the patterns of cellular spatial organization in LGGs using the BoWs paradigm. From this representation, we constructed a predictive model to prognosticate patient OS. The visual words used in the predictive model were visually interpretable and showed disease-relevant phenotypes. This analysis provides rationale for the use of phenotypic information retrieved from histological tissue to supplement histology grade information. In addition, these data can also be integrated with molecular information to provide a stronger prognostic model.
While the data presented above are promising that the current implementation offers sufficient scope for further investigation, specifically the availability of a larger training set with an independent validation set would strongly enable establishing the robustness of these conclusions. While this is currently limiting, an estimate of the model's generalizability is obtained through cross-validation. We also observe that the current workflow suggests some limitations. One limitation is that it is dependent on the quality of nuclear segmentation used to infer spatial patterns of nuclei. Likewise, the ease of segmentation is a function of color (spectral) separation, which can vary with the quality of staining. To overcome this limitation, we manually reviewed the training data to partially standardize the quality of the dataset and remove samples that contained high amounts of staining or mounting artifacts. We also applied a background correction on the hematoxylin component, which increased the contrast between the nuclei to the background and provided better edges used during segmentation. This is one method that can be used to increase the robustness of segmentation; there are also multiple other approaches that can be used to achieve a similar goal. These include utilization of image normalization specifically applied to H and E stained sections as described by Macenko et al.[32] A detailed comparison of how these methods increase the precision of segmentation across different staining conditions compared to expert human segmentation in the context of this question is a subject of future study. Similarly, the effects of staining, scanning and acquisition protocols, image magnification, and tile size need to be examined more systematically in the context of the question.
The pipeline presented here is one possible paradigm to derive visually relevant information in H and E stained tissue and integrate it with molecular and clinical information. However, it is also important to think of how such techniques can be practically implemented in a clinical setting. The most apparent hurdle to this is the requirement of powerful computers which can run the computationally complex tasks required both in feature extraction and data mining steps. The availability of large-scale cloud-based storage and analytic infrastructure (TCGA, Genomic Data Commons, The Cancer Digital Slide Archive[48] [http://cancer.digitalslidearchive.net/], etc.,) might provide a possible solution to overcome these resource challenges. Such infrastructure contains standardized software and accompanying analytical pipelines in addition to having the computational power to perform the subsequent analysis at scale.
Conclusion
In this paper, we have described the construction, visualization, and interpretation of a machine-learned model that uses the bag-of-visual-words paradigm to stratify TCGA-LGG patient into short and long OS groups. This approach was able to discriminate OS (dichotomized at 24 months) with a predictive AUC of 0.76 using the machine learned dictionary alone, 0.82 when supplemented with molecular biomarkers, and 0.89 when further supplemented with other clinical factors. Further correlative analysis of the BoWs image representation resulted in identification of molecular signaling motifs that have previously been associated with patient OS and malignancy. Collectively, these data show the utility of an imaging genomic association approach to map phenotypes from histological sections to answer clinically relevant questions and stratify patients based on OS. These matched datasets also provide a method to study the biological underpinnings of the machine-learned visual words by mapping molecular signaling activity to them. This provides a potential route to discover signaling nodes underlying malignancy-associated phenotypic measurements.
Financial support and sponsorship
This work was supported by CCSG Bioinformatics Shared Resource NCI P30 CA016672, Institutional Research Grant, MDACC Brain Tumor SPORE Career Development Award (5P50CA127001-07), and institutional startup funds (to AR), CPRIT (RP110532) and the American Cancer Society (RSG-16-005-01).
Conflicts of interest
There are no conflicts of interest.
Acknowledgment
We would like to acknowledge the MD Anderson Department of Scientific Publications for assistance with manuscript preparation.
Footnotes
Available FREE in open access from: http://www.jpathinformatics.org/text.asp?2017/8/1/9/201916
References
- 1.Louis DN, Ohgaki H, Wiestler OD, Cavenee WK, Burger PC, Jouvet A, et al. The 2007 WHO classification of tumours of the central nervous system. Acta Neuropathol. 2007;114:97–109. doi: 10.1007/s00401-007-0243-4. [DOI] [PMC free article] [PubMed] [Google Scholar]
- 2.Duffau H. A new philosophy in surgery for diffuse low-grade glioma (DLGG): Oncological and functional outcomes. Neurochirurgie. 2013;59:2–8. doi: 10.1016/j.neuchi.2012.11.001. [DOI] [PubMed] [Google Scholar]
- 3.Whittle IR. The dilemma of low grade glioma. J Neurol Neurosurg Psychiatry. 2004;75(Suppl 2):ii31–6. doi: 10.1136/jnnp.2004.040501. [DOI] [PMC free article] [PubMed] [Google Scholar]
- 4.Duffau H, Taillandier L. New concepts in the management of diffuse low-grade glioma: Proposal of a multistage and individualized therapeutic approach. Neuro Oncol. 2015;17:332–42. doi: 10.1093/neuonc/nou153. [DOI] [PMC free article] [PubMed] [Google Scholar]
- 5.Zadeh G, Khan OH, Vogelbaum M, Schiff D. Much debated controversies of diffuse low-grade gliomas. Neuro Oncol. 2015;17:323–6. doi: 10.1093/neuonc/nou368. [DOI] [PMC free article] [PubMed] [Google Scholar]
- 6.Chaichana KL, McGirt MJ, Laterra J, Olivi A, Quiñones-Hinojosa A. Recurrence and malignant degeneration after resection of adult hemispheric low-grade gliomas: Clinical article. J Neurosurg. 2010;112:10–7. doi: 10.3171/2008.10.JNS08608. [DOI] [PubMed] [Google Scholar]
- 7.Keles GE, Lamborn KR, Berger MS. Low-grade hemispheric gliomas in adults: A critical review of extent of resection as a factor influencing outcome. J Neurosurg. 2001;95:735–45. doi: 10.3171/jns.2001.95.5.0735. [DOI] [PubMed] [Google Scholar]
- 8.Leu S, von Felten S, Frank S, Vassella E, Vajtai I, Taylor E, et al. IDH/MGMT-driven molecular classification of low-grade glioma is a strong predictor for long-term survival. Neuro Oncol. 2013;15:469–79. doi: 10.1093/neuonc/nos317. [DOI] [PMC free article] [PubMed] [Google Scholar]
- 9.Duffau H, editor. Diffuse Low-grade Gliomas in Adults: Natural History, Interaction with the Brain, and New Individualized Therapeutic Strategies. London: Springer Science+Business Media; 2013. [Google Scholar]
- 10.Pignatti F, van den Bent M, Curran D, Debruyne C, Sylvester R, Therasse P, et al. Prognostic factors for survival in adult patients with cerebral low-grade glioma. J Clin Oncol. 2002;20:2076–84. doi: 10.1200/JCO.2002.08.121. [DOI] [PubMed] [Google Scholar]
- 11.Eckel-Passow JE, Lachance DH, Molinaro AM, Walsh KM, Decker PA, Sicotte H, et al. Glioma groups based on 1p/19q, IDH, and TERT promoter mutations in tumors. N Engl J Med. 2015;372:2499–508. doi: 10.1056/NEJMoa1407279. [DOI] [PMC free article] [PubMed] [Google Scholar]
- 12.Cancer Genome Atlas Research Network. Brat DJ, Verhaak RG, Aldape KD, Yung WK, Salama SR, et al. Comprehensive, integrative genomic analysis of diffuse lower-grade gliomas. N Engl J Med. 2015;372:2481–98. doi: 10.1056/NEJMoa1402121. [DOI] [PMC free article] [PubMed] [Google Scholar]
- 13.Gorovets D, Kannan K, Shen R, Kastenhuber ER, Islamdoust N, Campos C, et al. IDH mutation and neuroglial developmental features define clinically distinct subclasses of lower grade diffuse astrocytic glioma. Clin Cancer Res. 2012;18:2490–501. doi: 10.1158/1078-0432.CCR-11-2977. [DOI] [PubMed] [Google Scholar]
- 14.Gupta M, Djalilvand A, Brat DJ. Clarifying the diffuse gliomas: An update on the morphologic features and markers that discriminate oligodendroglioma from astrocytoma. Am J Clin Pathol. 2005;124:755–68. doi: 10.1309/6JNX-4PA6-0TQ5-U5VG. [DOI] [PubMed] [Google Scholar]
- 15.Kong J, Cooper LA, Wang F, Gao J, Teodoro G, Scarpace L, et al. Machine-based morphologic analysis of glioblastoma using whole-slide pathology images uncovers clinically relevant molecular correlates. PLoS One. 2013;8:e81049. doi: 10.1371/journal.pone.0081049. [DOI] [PMC free article] [PubMed] [Google Scholar]
- 16.Surowka AD, Adamek D, Radwanska E, Lankosz M, Szczerbowska-Boruchowska M. A methodological approach to the characterization of brain gliomas, by means of semi-automatic morphometric analysis. Image Anal Stereol. 2014;33:18. [Google Scholar]
- 17.Louis DN, Perry A, Reifenberger G, von Deimling A, Figarella-Branger D, Cavenee WK, et al. The 2016 World Health Organization classification of tumors of the central nervous system: A summary. Acta Neuropathol. 2016;131:803–20. doi: 10.1007/s00401-016-1545-1. [DOI] [PubMed] [Google Scholar]
- 18.Jaeckle KA, Decker PA, Ballman KV, Flynn PJ, Giannini C, Scheithauer BW, et al. Transformation of low grade glioma and correlation with outcome: An NCCTG database analysis. J Neurooncol. 2011;104:253–9. doi: 10.1007/s11060-010-0476-2. [DOI] [PMC free article] [PubMed] [Google Scholar]
- 19.Gang W, Ye Z, Li FF. Using dependent regions for object categorization in a generative framework. IEEE Computer Society Conference on Computer Vision and Pattern Recognition. 2006;2:1597–604. [Google Scholar]
- 20.Cruz-Roa A, Caicedo JC, González FA. Visual pattern mining in histology image collections using bag of features. Artif Intell Med. 2011;52:91–106. doi: 10.1016/j.artmed.2011.04.010. [DOI] [PubMed] [Google Scholar]
- 21.Arevalo J, Cruz-Roa A, Arias V, Romero E, González FA. An unsupervised feature learning framework for basal cell carcinoma image analysis. Artif Intell Med. 2015;64:131–45. doi: 10.1016/j.artmed.2015.04.004. [DOI] [PubMed] [Google Scholar]
- 22.Cruz-Roa A, Díaz G, Romero E, González FA. Automatic annotation of histopathological images using a latent topic model based on non-negative matrix factorization. J Pathol Inform. 2011;2:S4. doi: 10.4103/2153-3539.92031. [DOI] [PMC free article] [PubMed] [Google Scholar]
- 23.Caicedo JC, Cruz A, Gonzalez FA. Histopathology image classification using bag of features and kernel functions. Conference on Artificial Intelligence in Medicine in Europe; 18 July, 2009. Berlin Heidelberg: Springer; 2009. [Google Scholar]
- 24.Galaro J, Judkins AR, Ellison D, Baccon J, Madabhushi A. An integrated texton and bag of words classifier for identifying anaplastic medulloblastomas. Conf Proc IEEE Eng Med Biol Soc. 2011;2011:3443–6. doi: 10.1109/IEMBS.2011.6090931. [DOI] [PubMed] [Google Scholar]
- 25.Nayak N, Chang H, Borowsky A, Spellman P, Parvin B. Classification of tumor histopathology via sparse feature learning. Proc IEEE Int Symp Biomed Imaging. 2013;2013:410–3. doi: 10.1109/ISBI.2013.6556499. [DOI] [PMC free article] [PubMed] [Google Scholar]
- 26.Ertosun MG, Rubin DL. Automated Grading of gliomas using deep learning in digital pathology images: A modular approach with ensemble of convolutional neural networks. AMIA Annu Symp Proc. 2015;2015:1899–908. [PMC free article] [PubMed] [Google Scholar]
- 27.Tsai CF. Bag-of-words representation in image annotation: A review. ISRN Artif Intell 2012. 2012:19. [Google Scholar]
- 28.Khurd P, Bahlmann C, Maday P, Kamen A, Gibbs-Strauss S, Genega EM, et al. Computer-aided gleason grading of prostate cancer histopathological images using texton forests. Proc IEEE Int Symp Biomed Imaging 2010. 2010:14–7. doi: 10.1109/ISBI.2010.5490096. [DOI] [PMC free article] [PubMed] [Google Scholar]
- 29.Kong J, Cooper L, Sharma A, Kurc T, Brat DJ, Saltz JH. Texture based image recognition in microscopy images of diffuse gliomas with multi-class gentle boosting mechanism. IEEE Int Conf Acoust Speech Signal Process. 2010:457–60. [Google Scholar]
- 30.Papakostas G, Boutalis Y, Karras D, Mertzios B. Efficient computation of Zernike and Pseudo-Zernike moments for pattern classification applications. Pattern Recognit Image Anal. 2010;20:56–64. [Google Scholar]
- 31.Ceccarelli M, Barthel FP, Malta TM, Sabedot TS, Salama SR, Murray BA, et al. Molecular profiling reveals biologically discrete subsets and pathways of progression in diffuse glioma. Cell. 2016;164:550–63. doi: 10.1016/j.cell.2015.12.028. [DOI] [PMC free article] [PubMed] [Google Scholar]
- 32.The Cancer Genome Atlas Research Network. Comprehensive, integrative genomic analysis of diffuse lower-grade gliomas. N Engl J Med. 2015;2015:2481–98. doi: 10.1056/NEJMoa1402121. [DOI] [PMC free article] [PubMed] [Google Scholar]
- 33.Rotariu D, Gaivas S, Faiyad Z, Haba D, Iliescu B, Poeata I. Malignant transformation of low grade gliomas into glioblastoma a series of 10 cases and review of the literature. Rom Neurosurg. 2010;4:403–12. [Google Scholar]
- 34.Schneider CA, Rasband WS, Eliceiri KW. NIH Image to ImageJ: 25 years of image analysis. Nat Methods. 2012;9:671–5. doi: 10.1038/nmeth.2089. [DOI] [PMC free article] [PubMed] [Google Scholar]
- 35.Schindelin J, Rueden CT, Hiner MC, Eliceiri KW. The ImageJ ecosystem: An open platform for biomedical image analysis. Mol Reprod Dev. 2015;82:518–29. doi: 10.1002/mrd.22489. [DOI] [PMC free article] [PubMed] [Google Scholar]
- 36.Schindelin J, Arganda-Carreras I, Frise E, Kaynig V, Longair M, Pietzsch T, et al. Fiji: An open-source platform for biological-image analysis. Nat Methods. 2012;9:676–82. doi: 10.1038/nmeth.2019. [DOI] [PMC free article] [PubMed] [Google Scholar]
- 37.Belkasim SO, Shridhar M, Ahmadi M. Pattern recognition with moment invariants: A comparative study and new results. Pattern Recognit. 1991;24:1117–38. [Google Scholar]
- 38.Teague MR. Image analysis via the general theory of moments*. J Opt Soc Am. 1980;70:920–30. [Google Scholar]
- 39.Chen Z, Karim MA, Hayat MM. Displacement co-occurrence statistics for binary digital images. J. Electron Imaging. 2002;11:127–35. [Google Scholar]
- 40.Mackeh R, Lorin S, Ratier A, Mejdoubi-Charef N, Baillet A, Bruneel A, et al. Reactive oxygen species, AMP-activated protein kinase, and the transcription cofactor p300 regulate a-tubulin acetyltransferase-1 (aTAT-1/MEC-17)-dependent microtubule hyperacetylation during cell stress. J Biol Chem. 2014;289:11816–28. doi: 10.1074/jbc.M113.507400. [DOI] [PMC free article] [PubMed] [Google Scholar]
- 41.Broad Institute TCGA Genome Data Analysis Center. Analysis Overview for Brain Lower Grade Glioma (Primary solid tumor cohort) – 21 August, 2015. Massachusetts: Broad Institute of MIT and Harvard; 2015. [Google Scholar]
- 42.Benjamini Y, Hochberg Y. Controlling the false discovery rate: A practical and powerful approach to multiple testing. J R Stat Soc Series B (Methodol) 1995;57:289–300. [Google Scholar]
- 43.Farin A, Suzuki SO, Weiker M, Goldman JE, Bruce JN, Canoll P. Transplanted glioma cells migrate and proliferate on host brain vasculature: A dynamic analysis. Glia. 2006;53:799–808. doi: 10.1002/glia.20334. [DOI] [PubMed] [Google Scholar]
- 44.Campos B, Centner FS, Bermejo JL, Ali R, Dorsch K, Wan F, et al. Aberrant expression of retinoic acid signaling molecules influences patient survival in astrocytic gliomas. Am J Pathol. 2011;178:1953–64. doi: 10.1016/j.ajpath.2011.01.051. [DOI] [PMC free article] [PubMed] [Google Scholar]
- 45.Hayden MS, Ghosh S. NF-κB, the first quarter-century: Remarkable progress and outstanding questions. Genes Dev. 2012;26:203–34. doi: 10.1101/gad.183434.111. [DOI] [PMC free article] [PubMed] [Google Scholar]
- 46.Wang H, Wang H, Zhang W, Huang HJ, Liao WS, Fuller GN. Analysis of the activation status of Akt, NFkappaB, and Stat3 in human diffuse gliomas. Lab Invest. 2004;84:941–51. doi: 10.1038/labinvest.3700123. [DOI] [PubMed] [Google Scholar]
- 47.Riboni L, Campanella R, Bassi R, Villani R, Gaini SM, Martinelli-Boneschi F, et al. Ceramide levels are inversely associated with malignant progression of human glial tumors. Glia. 2002;39:105–13. doi: 10.1002/glia.10087. [DOI] [PubMed] [Google Scholar]
- 48.Gutman DA, Cobb J, Somanna D, Park Y, Wang F, Kurc T, et al. Cancer Digital Slide Archive: an informatics resource to support integrated in silico analysis of TCGA pathology data. J Am Med Inform Assoc. 2013;20(6):1091–8. doi: 10.1136/amiajnl-2012-001469. [DOI] [PMC free article] [PubMed] [Google Scholar]
Associated Data
This section collects any data citations, data availability statements, or supplementary materials included in this article.
Supplementary Materials
Visualization of nuclear segmentation quality. A randomized panel of histological patches with color-coded nuclear overlay masks. Gray regions represent negative space
Box plots of bag-of-words histogram values versus dichotomized overall survival. The box extremes represent the 25th and 75th percentiles; the median is denoted by the line in the middle. The dot represents the mean, and whiskers were calculated using the Tukey method. Graphs were made using Pipeline Pilot
Box plots of bag-of-word histogram values versus histological subtype. The box extremes represent the 25th and 75th percentiles; the median is denoted by the line in the middle. The dot represents the mean, and whiskers were calculated using the Tukey method. Graphs were made using Pipeline Pilot


