

Abstract
OBJECTIVES
Pancreatic cancer (PC) is a lethal malignancy that lacks specific diagnostic markers. The present study explores the diagnostic potential of the most differentially overexpressed secretory mucin MUC5AC alone and in combination with CA19-9 using multi-center training and validation sets.
METHODS
The expression of MUC5AC in benign pancreatic pathologies, PC precursor lesions, primary PC tissues and metastatic lesions was evaluated by immunohistochemistry. Circulating MUC5AC levels were measured using sandwich ELISA assay developed in-house, and CA19-9 was measured using radioimmunoassay. A combined training set (n =346) was used to evaluate the diagnostic (n =241) and predictive (n =105, total samples 201 from pre- and post-surgical and chemotherapy set) significance of MUC5AC. Results were further validated with a pre-defined cut-off value using independent sets from the Mayo Clinic (n =94) and the University of Pittsburgh Medical Center (n =321).
RESULTS
Tissue expression analyses indicated the de novo expression of MUC5AC in pancreatic intraepithelial precursor lesions 1A (PanIN1A); the expression was maintained through all stages of progression to invasive adenocarcinoma. The median circulating MUC5AC levels in patients with resectable early-stage PC (EPC) (stage 1/2; 67.2 ng/ml, IQR: 23.9–382.1) and unresectable late-stage PC (LPC) (stage 3/4; 389.7 ng/ml, IQR: 87.7–948.6) were significantly higher compared with (P-value ≤0.0001) benign controls (BC) (7.2 ng/ml, IQR: 0.4–26.5) and (P-value ≤0.0001) chronic pancreatitis (CP) controls (8.4 ng/ml, IQR: 1.5–19.2). In the diagnostic training set (n =241), MUC5AC efficiently differentiated EPC from healthy controls (HC) (83%/80% sensitive (SN)/specific (SP)), BC (67%/87% SN/SP), and CP (83%/77% SN/SP). Independent validation sets from the Mayo Clinic and UPMC confirmed the diagnostic potential of MUC5AC to differentiate EPC from BC (68%/73%; 65%/83%) and CP (68%/79%; 65%/72%). Furthermore, MUC5AC and CA19-9 combination significantly improved (p-value < 0.001) the diagnostic accuracy for differentiating resectable cases from controls.
CONCLUSIONS
MUC5AC is a valuable diagnostic biomarker, either alone or in combination with CA19-9, to differentiate PC from CP and benign controls.
INTRODUCTION
Pancreatic cancer (PC) is the fourth leading cause of cancer-related deaths and is predicted to become the second-leading cause of cancer death by 2030 ref. (1). Poor survival for PC patients stems from late diagnosis, asymptomatic early disease stages, high chemotherapy resistance, and rapid metastatic progression (2). The ability to diagnose PC in asymptomatic patients is expected to allow a greater number of patients to undergo potential curative resection and greatly improve their prognosis.
Identification of effective biomarkers for the early diagnosis of PC is an ongoing endeavor. Although several diagnostic biomarkers for PC have been investigated, the majority of these have yielded suboptimal results (3–5). CA19-9, the only Food and Drug Administration-approved blood based biomarker for follow-up is useful for disease prognosis, but it has limited utility as an early detection marker due to its variable sensitivity (SN, 60–90%), specificity (SP, 68–91%), and positive predictive value (PPV, 0.9–2.4%) (4, 6, 7). Specifically, the diagnostic utility of CA19–9 is sub-optimal mainly due to its elevation under benign conditions such as obstructive jaundice, cirrhosis, cholangitis, and chronic pancreatitis (CP), as well as the inability of 5–10% of the Caucasian population to synthesize this (8–10). Furthermore, only 65% of resectable PC cases have elevated levels of CA19–9 in the blood (11). In light of the sporadic nature of PC and asymptomatic early disease stages, identification of serum markers that can either complement or perform better than CA19–9 is highly desirable.
Iacobuzio-Donahue et al. (12) performed comprehensive comparative genomic analyses of normal pancreas or duodenal mucosal tissue, CP, and PC tissue or pancreatic cancer cell lines. MUC5AC was identified as the most differentially expressed mucin gene in PC tissue compared with benign pancreatic pathologies. MUC5AC is a member of the mucin family, a heterogeneous group of 21 abundant, high molecular weight O-glycoproteins that can be either secreted or membrane bound (2). Due to its secretory nature, the de novo expression, in early pancreatic intraepithelial precursor lesions (PanIN), and the multiplicity of epitopes in its tandem repeat domain, MUC5AC holds promise as a potential diagnostic marker. However, to date, its utility as a serum biomarker for PC remains unexplored.
The present study analyzes the utility of MUC5AC as a biomarker for PC at the tissue level and in blood samples from a large patient cohort. Further, this study determines the ability of MUC5AC to differentiate between resectable PC patients from healthy controls (HC), benign controls (BC), and CP patients. The efficacy of MUC5AC in differentiating resectable (i.e., Stage I–IIB) and unresectable (i.e., Stage III–IV) cases from controls was assessed in a training set and then in independent validation sets.
METHODS
Study population
This study was conducted according to guidelines from the Reporting Recommendations for Tumor Marker Prognostic Studies (REMARK) (13). The study population included four patient sets from the following three centers: Mayo Clinic Jacksonville, Florida (validation set I), the University of Pittsburgh Medical Center (UPMC) (training set, blinded validation set II, both were independent sample sets), and the University of Nebraska Medical Center (UNMC) (MU5AC response to surgery and chemotherapy). The study was approved by the Institutional Review Boards (IRBs) at the Mayo Clinic (IRB number #07–0000099), UPMC (IRB number PRO07030072), and UNMC (IRB number 209–00). Informed written consents were obtained from all patients and controls prior to enrollment in the study. Three gastroenterologists, blinded to the results of the assays, determined the final diagnosis of the patients based on standard clinical practices. Patients with benign pathologies such as duodenal ulcers, choledochocele, common bile duct stones, benign stricture, biliary dilation, or abnormal imaging on computed tomography or magnetic resonance imaging scans of the pancreas were categorized as BC. PC staging was determined surgically, based on operative pathology or biopsy of metastatic disease; CP was defined based on standard clinical practices. Samples prior to surgery were classified as pre-surgery. Specimens obtained following resection of the primary tumors with either pancreaticoduodenectomy, distal pancreatectomy, or total pancreatectomy were considered to be post-surgery samples. Pre-chemotherapy samples included any sample drawn prior to the initiation of systemic chemotherapy. If the patient had ever received chemotherapy for PC, regardless of whether that patient was undergoing chemotherapy at the time of sample collection, then the sample was classified as post-chemotherapy.
For the diagnostic training set, samples collected at UPMC were used; following collection, samples were shipped by overnight mail to the UNMC for processing. After processing, plasma samples were aliquoted and immediately frozen at −70°C. The training set was comprised of 43 CP patients, 35 HC, and 30 BC, as well as 70 EPC/resectable patients (Stage I–II) and 63 LPC/unresectable patients (Stage III–IV) who were recruited at UPMC.
For the unblinded validation set I, all blood samples were prospectively collected and processed at the Mayo Clinic (14). Patients with epigastric pain/discomfort, no history of pancreatic disease, and normal pancreatic tests (endoscopic retrograde cholangiopancreatography, endoscopic ultrasound, computed tomography, or magnetic resonance imaging) were considered as controls. The sample set included 22 controls, 19 patients with CP, and 53 patients with PC; the demographic details for this sample set were published previously (14).
The independent blinded validation set (set II) was comprised of 321 patients (CP, BC, EPC, and LPC), for which serum samples were collected and stored at UPMC. In the validation set II, all samples from UPMC were collected pretreatment (pre-surgery, pre-chemotherapy). Grade, stage, smoking status, alcohol use, and family history of PC were based on the review of hospital records.
To evaluate changes in the levels of MUC5AC in response to surgery/chemotherapy, this study used a predictive sample set from UNMC obtained prior to or following any treatment (either surgery or chemotherapy). Details on the groups of patients are provided in the supplementary section, and patient demographic data are described in Supplementary Table 1.
Immunohistochemistry analyses
Immunohistochemistry analyses were performed on commercial tissue microarray (TMA) (Biomax; Cat # PA2081a, B054) containing pancreatic tissues from 101 patients, representing normal pancreatic tissue, cancer adjacent normal pancreas, CP, hyperplasia of ducts, islet cell tumors, and ductal adenocarcinoma cases. TMA-containing PC-associated PanIN lesions (TMA 375 and 346) were a kind gift from Dr Anirban Maitra at Johns Hopkins University. Immunohistochemistry was performed according to standardized protocol. Briefly, after overnight dewaxing at 58°C, the slides were washed consecutively three times with xylene. Subsequently, the tissue sections were hydrated using a progressively decreasing percentage of alcohol (100, 95, 80, 70, 50, 30, 20, and 0%). Internal peroxidase activity was quenched by incubating slides in 3% hydrogen peroxide diluted in methanol under dark conditions. Antigen retrieval was carried out by heating the slides for 15 min in 10 mM citrate buffer. Once the slides were cooled, the sections were washed with PBS-T (phosphate-buffered saline with 0.1% Tween 20) and antigens were blocked using horse serum (ImmPRESS Universal antibody kit; Vector Laboratories, Burlingame, CA) for 3 h at room temperature. The slides were incubated further with a 1:400 dilutions of anti-MUC5AC antibody (monoclonal antibody CLH2, Abcam, Cambridge, MA). After overnight incubation, the slides were washed four times with PBS-T, followed by incubation with anti-mouse secondary antibody (ImmPRESS Universal antibody kit; Vector Laboratories, Burlingame, CA) for 30 min, and subsequently, the color was developed by adding 3,3′-diaminobenzidine solution (DAB substrate kit; Vector Laboratories, Burlingame, CA). Once reactivity was observed in the form of brown precipitate, the peroxidase reaction was quenched using distilled water, and sections were hematoxylin stained for 1–2 min, followed by dehydration in an increasing percentage of alcohol and consecutively washed three times with xylene. The sections were mounted using a Vecta-mount mounting medium (Vector Laboratories). Each tissue spot was evaluated for the H-score, which is the product of the percentage of cells positive in the area for MUC5AC and intensity of staining (on the scale of 0–3). To assess the presence of tumors, percentage of MUC5AC positive cells and intensity of staining (0–3), the slides were analyzed by Pathologist Dr SL Johansson at UNMC.
MUC5AC ELISA
A highly sensitive, novel sandwich ELISA-assay was developed to detect MUC5AC levels in the serum. Briefly, each well of a 96-well microplate was coated with 100 μl anti-MUC5AC mouse monoclonal antibody (1–13M1) (a generous gift from Dr. Jacques Bara, INSERM U-482, Paris, France), diluted to the working concentration of 10 μg/ml in 0.05M carbonate buffer. Plates were sealed and incubated overnight at room temperature. The following day, the plates were washed twice with phosphate buffered saline and 0.1% Tween-20 (PBS-T) using an automated washer. The antibody-coated plates were blocked with 250 μl of 3% filtered bovine serum albumin (BSA) for 2.5–3 h at 37 °C, followed by three washes with 0.1% PBS using an automated washer and 100 μl of sample or standards (one-time prepared lysate of A549 cells expressing high levels of MUC5AC), appropriately diluted in 1% BSA, were added to each well. All samples were run in duplicate. Plates were sealed, incubated overnight at 4 °C, and then washed four times with 0.1% PBS-T. Then, 100 μl of biotinylated mouse anti-MUC5AC mAb-1 (45M1) (Neo-Markers, Fremont, CA), diluted in 1% BSA, was added to each well, and plates were incubated for 2 h at 37°C. Plates were again washed with 0.1% PBS-T, and then 100 μl of Pierce Streptavidin Poly-HRP (Thermo Scientific), diluted to 0.0002 mg/ml in 1% BSA, was added to each well and incubated for 30 minutes at room temperature in the dark. Compared with the modified ELISA assay, in the routine ELISA-assay, normal streptavidin-HRP at 1:200 dilutions in PBS-T in 1% BSA was used. Following washing, 100 μl of substrate 3,3′,5,5′-Tetramethylbenzidine (TMB) solution was added to each well, and plates were incubated for 20 min at room temperature in the dark. Then, 50 μl of 1 M sulfuric acid was added to each well to quench the reaction; the absorbance at 450 and 650 nm was measured using a microplate reader. The levels of MUC5AC were quantified as nanogram per ml of total protein in the A549 cell line of lung cancer.
CA19–9 radioimmunoassay
The levels of CA19–9 in serum samples were determined by using a solid phase radioimmunoassay (Centocor, Malvern, PA). All samples were analyzed in duplicate according to the manufacturer’s recommendations. The quantity of CA19–9 antigen was expressed in arbitrary units (U/ml), with one unit activity approxi mately equal to 0.8 ng of purified antigenic protein for CA19–9 in a solid phase radioimmunoassay (15).
Statistical analysis
For demographic information, ages were compared using an analysis of variance model. Race and gender distributions were compared between the groups using χ2-tests, with Fisher’s exact tests utilized for small sample sizes. To ensure that the normality assumption was met, MUC5AC levels were compared between groups using t-tests and analysis of variance models on the log scale. The data are presented as median with interquartile range of 25 to 75 (IQR-Q25–Q75). If significant differences were found between the overall P-values from the analysis of variance models, then pairwise comparisons were made that adjusted for multiple comparisons using Tukey’s method; graphs were plotted using MedCalc (version 9.6.2.0) window application (MedCalc Software, Mariakerke, Belgium). The ability of MUC5AC to differentiate PC patients from the control groups (BC and CP patients for the initial study) was determined through analysis of the Area Under the Curve (AUC) using Receiver Operating Characteristic curve analysis. The diagnostic ability of MUC5AC was compared with that of CA19–9 using AUC in the training set. Cutoff points were determined for each marker using optimal SN and SP. Furthermore, the multivariate models were used to compare the differentiating abilities of MUC5AC alone, and in combination with CA19–9. SAS software version 9.3 (SAS Institute Inc., Cary, NC) was used for all data analysis.
Mixed-effects models were used to compare log (MUC5AC) levels between post- and pre-chemotherapy, surgery levels, and diagnosis. The model included fixed effects for pre- and post-chemotherapy and pre- and postsurgery, and a random effect for patients to account for the correlation due to multiple samples per patient. Statistical analysis for the diagnostic performance of MUC5AC, at a predetermined cutoff from the training set, was independently investigated in the blinded validation sets.
RESULTS
De novo expression of MUC5AC in early PC lesions
Genome-wide expression analyses identified MUC5AC as the most differently overexpressed mucin in PC (12). The expression of MUC5AC was examined at the tissue level using commercial TMAs Figure 1). MUC5AC expression was undetectable in the normal pancreas (Figure 1a), CP tissue, and islet cell tumors (Figure 1c). In contrast, tissues with ductal adenocarcinoma showed differential overexpression of MUC5AC, with an average H-score of 1.3±0.15 (Figure 1c). To determine the precursor lesions where de novo expression of MUC5AC becomes first detectable, TMAs containing PC-associated PanINs were stained for MUC5AC. Notably, MUC5AC expression was observed as early as PanIN IA & B (Figure 1a, Supplementary Figure S1A online), while it was found to be undetectable in normal pancreatic ducts, acini, and the islets of Langerhans (Figure 1a). Further, MUC5AC expression was observed in PanIN II, PanIN III lesions and in both well-differentiated and poorly differentiated tumors (Figure 1a, Supplementary Figure S1A online). Interestingly, secretory MUC5AC was found in the lumen of small PanIN ducts, while polymeric gel of MUC5AC was found to be present in the lumen of larger ducts (Figure 1a).
Figure 1.
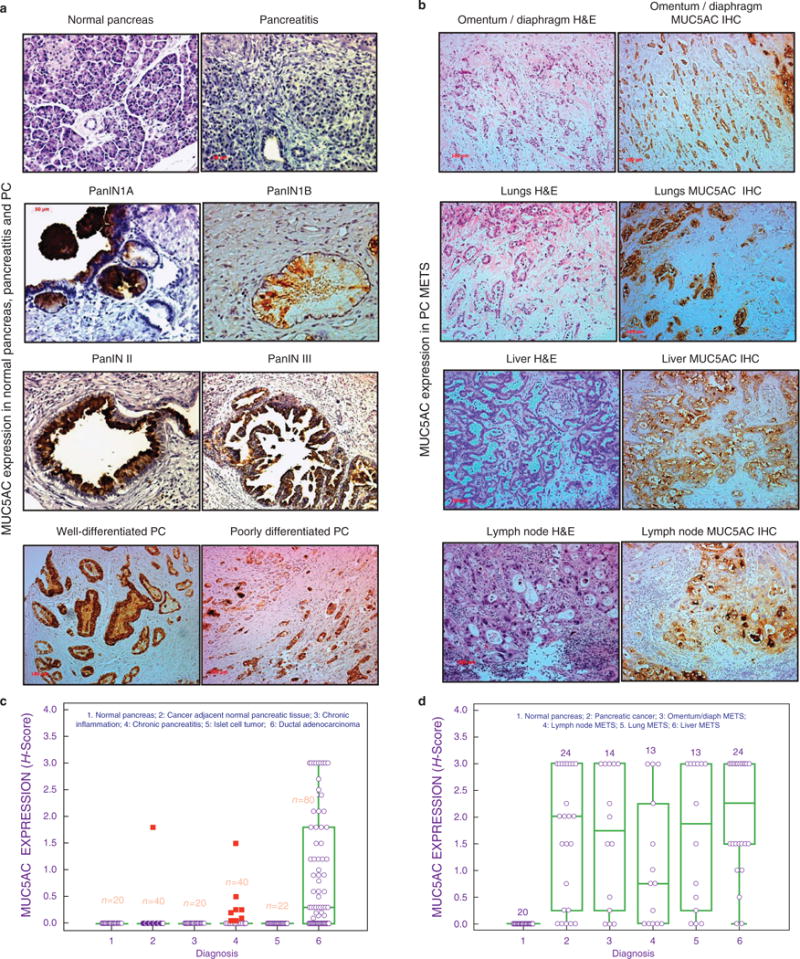
MUC5AC expression in normal pancreas, chronic pancreatitis, PC, and metastatic PC. Tissue microarrays from normal pancreas, pancreas-containing pancreatic intraepithelial precursor lesions (PanINs), chronic pancreatitis, pancreatic adenocarcinoma, and metastatic adenocarcinoma were stained for MUC5AC. (a) MUC5AC expression in the normal pancreas, pancreatitis, PanIN1A, PanIN1B, PanIN II, PanIN III, and well-differentiated and poorly differentiated PC tissues. MUC5AC expression was absent in normal pancreatic tissue with benign pancreatic ducts; aberrant expression was observed in PanINs (PanIN I–III) and PC. (b) MUC5AC expression in metastatic PC specimens from rapid autopsy. Strong expression of MUC5AC were observed in METS from omentum/diaphragm, lungs, liver, and lymph node. Strong expression of MUC5AC were observed in primary tumors as well as METS. In early stages, polymeric gels of MUC5AC could be seen in the ducts. (c) MUC5AC tissue expression box-plot in benign and malignant pathologies of the pancreas. No expression of MUC5AC was observed in the normal pancreas, cancer adjacent normal pancreas, inflamed pancreatic tissue, chronic pancreatitis, and cases of islet cell tumors. Differential expression of MUC5AC was observed in large number of cases of ductal adenocarcinoma. (d) MUC5AC expression box-plot in primary pancreatic tumor and associated METS to liver, lungs, omentum/diaphragm, and lymph nodes. A significant positive correlation was observed between the expressions of MUC5AC in primary tumors and associated MET to multiple organs, while its expression was absent in the normal pancreas.
Expression was further assessed in the samples from advanced stages of PC by staining TMAs, courtesy of the UNMC rapid autopsy program (RAP). MUC5AC expression was observed in 76% (22 out of 29 cases) of primary tumors, while normal pancreases from tumor-adjacent areas were negative (Figure 1d). Furthermore when metastases were taken into account, the overall incidence of MUC5AC positivity increased to 97% (28 out of 29 cases; Figure 1b). The percentage positivity values for metastases of the lungs, omentum/diaphragm, lymph nodes, and liver were 85%, 79%, 69%, and 92%, respectively.
Differential expression of circulating MUC5AC in resectable early-stage PC patients
This study next evaluated diagnostic significance of circulating MUC5AC using the comprehensive sample set comprising of training, and validation sets from various centers (Figure 2a, Supplementary Table S1 online). The modified MUC5AC ELISA was more sensitive than the conventional ELISA, and was highly reproducible with intra- and inter-plate coefficients of variations of 4.7% and 11.4%, respectively (Supplementary Figure S1 online). Median circulating MUC5AC levels were significantly elevated in PC patients (124.1 ng/ml, interquartile range (IQR): 39.1–777.8) as compared with HC (4.9 ng/ml, IQR: 0.6–17.4; <0.0001), BC (7.2 ng/ml, IQR: 0.4–26.5; P <0.0001), and CP (8.4 ng/ml, IQR: 1.5–19.2; P<0.0001) patients (Figure 2b: Table 1). Notably, significant differences in the median and average MUC5AC levels were maintained when the PC sample set was limited to only cases of early-stage, resectable PC (HC, BC, and CP, P <0.0001) (Figure 2b, Table 1). The levels of MUC5AC increased with the stage of PC and in the late stage patients (Stage III and IV), the median level of MUC5AC was found to be higher than Stage IA–IIB patients (P=0.059; Figure 2c).
Figure 2.
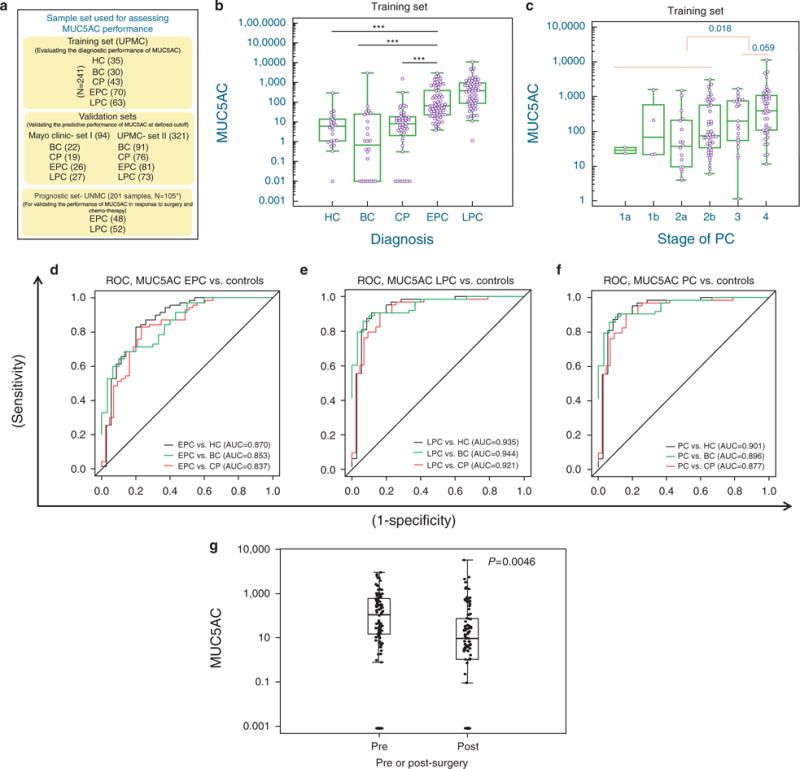
Diagnostic assessment of MUC5AC in chronic pancreatitis, resectable (Early-stage PC) and unresectable pancreatic cancer (Late-stage PC). (a) Schema of various patient cohorts used for evaluating the diagnostic and prognostic performance of MUC5AC. (b) Box-plot for MUC5AC distribution for controls and pancreatic disease groups. Significantly elevated levels of MUC5AC were observed in cases of both EPC and LPC cases compared with controls. (c) Stage-specific distribution of MUC5AC; comparison of ROC curves examining the ability of MUC5AC to differentiate between (d) EPC, (e) LPC, or (f) all PC from healthy controls (HC), benign controls (BC) and chronic pancreatitis (CP). (g) Correlation between levels of MUC5AC and surgery: MUC5AC levels were compared between pre- and post-surgery samples (n =106) using a mixed-effects model. The model included fixed effects for pre-and post-surgery and a random effect for patients to account for the correlation due to multiple samples per patient. Post-surgical levels of MUC5AC were significantly lower than pre-surgical levels. *Stage unknown for some cases. The p-values were determined by the ANOVA t-test. *** P-value ≤0.0001; ** P-value ≤0.001. BC, benign control group; CP, chronic pancreatitis; HC, healthy controls; EPC, early-stage pancreatic cancer (stage 1 and 2); LPC, late-stage pancreatic cancer (stage 3 and 4); PC, pancreatic cancer.
Table 1.
Biomarker concentrations and comparisons in controls, patients with CP, and patients with PC in diagnostic training set
| Variable | Diagnosis | N | Mean±s.e. | Median | Minimum | Q1 | Q3 | Maximum | P-valuea |
|---|---|---|---|---|---|---|---|---|---|
| MUC5AC | HC | 35 | 104.8±86.7 | 4.9 | 0.0 | 0.6 | 17.4 | 3,038.7 | |
| BC | 30 | 19.8±6.5 | 7.2 | 0.0 | 0.4 | 26.5 | 186.0 | ||
| CP | 43 | 62.6±37.9 | 8.4 | 0.0 | 1.5 | 19.2 | 1,611.0 | ||
| PC | 133 | 592.9±107.8 | 124.1 | 1.2 | 39.1 | 777.8 | 11,127.4 | <0.0001b; 0.0001c; <0.0001d | |
| EPC | 70 | 344.9±71.9 | 67.2 | 4.0 | 23.9 | 382.1 | 3,053.4 | <0.0001b; <0.0001c; <0.0001d | |
| LPC | 63 | 868.8±208.7 | 389.7 | 1.2 | 87.7 | 948.6 | 11,127.4 | <0.0001b; <0.0001c; <0.0001d | |
| CA19–9 | HC | 20 | 38.0±5.0 | 39.5 | 0.1 | 21.5 | 55.8 | 77.3 | |
| BC | 26 | 122.6±76.4 | 32.8 | 0.0 | 12.9 | 59.5 | 2,014.2 | ||
| CP | 36 | 89.4±26.3 | 45.6 | 11.2 | 31.5 | 77.5 | 920.2 | ||
| PC | 99 | 1357.5±319.3 | 217.0 | 6.0 | 46.8 | 976.0 | 20,850 | <0.0001b; 0.0001c; <0.0001d | |
| EPC | 48 | 1049.0±388.7 | 89.5 | 6.0 | 28.8 | 403.7 | 14,189 | 0.0024b; 0.0026c; 0.18d | |
| LPC | 51 | 1647.9±500.7 | 525.5 | 13.2 | 113.9 | 1464 | 20,850 | <0.0001b; <0.0001c; <0.0001d |
ANOVA, analysis of variance; BC, controls with benign diseases; CP, chronic pancreatitis; EPC, early-stage pancreatic cancer, resectable; HC, healthy controls, cancer; LPC, late-stage pancreatic cancer, unresectable; PC, pancreatic cancer; Q1, first quartile; Q3, third quartile.
P-values are from ANOVA models conducted on the log scale and adjusted for multiple comparisons with Tukey’s method. As mucins are complex protein and could not be purified to entirety concentration are relative to total cell lysate (ng/ml).
Comparison vs. HC.
Comparison vs. BC.
Comparison vs. CP.
Using Receiver Operating Characteristic curve-based diagnostic analyses (Figure 2d–f), MUC5AC effectively differentiated EPC from all controls (Figure 2d). The SN/SP for differentiating EPC from HC (AUC 0.87; confidence interval (CI): 0.79–0.95 at ≥20.4 ng/ml); BC (AUC 0.85; CI: 0.76–0.93 at ≥33.6 ng/ml) and CP (AUC 0.84; CI: 0.76–0.92 at ≥20.4 ng/ml); were 83%/80%, 67%/87%, and 83%/77%, respectively (Supplementary Table 2). For LPC, an improved SN/SP was observed for differentiating all controls cases with SN/SP of 91%/89% (at ≥35.4 ng/ml), 89%/90% (at ≥41.9 ng/ml), and 91%/84% (at ≥35.4 ng/ml MUC5AC) for HC, BC, and CP, respectively (Figure 2e, Supplementary Table S2 online). Overall, MUC5AC was found to be a specific marker for differentiating healthy and benign control groups from PC patients (Figure 2f). Based on the Receiver Operating Characteristic curve analysis, a cutoff of 20.4 ng/ml was found to optimally differentiate all control groups from EPC (AUC 0.85, SN/SP of 83%/73%); this cutoff value was further used to assess the diagnostic potential of MUC5AC in validation sets. While assessing the correlation between MUC5AC levels and various clinical characteristics, a marginal association was observed for the smoking status and history of alcohol use (data not shown).
To determine whether MUC5AC levels correlate with tumor progression/disease burden, the effects of surgery and chemotherapy on circulating MUC5AC levels were determined. Pre-surgery MUC5AC levels were significantly increased compared with post-surgery levels (P-value=0.0046) (Figure 2g). Further analyses for individual patients indicated a downward trend in MUC5AC levels in response to surgery (Supplementary Figure S2A and S2B online). In addition, pre-chemotherapy levels of MUC5AC were found to be higher compared with post-chemotherapy levels; however, the differences were not significant (Supplementary Figure S3B online). Similar results were obtained for CA19–9 (Supplementary Figure S3C and S3D online).
Analysis of circulating MUC5AC in independent validation sets from different centers
The first independent validation set was comprised of patients who presented with epigastric pain/discomfort and underwent upper-gastrointestinal endoscopy at the Mayo Clinic. In this validation set, the expression of MUC5AC was observed to be significantly up-regulated in PC patients as compared with all controls groups (Supplementary Figure S2B online). The SN/SP of MUC5AC at its defined cutoff (20.4 ng/ml) was 75%/73% for differentiating cases of BC from PC, while it was 75%/79% SN/SP for differentiating cases of CP from PC. Based on the promising results from the initial validation set, the diagnostic potential of MUC5AC was assessed in a larger, blinded validation set from UPMC, where the samples were different from those used in the training set. In these analyses, MUC5AC differentiated PC from BC with a SN/SP of 68%/83% and PC from CP with a SN/SP of 68%/72% (cut-off value of 20.4 ng/ml; Table 2). The diagnostic utility of MUC5AC was further evaluated independently in EPC group. In validation set I, MUC5AC differentiated EPC from BC with the SN/SP of 68%/73% and CP patients from EPC patients with SN/SP of 68%/79% at 20.4 ng/ml cut-off (Table 2). Similarly, in validation set II, MUC5AC differentiated EPC from BC (AUC=0.74; SN/S P =65%/83%) and CP (AUC=0.68; SN/SP=65%/72%) controls (Table 2). Interestingly, the SN/SP of MUC5AC in the validation set increased to 72%/92% when the samples (n =59) had low bilirubin levels (≤1.5) compared with patients (n =47) having high bilirubin levels (>1.5, SN/SP; 67%/80%) (data not shown).
Table 2.
Diagnostic performance of MUC5AC in validation sets
| Sensitivity | Specificity | Total cases | AUCa | PPV | NPV | Accuracy | |
|---|---|---|---|---|---|---|---|
| Validation set I (MUC5AC) | |||||||
| PC vs. BC | 75% (39/52) | 73% (16/22) | 74 | 0.74 | 87% | 55% | 74% |
| PC vs. CP | 75% (39/52) | 79% (15/19) | 71 | 0.77 | 91% | 54% | 76% |
| EPC vs. BC | 68% (17/25) | 73% (16/22) | 47 | 0.70 | 74% | 67% | 70% |
| EPC vs. CP | 68% (17/25) | 79% (15/19) | 44 | 0.74 | 81% | 65% | 73% |
| LPC vs. BC | 81% (22/27) | 73% (16/22) | 49 | 0.77 | 79% | 76% | 78% |
| LPC vs. CP | 81% (22/27) | 79% (15/19) | 46 | 0.80 | 85% | 75% | 80% |
| Blinded validation set II (MUC5AC) | |||||||
| PC vs. BC | 68% (107/157) | 83% (94/113) | 270 | 0.76 | 84% | 65% | 74% |
| PC vs. CP | 68% (107/157) | 72% (36/50) | 207 | 0.70 | 88% | 42% | 69% |
| EPC vs. BC | 65% (53/82) | 83% (94/113) | 195 | 0.74 | 74% | 76% | 75% |
| EPC vs. CP | 65% (53/82) | 72% (36/50) | 132 | 0.68 | 79% | 55% | 67% |
| LPC vs. BC | 73% (53/73) | 83% (94/113) | 186 | 0.78 | 74% | 82% | 79% |
| LPC vs. CP | 73% (53/73) | 72% (36/50) | 123 | 0.72 | 79% | 64% | 72% |
AUC, area under the curve; BC, controls with benign diseases; CP, chronic pancreatitis; EPC, early-stage pancreatic cancer, resectable; LPC, late-stage pancreatic cancer, unresectable; NPV, negative predictive value; PC: pancreatic cancer; PPV, positive predictive value.
AUC corresponds to the c-statistic from logistic models with MUC5AC cutpoint of 20.4.
Improved diagnosis by MUC5AC and CA19–9 combination
Next, this study assessed the diagnostic performance of MUC5AC in combination with CA19–9, the current gold-standard PC biomarker. Similar to MUC5AC, CA19–9 levels were significantly elevated in cases of both EPC and LPC compared with all control groups (P <0.005, Table 1, Supplementary Figure S3A online) with the exception of EPC compared with CP (P–0.18). At its optimal cutoff determined by Receiver Operating Characteristic curve analyses (≥ 68.7 U/ml), CA19–9 differentiated HC, BC, and CP from unresectable LPC with very-high SNs/SPs of 82%/95%, 77%/89%, and 77%/86%, respectively (Supplementary Table S2 online). However, in the EPC group, a marked decrease was observed in the sensitivity (56%, 48%, and 48% for HC, BC and CP respectively), while specificity remained unchanged (Figure 3c, Supplementary Table S2 online).
Figure 3.
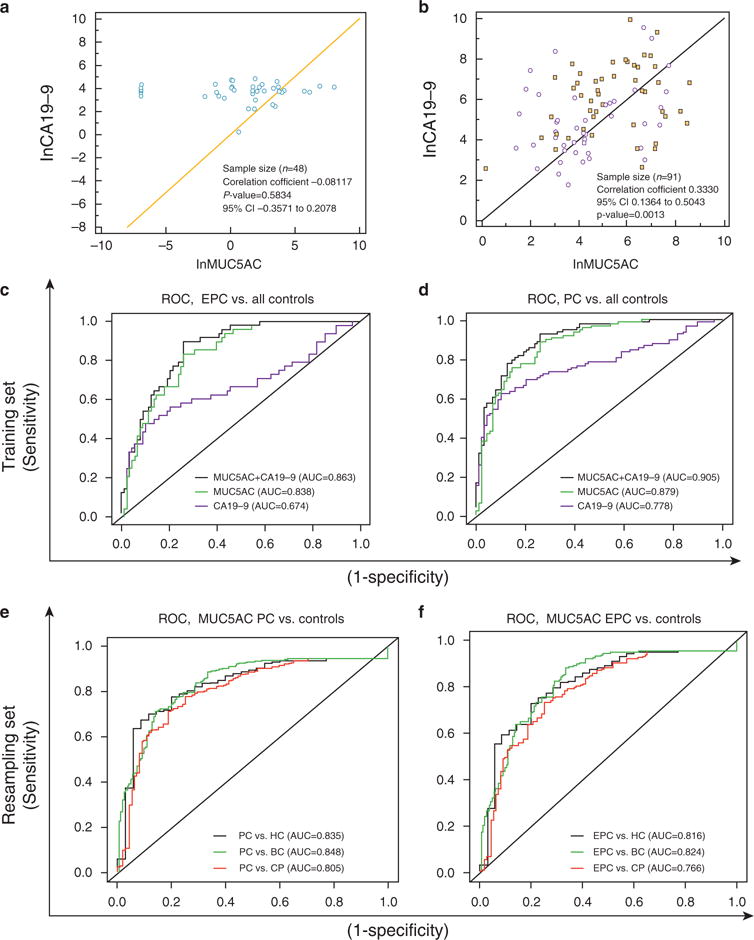
Diagnostic performance of MUC5AC and CA19–9 in combination. (a) Correlations for MUC5AC and CA19–9 in healthy, benign, and chronic pancreatitis (CP) controls. (b) Correlations for MUC5AC and CA19–9 in resectable EPC (dots) and unresectable LPC (squares). (c) Receiver Operating Characteristic (ROC) curves comparing the ability of MUC5AC, CA19–9, and duo combination for differentiating resectable EPC from all controls (i.e., healthy controls, benign, and CP) in the training set. The combined use of MUC5AC with CA19–9 significantly improved the AUC and ability to differentiate various types of controls from resectable EPC controls in comparison to CA19–9 alone. (d) ROC curves comparing the ability of MUC5AC and CA19–9 with differentiate PC from all control (healthy controls, benign, and CP). (e) ROC curves comparing the ability of MUC5AC with differentiate all PC cases (i.e., EPC and LPC) from all controls (i.e., healthy controls, benign, and CP) in the combined sets (training set, validation set I, and validation set II). (f) ROC curves comparing the performance of MUC5AC to differentiate resectable PC from all controls (i.e., healthy controls, benign, and CP) in the combined set (i.e. training set, validation set I, and validation set II; n = 657). The ROC curves in the figures are plotted taking MUC5AC, CA19–9 and combination (MUC5AC + CA19–9) as continuous variable and optimal AUC curve were plotted. Overall, MUC5AC emerged as SN/SP marker for differentiating EPC cases from various types of controls. CP, chronic pancreatitis; HC, healthy controls; EPC, early-stage pancreatic cancer; LPC, late-stage pancreatic cancer; SN, sensitive; SP, specific.
Considering the discriminatory power of both markers, this study next evaluated their performance in combination. First, we investigated the correlation between MUC5AC and CA19–9, both in controls (HC, BC, and CP), and in PC specimens. The levels of circulating MUC5AC and CA19–9 antigens did not correlate with one another in the controls (correlation coefficient r =−0.081, P =0.5834; Figure 3a) but exhibited a mild positive correlation in PC patients (correlation coefficient r =0.33, P =0.0013; Figure 3b).
The study then applied a multivariate analysis in the training set to investigate whether combining MUC5AC with CA19–9 could improve the diagnostic accuracy for differentiating PC cases from controls (BC and CP). The AUC for the combination of MUC5AC with CA19–9 to differentiate PC from benign and CP controls was significantly greater (0.91, 0.86–0.95) compared with the AUC for the CA19–9 model alone (0.61, CI: 0.86–0.95; difference of 0.3 and P-value <0.0001; Table 3). Inclusion of MUC5AC with CA19–9 improved its specificity (from 43 to 83%) and sensitivity (from 79 to 83%) for differentiating PC from all controls (Table 3).
Table 3.
Individual and combined diagnostic performance of MUC5AC, and CA19–9 in training set
| Comparison | Estimated | AUC 95% CI | P-value | P-value | Specificity | Sensitivity | |||
|---|---|---|---|---|---|---|---|---|---|
| Threshold | AUC | s.e. | Lower | Upper | CA19–9 | MUC5AC | |||
| EPC vs. BC | |||||||||
| MUC5AC | ≥20.4 | 0.84 | 0.04 | 0.76 | 0.92 | 0.70 | 0.83 | ||
| CA19–9 | ≥37 | 0.57 | 0.05 | 0.47 | 0.67 | 0.48 | 0.67 | ||
| Multivariate model I (MUC5AC+CA19–9) | See footnote | 0.86 | 0.039 | 0.78 | 0.93 | <0.0001 | 0.098 | 0.72 | 0.85 |
| Multivariate model II [MUC5AC +CA19–9 (>=37)] | 0.85 | 0.04 | 0.77 | 0.93 | <0.0001 | 0.26 | 0.83 | 0.75 | |
| LPC vs. BC | |||||||||
| MUC5AC | ≥20.4 | 0.89 | 0.03 | 0.83 | 0.99 | 0.72 | 0.95 | ||
| CA19–9 | ≥37 | 0.69 | 0.04 | 0.61 | 0.77 | 0.478 | 0.90 | ||
| Multivariate model I | 0.93 | 0.03 | 0.88 | 0.99 | <0.0001 | 0.33 | 0.935 | 0.86 | |
| Multivariate model II | 0.93 | 0.03 | 0.87 | 0.98 | <0.0001 | 0.44 | 0.848 | 0.96 | |
| EPC vs. CP | |||||||||
| MUC5AC | ≥20.4 | 0.84 | 0.05 | 0.74 | 0.93 | 0.72 | 0.83 | ||
| CA19–9 | ≥37 | 0.50 | 0 | — | — | 0.33 | 0.67 | ||
| Multivariate model I | 0.86 | 0.04 | 0.78 | 0.95 | <0.0001 | 0.075 | 0.78 | 0.90 | |
| Multivariate model II | 0.83 | 0.05 | 0.74 | 0.92 | <0.0001 | 0.81 | 0.80 | 0.75 | |
| LPC vs. CP | |||||||||
| MUC5AC | ≥20.4 | 0.92 | 0.03 | 0.86 | 0.98 | 0.77 | 0.95 | ||
| CA19–9 | ≥37 | 0.62 | 0.05 | 0.53 | 0.71 | 0.33 | 0.90 | ||
| Multivariate model I | 0.95 | 0.02 | 0.90 | 0.99 | <0.0001 | 0.079 | 0.89 | 0.84 | |
| Multivariate model II | 0.91 | 0.033 | 0.84 | 0.98 | <0.0001 | 1.0 | 0.83 | 0.88 | |
| MUC5AC and CA19–9 ROC results for pancreatic cancer vs. all controls | |||||||||
| PC vs. all controls | |||||||||
| MUC5AC | ≥20.4 | 0.88 | 0.03 | 0.83 | 0.93 | 0.70 | 0.89 | ||
| CA19–9 (>=37) | ≥37 | 0.61 | 0.03 | 0.54 | 0.68 | 0.43 | 0.79 | ||
| Multivariate model I | 0.91 | 0.02 | 0.86 | 0.95 | <0.0001 | 0.011 | 0.83 | 0.83 | |
| Multivariate model II | 0.88 | 0.03 | 0.83 | 0.93 | <0.0001 | 0.43 | 0.83 | 0.83 | |
| EPC vs. all controls | |||||||||
| MUC5AC | ≥20.4 | 0.84 | 0.03 | 0.77 | 0.90 | 0.74 | 0.83 | ||
| CA19–9 (≥37) | ≥37 | 0.55 | 0.04 | 0.46 | 0.63 | 0.43 | 0.67 | ||
| Multivariate model I | 0.86 | 0.03 | 0.80 | 0.92 | <0.0001 | 0.041 | 0.74 | 0.90 | |
| Multivariate model II | 0.84 | 0.03 | 0.77 | 0.90 | <0.0001 | 0.75 | 0.75 | 0.83 | |
BC, controls with benign diseases; CP, chronic pancreatitis; EPC, early-stage pancreatic cancer, resectable; LPC, late-stage pancreatic cancer, unresectable; PC, pancreatic cancer.
Estimated threshold for MUC5AC+CA19–9 models determined by multivariate model. The difference between multivariate models I and II is that the former used a CA19–9 as continuous variable, whereas the latter used the clinical threshold of 37 U/ml.
Similarly, the performance of CA19–9 for differentiating EPC from BC cases significantly improved in combination with MUC5AC (AUC=0.57–0.86; SN/SP=67%/48% to 75/83%, AUC difference=0.3). Furthermore, to discriminate EPC from CP, the inclusion of MUC5AC improved the SN/SP of CA19–9 (AUC from 0.5 to 0.83; SN/SP from 67%/33% to 75%/80%; AUC difference=0.33; p-value<0.001). The combination also differentiated controls (i.e., BC and CP) from EPC cases (AUC=0.84; CI: 0.77–0.90; SN/SP of 75% and 83%, respectively; Figure 3c, Table 3). Importantly, the combination outperformed both MUC5AC and CA19–9 in differentiating PC cases from various benign and CP cases. In case of MUC5AC, the decrease in sensitivity was lower than the enhancement in the specificity that lead to an overall increase in the AUC from 0.88 to 0.91 suggesting an overall merit in combining the biomarkers (Table 3).
Next, this study evaluated the diagnostic performance of MUC5AC in all three sets (n =656; training set and validation sets I and II; Figure 3e–f). Overall, in all the three sets, MUC5AC was found to be highly sensitive and specific in differentiating EPC from BC and CP cases, with AUCs of 0.82 and 0.77 respectively (Figure 3f and Supplementary Table 2).
DISCUSSION
A minimally invasive, early diagnostic test that has high sensitivity and specificity and is capable of distinguishing PC at resectable stages from benign diseases is highly desirable. Notably, MUC5AC expression is undetectable in the normal pancreas, cancer adjacent normal pancreas, and the chronically inflamed pancreas, but exhibits differential expression in cases of PC, thus suggesting its utility as a diagnostic biomarker. While evaluating the utility of MUC5AC as a biomarker for cholangiocarcinoma, Wongkham et al. (16) observed undetectable levels of MUC5AC in the serum of patients with benign or chronic inflammation of the bile duct, cholecystitis, cholelithiasis, and opisthorchiasis. In contrast, a study by Albert et al. (17) showed the marked elevation of serum CA19–9 in patients with cirrhosis and acute cholangitis. These studies support that MUC5AC is a better marker than CA19–9 for differentiating malignant and benign hepatobiliary, pathologies. Findings from the present study elaborates strong diagnostic and prognostic potential of MUC5AC which exhibited SN/SP of 75%/73% for differentiating controls from PC in validation set 1, at the pre-defined cut-off value of 20.4 ng/ml. These control samples were obtained from patients that presented with epigastric pain/discomfort and were subsequently subjected to endoscopic ultrasound guided-fine needle aspiration for evaluation; their follow-up ascertained that these patients were free of pancreatic disease (14).
Biliary obstruction is one of the major confounding factors for accurate detection of PC. We observed that the SN/SP of MUC5AC increased in samples with low bilirubin levels (≤1.5) compared with those with high bilirubin levels. This suggests that the degree of biliary obstruction possibly affects circulating MUC5AC levels in cancer patients. Similarly, CA19–9 concentrations have been found to be affected by biliary obstruction, where high bilirubin levels affect the performance of CA19–9 as prognostic marker. In addition, a study by Dumitra et al. (18) showed that, in adenocarcinomas at the head of the pancreas, the ratio of CA19–9 to bilirubin provides superior predictive abilities as prognostic biomarker compared withthat of CA 19–9 alone. The present study explored levels of MUC5AC in various benign groups [abnormal imaging/benign findings in endoscopic ultrasound; AP, common bile duct (CBD) stones, choledocele, duodenal ulcer] and performed additional analyses of MUC5AC levels in acute pancreatitis and control groups having FHPC. Amongst the previously described benign controls, elevated levels of MUC5AC were observed in two cases of adenoma (from colon screen controls) and one case of cholangiocarcinoma, which are plotted separately in Supplementary Figure S1D online. As evident from the figure, it was difficult to attribute elevated levels of MUC5AC (when observed) to a specific sub-group, either due to variability or to limited sample size. Further, the control group with family history of pancreatic cancer (FHPC) showed that some individuals had visible levels of MUC5AC. However, there is currently no follow-up information available for these subjects to determine if this was an indication of occult malignancy. To accurately access and utilize MUC5AC as a potential biomarker, these observations warrant the future assessment of MUC5AC levels in a longitudinally collected sample sets from patients with initial presentation of benign disease. The post- and pre-surgical monitoring of MUC5AC levels in individual patients showed a positive trend with the removal of tumor bulk upon surgery (Supplementary Figure S2B online). These results suggest that in addition to serving as a biomarker for early disease diagnosis, MUC5AC has potential utility to monitor patient responses post-treatment like CA19–9. As such, it will be of immediate interest to evaluate the performance of MUC5AC in combination with CA19–9 in a cohort of PC patients undergoing chemotherapy, radiotherapy, or surgical interventions.
PAM4 was recently identified and validated as a highly sensitive and specific marker for PC. Specifically, in Stage I and II patients, PAM4 exhibits greatly improved diagnostic performance compared with CA19–9 (ref. 19). Initially identified as an epitope on MUC1 (refs. 20,21), a recent study suggested that anti-PAM4 antibody can recognize MUC5AC (22). Thus, it will be of interest to evaluate the performance of PAM4 and MUC5AC in the same sample set. The present study was a single biomarker study performed in combination with CA19–9. The use of multiple sample sets (training and independent validation sets), with promising outcomes, suggests that MUC5AC has the significant potential to serve in the future as a non-invasive biomarker. However, expression of MUC5AC in 76% of the primary tumor might contribute to the lower sensitivity in the early stages of the disease. It would be advisable that, to achieve desired diagnostic performance, further studies focus on combining MUC5AC with other promising serum-based biomarkers including miRNA panels, MIC-1, OPN, HSP27, TPS, TSGF, and CAM17 (ref. 23).
It is important to emphasize that early diagnosis of PC is critical since late diagnosis contributes significantly to lethality of PC. On the other hand, surgical resection during early stage provides best curative response. To this end, biomarkers could greatly aid in the timely and potentially life-saving diagnoses of patients. Considering the high lethality rate for PC, efforts are currently underway to identify novel markers that can either partially or fully help identify generic symptomatic patients under the criterion of resectability. Overall, the present study, for the first time comprehensively demonstrates that MUC5AC in combination with CA19–9 can significantly improve the early diagnosis of PC. Elevated levels of MUC5AC are not only observed in cases of resectable PC but also showed marked improvement in the specificity of CA19–9. Further, for the approximately 5–10% of patients who lack the the ability to synthesize CA19–9 epitope/sialyl-Lewis A, MUC5AC will be a useful biomarker to improve detection of PC. In addition, significant differences in MUC5AC levels were observed between resectable PC (Stage I, IIA, and IIB) and unresectable PC (Stage III and IV, Figure 2b). The overall improved efficacy of MUC5AC to differentiate between benign and primarily chronic pancreatitis control groups is significant considering that this is one of the major risks for developing PC. Thus, the novel, mucin-based biomarker MUC5AC has the potential to provide a critical edge. This comprehensive study with multiple patient sets is encouraging compared with several past studies that examined other potential biomarkers. Notably, this study was performed using highly economical and reproducible MUC5AC ELISA, which highlights the significance of this novel marker in combination with CA19–9, without economically over burdening the critical patient care.
Considering the high diagnostic efficacy of MUC5AC, it will be of interest to evaluate its performance in pre-diagnostic cohorts. However, due to relatively low incidences and predominantly sporadic nature of PC, such samples are rarely available. The best opportunity for obtaining pre-diagnostic samples will be through examining high-risk groups, including individuals with history of hereditary pancreatitis, Peutz-Jeghers disorder, familial atypical multiple mole melanoma, cystic fibrosis, familial cancer syndrome such as Lynch syndrome, familial adenomatous polyposis (APC mutation), and BRCA2 mutations as well as individuals with FHPC. Efforts are underway in our laboratory to evaluate MUC5AC levels in these high risk cohorts. Further, we plan to validate MUC5AC in a longitudinally collected prostate, lung, colorectal, and ovarian (PLCO) study set in which some patients developed PC.
Finally, considering the high potential of MUC5AC and CA19–9 combinations, we are highly hopeful that present study will pave the way to the development of a biomarker panel that can help achieve overarching challenge of improving the 5 years survival rate from <6 to 20% by pancreatic cancer society in near future. In addition, the MUC5AC based diagnostic test could be of high utility in patients with suspicion of pancreatic adenocarcinoma (pancreatic mass) in imaging, as it is well known that 5–10% of these patients who undergo resective surgery have a final diagnosis of benign disease. Findings from this study strongly support future trials to evaluate the diagnostic/prognostic utility of MUC5AC for atypical/suspicious for malignancy on fine-needle aspiration (FNA) of pancreatic mass lesions that account for 2% to 29% in various studies. Overall, the encouraging findings from this study strongly support that future trials assess the diagnostic/prognostic utility of MUC5AC for diagnosing PC.
Supplementary Material
Study Highlights.
WHAT IS CURRENT KNOWLEDGE
-
✓
Pancreatic cancer is among the most lethal malignancies.
-
✓
Early diagnosis is the key to better survival of patients.
-
✓
Majority of the patients are clinically presented at later stages due to lack of early diagnostic markers.
WHAT IS NEW HERE
-
✓
Differential expression of mucins 5AC is observed in the early precursor lesions of pancreatic cancer.
-
✓
Progressive increase in MUC5AC levels is observed with the pancreatic disease progression.
Acknowledgments
We thank Melody A. Montgomery for the professional editing of this manuscript. This study was, in parts, funded by the NIH grants (EDRN CA111294, RO1 CA131944, U54 CA163120, P50 CA127297 and EDRN UO1 CA200466). We also thank Dr. Anirban Maitra for providing us the pancreatic intraepithelial precursor lesions (PanIN) Tissue Microarray. We are highly thankful to Dr. Jacques Bara from INSERM U-482, Paris, France for the generous gift of 1-13M1 antibody against MUC5AC.
Footnotes
SUPPLEMENTARY MATERIAL is linked to the online version of the paper at http://www.nature.com/ajg
CONFLICT OF INTEREST
Guarantor of the article: Surinder K. Batra, PhD and Randall E. Brand, MD.
Potential competing interests: None.
Specific author contributions: Sukhwinder Kaur, Melanie Menning, Duncan C. Watley, Abhijit Aithal, Saad S. Malik, Asish Patel, Shiv Ram Krishn, Kavita Mallya were involved in study design, performing biomarker assays, assay interpretation and writing the manuscript. Lynette M. Smith involved in statistical analysis of the data. Aaron Sasson, Sushovan Guha, Maneesh Jain, Shailender Singh, Chandrakantha Are, Massimo Raimondo, Michael A. Hollingsworth and Randall Brand were involved in collection of samples for the study, assay interpretation and writing the manuscript. Surinder K. Batra was involved in study design, interpretation of assays and the writing of the manuscript. Surinder K. Batra and Randall E. Brand are guarantors for the article.
References
- 1.Rahib L, Smith BD, Aizenberg R, et al. Projecting cancer incidence and deaths to 2030: the unexpected burden of thyroid, liver, and pancreas cancers in the United States. Cancer Res. 2014;74:2913–21. doi: 10.1158/0008-5472.CAN-14-0155. [DOI] [PubMed] [Google Scholar]
- 2.Kaur S, Kumar S, Momi N, et al. Mucins in pancreatic cancer and its microenvironment. Nat Rev Gastroenterol Hepatol. 2013;10:607–20. doi: 10.1038/nrgastro.2013.120. [DOI] [PMC free article] [PubMed] [Google Scholar]
- 3.Brand RE, Nolen BM, Zeh HJ, et al. Serum biomarker panels for the detection of pancreatic cancer. Clin Cancer Res. 2011;17:805–16. doi: 10.1158/1078-0432.CCR-10-0248. [DOI] [PMC free article] [PubMed] [Google Scholar]
- 4.Kaur S, Baine MJ, Jain M, et al. Early diagnosis of pancreatic cancer: challenges and new developments. Biomark Med. 2012;6:597–612. doi: 10.2217/bmm.12.69. [DOI] [PMC free article] [PubMed] [Google Scholar]
- 5.Koopmann J, Rosenzweig CN, Zhang Z, et al. Serum markers in patients with resectable pancreatic adenocarcinoma: macrophage inhibitory cytokine 1 versus CA19-9. Clin Cancer Res. 2006;12:442–6. doi: 10.1158/1078-0432.CCR-05-0564. [DOI] [PubMed] [Google Scholar]
- 6.Locker GY, Hamilton S, Harris J, et al. ASCO 2006 update of recommendations for the use of tumor markers in gastrointestinal cancer. J Clin Oncol. 2006;24:5313–27. doi: 10.1200/JCO.2006.08.2644. [DOI] [PubMed] [Google Scholar]
- 7.Goonetilleke KS, Mason JM, Siriwardana P, et al. Diagnostic and prognostic value of plasma tumor M2 pyruvate kinase in periampullary cancer: evidence for a novel biological marker of adverse prognosis. Pancreas. 2007;34:318–24. doi: 10.1097/MPA.0b013e31802ee9c7. [DOI] [PubMed] [Google Scholar]
- 8.Duffy MJ, Sturgeon C, Lamerz R, et al. Tumor markers in pancreatic cancer: a European Group on Tumor Markers (EGTM) status report. Ann Oncol. 2010;21:441–7. doi: 10.1093/annonc/mdp332. [DOI] [PubMed] [Google Scholar]
- 9.Brody JR, Witkiewicz AK, Yeo CJ. The past, present, and future of biomarkers: a need for molecular beacons for the clinical management of pancreatic cancer. Adv Surg. 2011;45:301–21. doi: 10.1016/j.yasu.2011.04.002. [DOI] [PubMed] [Google Scholar]
- 10.Ghaneh P, Costello E, Neoptolemos JP. Biology and management of pancreatic cancer. Postgrad Med J. 2008;84:478–97. doi: 10.1136/gut.2006.103333. [DOI] [PubMed] [Google Scholar]
- 11.Goggins M. Molecular markers of early pancreatic cancer. J Clin Oncol. 2005;23:4524–31. doi: 10.1200/JCO.2005.19.711. [DOI] [PubMed] [Google Scholar]
- 12.Iacobuzio-Donahue CA, Ashfaq R, Maitra A, et al. Highly expressed genes in pancreatic ductal adenocarcinomas: a comprehensive characterization and comparison of the transcription profiles obtained from three major technologies. Cancer Res. 2003;63:8614–22. [PubMed] [Google Scholar]
- 13.Altman DG, McShane LM, Sauerbrei W, et al. Reporting recommendations for tumor marker prognostic studies (REMARK): explanation and elaboration. BMC Med. 2012;10:51. doi: 10.1186/1741-7015-10-51. [DOI] [PMC free article] [PubMed] [Google Scholar]
- 14.Kaur S, Baine MJ, Guha S, et al. Neutrophil gelatinase-associated lipocalin, macrophage inhibitory cytokine 1, and carbohydrate antigen 19-9 in pancreatic juice: pathobiologic implications in diagnosing benign and malignant disease of the pancreas. Pancreas. 2013;42:494–501. doi: 10.1097/MPA.0b013e31826a8597. [DOI] [PMC free article] [PubMed] [Google Scholar]
- 15.Del Villano BC, Brennan S, Brock P, et al. Radioimmunometric assay for a monoclonal antibody-defined tumor marker, CA 19-9. Clin Chem. 1983;29:549–52. [PubMed] [Google Scholar]
- 16.Wongkham S, Sheehan JK, Boonla C, et al. Serum MUC5AC mucin as a potential marker for cholangiocarcinoma. Cancer Lett. 2003;195:93–9. doi: 10.1016/s0304-3835(02)00691-2. [DOI] [PubMed] [Google Scholar]
- 17.Albert MB, Steinberg WM, Henry JP. Elevated serum levels of tumor marker CA19-9 in acute cholangitis. Dig Dis Sci. 1988;33:1223–5. doi: 10.1007/BF01536670. [DOI] [PubMed] [Google Scholar]
- 18.Dumitra S, Jamal MH, Aboukhalil J, et al. Pancreatic cancer and predictors of survival: comparing the CA 19-9/bilirubin ratio with the McGill Brisbane Symptom Score. HPB (Oxford) 2013;15:1002–9. doi: 10.1111/hpb.12085. [DOI] [PMC free article] [PubMed] [Google Scholar]
- 19.Ballehaninna UK, Chamberlain RS. The clinical utility of serum CA 19-9 in the diagnosis, prognosis and management of pancreatic adenocarcinoma: An evidence based appraisal. J Gastrointest Oncol. 2012;3:105–19. doi: 10.3978/j.issn.2078-6891.2011.021. [DOI] [PMC free article] [PubMed] [Google Scholar]
- 20.Gold DV, Modrak DE, Ying Z, et al. New MUC1 serum immunoassay differentiates pancreatic cancer from pancreatitis. J Clin Oncol. 2006;24:252–8. doi: 10.1200/JCO.2005.02.8282. [DOI] [PubMed] [Google Scholar]
- 21.Gold DV, Gaedcke J, Ghadimi BM, et al. PAM4 enzyme immunoassay alone and in combination with CA 19-9 for the detection of pancreatic adenocarcinoma. Cancer. 2013;119:522–8. doi: 10.1002/cncr.27762. [DOI] [PMC free article] [PubMed] [Google Scholar]
- 22.Gold DV, Newsome G, Liu D, et al. Mapping PAM4 (clivatuzumab), a monoclonal antibody in clinical trials for early detection and therapy of pancreatic ductal adenocarcinoma, to MUC5AC mucin. Mol Cancer. 2013;12:143. doi: 10.1186/1476-4598-12-143. [DOI] [PMC free article] [PubMed] [Google Scholar]
- 23.Bunger S, Laubert T, Roblick UJ, et al. Serum biomarkers for improved diagnostic of pancreatic cancer: a current overview. J Cancer Res Clin Oncol. 2011;137:375–89. doi: 10.1007/s00432-010-0965-x. [DOI] [PMC free article] [PubMed] [Google Scholar]
Associated Data
This section collects any data citations, data availability statements, or supplementary materials included in this article.