

Abstract
To provide a molecular insight for guiding polymer coating in surface science and nanotechnology, here we examined the structures of brushed polyethylene glycol(bPEG)- and phosphorylcholine(bPC)-grafted iron oxide nanoparticles and analyzed their protein avoiding properties. We show bPC as an advantageous biomimetic alternative to PEG in rendering stealth nanostructures.
Graphical abstract
Polyethylene glycol (PEG) has been widely used as a grafting agent in biomedical and surface sciences1. Since ethylene oxide can readily form hydrogen bonds with water, PEG is completely miscible in water2 and adopts an expanded conformation with high mobility in aqueous media1. Both small angle neutron scattering (SANS) and computational studies have revealed that the structure of PEG depends on its molecular weight (MW), concentration, temperature, and the solvent and ions of the environment3. Accordingly, PEGylation ascribes the stealth effect to engineered implants, films and nanostructures against immune responses from their biological hosts4–6 and confers a resistance to the adsorption of plasma proteins7 from rendering a protein “corona”8.
Despite its prevalent use, PEG in either linear or brushed form is not biodegradable and a chronic administration renders accumulation of the polymer in vivo with unknown consequences. In addition, repeated dosing of PEG gives rise to accelerated blood clearance9, thereby compromising the circulation and efficacy of PEGylated drugs and nanocarriers. Furthermore, PEG polymers were found to bind hen-egg white lysozyme through hydrophobic interaction as indicated by proton nuclear magnetic resonance spectroscopy.10 Recently, proteomic studies have revealed that poly(alkyl cyanoacrylate), poly(lactic acid), gold nanoparticles (NPs) and PEGylated polystyrene are prone to the adsorption of apolipoproteins A-1 and E as well as complement proteins that play important roles in immunogenicity11–13, while anti-PEG antibodies have been found in healthy subjects and in patients treated with PEG-conjugated agents.14 These findings point to the urgent need of developing additional grafting strategies for biotechnological and biomedical applications.
Phosphorylcholine (PC) is the head group of phosphatidylcholine and sphingomyelin and corresponds to a major component of cell membranes. As a result of its biomimetic properties, PC has been applied as an antifouling agent for the treatment of surfaces and nanostructures against protein adsorption6,15–19. We have recently demonstrated a facile scheme of grafting superparamagnetic iron oxide nanoparticles (IONPs) with poly(2-(methacryloyloxy)ethyl phosphorylcholine) (poly(MPC)) brushes via a phosphonic acid linker20.
In consideration of the widespread applications of PEGylation and IONPs and in light of the vast potential of PC as a grafting agent for NP synthesis and engineering, here we combined computational modelling with experimental characterizations to study the structures of IONPs grafted with PEG and PC brushes and examine their antifouling properties against human serum albumin (HSA), the most abundant protein in the blood plasma. We applied discrete molecular dynamics (DMD) simulations, a rapid molecular dynamics method with proven predictive power for describing the structures and dynamics of proteins21–23, polymers24, and nanoparticles25,26. We used a united atom representation to model linear PEG, bPEG and bPC (adopted from our recent synthesis20, Fig. 1A). Since the radii of gyration (Rg) of linear PEG with different molecular weights have been measured experimentally27,28, we first evaluated whether DMD simulations could recapitulate the experimental observations. In DMD simulations, the polymers rapidly reached equilibrium with Rg values fluctuating around their average values (e.g. Fig. S1). Indeed, across different molecular weights the Rg values for linear PEG in our simulation matched well with the data from the SANS experiments (Fig. 1B). Fitting Rg against MW yielded a power law of Rg=0.284MW0.539, in agreement with the scaling exponent of 0.550 from light scattering29,30 and 0.542 from a coarse-grained simulation31. Therefore, the scaling exponent (>0.5 for a Gaussian chain) obtained from our DMD simulations and previous studies suggests that linear PEG adopts a self-avoiding random conformation in aqueous solution.
Figure 1.

(A) Structures of simulated brushed PEG and PC. Small letters a and b correspond to the terminal atoms of the polymer main chain. (B) Radius of gyration, Rg, for linear PEG with varied MW. (C) Correlation coefficients for PEG and PC. (D) Dynamics of end-to-end distance, radius of gyration and ellipticity for brushed PEG and brushed PC.
We next examined the conformational properties for all three types of polymers by computing their auto-correlations as a function of polymer repeating number along the backbone (Methods in ESI; Fig. 1C). The auto-correlation coefficient of linear PEG approached zero after 6 repeating units (-CH2-CH2-O-), while bPEG and bPC featured higher persistence lengths. The slowest decay of the auto-correlation function of bPC suggests that bPC was the most rigid. To provide a more detailed structural comparison between bPEG and bPC, we computed the end-to-end distance along the main chain, Rg, and the ellipticity e (Fig. 1D). The ellipticity e quantifies the overall shape of a molecule, where a large e-value indicates deviation from a spherical structure (e=0). bPEG and bPC had similar Rg values, but displayed different globular morphologies (Fig. 1C, inset snapshots). Specifically, bPC possessed a larger end-to-end distance and much higher ellipticity (~1) with a rod-like shape. With PC being shorter, bPC appeared like a “comb” (Fig. 1C). In comparison, bPEG displayed a more spherical architecture due to their longer and well-expanded PEG side chains.
Following the procedures described in our previous publication20, we synthesized IONPs grafted with bPEG, bPC, and their mixture to determine their protein antifouling properties (Methods in ESI; Fig. 2). To facilitate tracking of IONPs we also attached Cyanine5 amine (Cy5) fluorophores to bPEG (Fig. 2A,C). Transmission electron microscopy (TEM) imaging was performed to determine the primary size distributions of the IONPs (Fig. 2B). The IONPs were spherical in shape and 11.4 ± 3.6 nm in diameter in all cases. No coating layers were visible under TEM due to the low electron densities of PC and PEG. We measured the absorption spectra of the florescent IONPs and the controls (Fig. 3A). For IONP grafted with 100% Cy5-bPEG, the absorption spectrum near 660 nm is consistent with that of Cy5 and the peak near 600 nm is reminiscent to that of bare IONP. Upon replacement of half of the Cy5-bPEG by bPC, the florescence of the remaining Cy5-bPEG was fully quenched. As PC groups had little direct effect on the optical properties of Cy5, this quenching was likely due to the conformational changes of bPEG induced by bPC on the IONP surfaces. To understand this phenomenon, we subsequently modelled all three different types of IONPs, grafted with 100% bPEG, 100% bPC and 50:50 bPEG/bPC. Due to the size heterogeneity of IONPs (Fig. 2), we included two IONP sizes of 10 nm and 7 nm in diameter in the simulations. We followed a previous computational approach26 to model the ligand-grafted NPs with a total of 50 ligands per NP, approximating the average number of ligands per NP during experimental synthesis20. As a result, the ligand density for the 7 nm IONP approximately doubled that of the 10 nm IONP.
Figure 2.

(A) IONPs grafted with PEG (1), PC (2), PEG-PC (3) and Cy5-PEG (4) polymers. (B) TEM images of IONPs grafted with different polymer agents: (1) IONPs, (2) IONP-PEG, (3) IONP-PC, and (4) IONP-PEG-PC (50:50). Scale bar: 20 nm. (C) Synthesis and grafting of Cy5-PEG polymer to IONPs.
Figure 3.

(A) Absorption spectra of bare IONP (grey), Cy5 (blue), IONP-PEG (orange), Cy5-IONP-PEG (red) and Cy5-IONP-PEG-PC (50:50) (green). (B) Average height of ligand for bPC, bPEG and MIX (50:50) IONPs (7 nm and 10 nm). (C) Contrasting morphologies of the polymer brushes grafted onto 7 nm IONPs.
It has been shown that mixing two different types of ligands on a NP surface may result in formation of specific patterns, such as the striped configurations3,26,32,33. Following the thermodynamics model of binary self-assembled monolayer (bSAM), we estimated the potential energy of the molecular system as the function of temperature for both randomly mixed and phase separated states of bPEG and bPC (Fig. S2). We found that the two states had similar potential energies within a wide range of temperatures (including 300 K), suggesting that the two ligands were miscible with each other and that complete or partial phase separation (i.e., the striped state32) was thermodynamically unfavourable for the bPEG-bPC mixture (Fig. S2). We therefore modelled the bPEG-bPC grafted IONP with random distribution of the ligands.
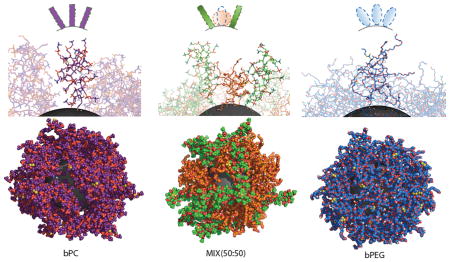
To quantify the conformational changes of bPC and bPEG due to inter-ligand interactions on the IONP surface, we computed the height of ligand defined as the shortest distance from the terminal atom of the ligand to the IONP surface. For each IONP grafted with 100% bPEG, 100% bPC or 50:50 bPEG-bPC, the average height for bPEG and bPC were computed (Fig. 3B). Ligands with a higher grafting density on a smaller IONP presented an overall higher average height due to enhanced steric repulsion. Since the spherical bPEG has larger projected surface area and less height than the cylindrical bPC (Fig. 1), a bPEG grafted IONP displayed a more crowded surface ligand coverage than a bPC grafted IONP (Fig. 3C). Therefore, ligands on bPEG grafted IONP experienced stronger lateral constraints than those on bPC grafted IONP. Upon mixing, the average height of bPEG deceased since their neighboring bPC occupied less surface areas and the lateral constraints on bPEG were relaxed. On the other hand, the average height of bPC increased since the ligands experienced a higher lateral constraints from their adjacent bPEG. Such conformational changes were more significant on the surface of smaller IONP (Fig. 3B). Therefore, the shorter distance between the Cy5 fluorophore of bPEG and the IONP core -- a fluorescence quencher34,35 -- resulted in a stronger fluorescence quenching observed experimentally for bPEG-bPC grafted IONP (Fig. 3A).
To estimate the antifouling capacities of bPEG and bPC grafted IONPs within the blood plasma, thermogravimetric analysis (TGA) was performed to determine the amounts of HSA adsorbed on bare IONPs and IONPs grafted with bPEG, bPC or bPEG-bPC (50:50) (Fig. 4A). All IONPs lost mass between 220 °C and 420 °C, which can be attributed to the decomposition of the grafting polymers and HSA. In the absence of polymer coating, the weight loss of bare IONPs was ~4.0% due to water and impurities desorbed from the IONP surfaces. The differences between IONP samples with and without HSA incubation quantified the amount of HSA bound to the IONPs. Specifically, HSA displayed strongest binding for bare IONPs (14.6%) (Table S1), while bPEG-IONP, bPC-IONP and bPEG-bPC-IONP bound 61%, 66% and 58% less of HSA than bare IONPs in comparison. These differences in antifouling were due to the two-step grafting of bPEG and bPC as well as bPEG-bPC mutual interactions in bPEG-bPC-IONP to impact Rg and excluded volume, aside from the differences between PEG and PC.
Figure 4.

(A) Thermogravimetric analysis of IONPs, IONP-PEG, IONP-PC and IONP-PEG-PC (50:50) interacting with HSA. (B) 1D-PMF of HSA binding with 10 nm (top) and 7 nm (bottom) IONPs grafted by bPC or bPEG. (C, D) Snapshots of HSA binding with bPEG and bPC grafted IONPs of 10 and 7 nm in diameter.
We performed DMD simulations to understand the binding of HSA with IONPs grafted with different ligands. Given the large system size, we applied umbrella sampling to characterize the binding free energy landscape. We modelled IONPs with diameters of both 7 nm and 10 nm, each of which was functionalized by either bPEG or bPC. Considering the large size of HSA with a dimension of 6×6×8 nm and MW of 66.5 kDa, we kept the protein static and IONP flexible in the simulations. We used the inter-molecular distance between the centers of both IONP and HSA, rcenter, as the reaction coordinate. For each umbrella simulation with a given distance range of rcenter, we performed binding simulations with six different orientations to account for the irregular shape of HSA while assuming the relative homogeneity of the IONPs. We estimated the potential of mean force (PMF) as a function of rcenter using the weighted histogram analysis method (WHAM)36. For binding comparison we aligned the free energy basins of the bound states for both cases. For the 10 nm IONPs, both bPEG and bPC grafted IONPs displayed weak barriers (e.g., 1 KBT ~ 0.6 kcal/mol at 300 Kelvin) between the bound and unbound states (Fig. 4B), suggesting weak binding of HSA with both ligand-grafted IONPs. The free energy basin of bPEG-IONP binding with HSA was significantly wider than that of bPC-IONP, possibly due to the softer structure of bPEG accommodating more HSA binding conformations (Fig. 1B). By integrating the one dimensional (1D)-PMF and assuming the same free energy for the unbound state of both molecular systems, we found that bPEG-IONP bound slightly stronger to HSA than bPC-IONP (ΔΔG ~ −0.1 kcal/mol; Methods in ESI). Despite the small difference in binding energy, the correspondingly estimated ratio of protein binding, exp(ΔΔG/KBT) ~0.85, was remarkably consistent with the experimentally observed relative binding of HSA (e.g., 4.9/5.7~ 0.86; Fig. 4A, Table S1).
In the case of 7 nm IONP with an approximately double grafting density, we did not observe any distinctive barriers separating the bound and unbound states (Fig. 4C) indicating complete repulsion of HSA. With a higher ligand grafting density, the grafting layer became thicker (e.g., the larger ligand height in Fig. 3) with a better ligand coverage (Fig. 4D). For example, the weak binding of HSA with 10 nm IONP is due to a large contact area between HSA and ligands, which can be accommodated by ligand rearrangement on the NP surface. While in the case of 7 nm IONP, the fully covered grafting layer with stronger lateral constraints (Fig. 3B) could elastically push the protein away to result in a net repulsion (Fig. 4C). Given the heterogeneities of NP size and ligand grafting density in synthesis, our results suggest that HSA prefer to bind IONPs with lower ligand grafting densities. Additionally, for IONPs with different diameters, the more rigid bPC featured stronger repulsion to HSA than bPEG (Fig. 4B–D). Therefore, bPC possessed a higher anti-fouling capacity than bPEG, further enhanced by the feasibility of a higher grafting density due to its cylindrical shape. In consideration of the widespread applications of polymeric materials, this study offers crucial new knowledge for guiding the design and synthesis of stealth nanostructures for nanomedicine and nanobiotechnology.
Supplementary Material
Acknowledgments
This work was supported by ARC Project CE140100036 (Davis), NSF CAREER CBET-1553945 (Ding), and NIH R15ES022766-01A1 (Ding). Davis is thankful for the award of an Australian Laureate Fellowship from the ARC.
Footnotes
Electronic Supplementary Information (ESI) available: Experimental and computational details. See DOI: 10.1039/x0xx00000x
Notes and references
- 1.Nagasaki Y. Polym J. 2011;43:949–958. [Google Scholar]
- 2.Malcolm GN, Rowlinson JS. Trans Faraday Soc. 1957;53:921–931. [Google Scholar]
- 3.Singh C, Ghorai PK, Horsch MA, Jackson AM, Larson RG, Stellacci F, Glotzer SC. Phys Rev Lett. 2007;99:226106. doi: 10.1103/PhysRevLett.99.226106. [DOI] [PubMed] [Google Scholar]
- 4.Banerjee I, Pangule RC, Kane RS. Adv Mater Deerfield Beach Fla. 2011;23:690–718. doi: 10.1002/adma.201001215. [DOI] [PubMed] [Google Scholar]
- 5.Arami H, Khandhar A, Liggitt D, Krishnan KM. Chem Soc Rev. 2015;44:8576–8607. doi: 10.1039/c5cs00541h. [DOI] [PMC free article] [PubMed] [Google Scholar]
- 6.Garapaty A, Champion JA. Chem Commun Camb Engl. 2015;51:13814–13817. doi: 10.1039/c5cc03459k. [DOI] [PubMed] [Google Scholar]
- 7.Cui J, De Rose R, Alt K, Alcantara S, Paterson BM, Liang K, Hu M, Richardson JJ, Yan Y, Jeffery CM, Price RI, Peter K, Hagemeyer CE, Donnelly PS, Kent SJ, Caruso F. ACS Nano. 2015;9:1571–1580. doi: 10.1021/nn5061578. [DOI] [PubMed] [Google Scholar]
- 8.Cedervall T, Lynch I, Lindman S, Berggård T, Thulin E, Nilsson H, Dawson KA, Linse S. Proc Natl Acad Sci. 2007;104:2050–2055. doi: 10.1073/pnas.0608582104. [DOI] [PMC free article] [PubMed] [Google Scholar]
- 9.Butcher NJ, Mortimer GM, Minchin RF. Nat Nanotechnol. 2016;11:310–311. doi: 10.1038/nnano.2016.6. [DOI] [PubMed] [Google Scholar]
- 10.Furness EL, Ross A, Davis TP, King GC. Biomaterials. 1998;19:1361–1369. doi: 10.1016/s0142-9612(98)00007-6. [DOI] [PubMed] [Google Scholar]
- 11.Brambilla D, Verpillot R, Le Droumaguet B, Nicolas J, Taverna M, Kóňa J, Lettiero B, Hashemi SH, De Kimpe L, Canovi M, Gobbi M, Nicolas V, Scheper W, Moghimi SM, Tvaroška I, Couvreur P, Andrieux K. ACS Nano. 2012;6:5897–5908. doi: 10.1021/nn300489k. [DOI] [PubMed] [Google Scholar]
- 12.Saha K, Rahimi M, Yazdani M, Kim ST, Moyano DF, Hou S, Das R, Mout R, Rezaee F, Mahmoudi M, Rotello VM. ACS Nano. 2016;10:4421–4430. doi: 10.1021/acsnano.6b00053. [DOI] [PMC free article] [PubMed] [Google Scholar]
- 13.Schöttler S, Becker G, Winzen S, Steinbach T, Mohr K, Landfester K, Mailänder V, Wurm FR. Nat Nanotechnol. 2016;11:372–377. doi: 10.1038/nnano.2015.330. [DOI] [PubMed] [Google Scholar]
- 14.Garay RP, El-Gewely R, Armstrong JK, Garratty G, Richette P. Expert Opin Drug Deliv. 2012;9:1319–1323. doi: 10.1517/17425247.2012.720969. [DOI] [PubMed] [Google Scholar]
- 15.Feng W, Brash JL, Zhu S. Biomaterials. 2006;27:847–855. doi: 10.1016/j.biomaterials.2005.07.006. [DOI] [PubMed] [Google Scholar]
- 16.Feng W, Gao X, McClung G, Zhu S, Ishihara K, Brash JL. Acta Biomater. 2011;7:3692–3699. doi: 10.1016/j.actbio.2011.06.007. [DOI] [PubMed] [Google Scholar]
- 17.Lewis Colloids Surf B Biointerfaces. 2000;18:261–275. doi: 10.1016/s0927-7765(99)00152-6. [DOI] [PubMed] [Google Scholar]
- 18.Matsuno R, Ishihara K. Macromol Symp. 2009;279:125–131. [Google Scholar]
- 19.Müllner M, Cui J, Noi KF, Gunawan ST, Caruso F. Langmuir. 2014;30:6286–6293. doi: 10.1021/la501324r. [DOI] [PubMed] [Google Scholar]
- 20.Blin T, Kakinen A, Pilkington EH, Ivask A, Ding F, Quinn JF, Whittaker MR, Ke PC, Davis TP. Polym Chem. 2016;7:1931–1944. doi: 10.1039/C6PY01480A. [DOI] [PMC free article] [PubMed] [Google Scholar]
- 21.Allen MP, Tildesley DJ. Computer Simulation of Liquids. Clarendon Press; 1989. [Google Scholar]
- 22.Ding F, Tsao D, Nie H, Dokholyan NV. Structure. 2008;16:1010–1018. doi: 10.1016/j.str.2008.03.013. [DOI] [PMC free article] [PubMed] [Google Scholar]
- 23.Dagliyan O, Proctor EA, D’Auria KM, Ding F, Dokholyan NV. Struct Lond Engl 1993. 2011;19:1837–1845. doi: 10.1016/j.str.2011.09.014. [DOI] [PMC free article] [PubMed] [Google Scholar]
- 24.Wang B, Geitner NK, Davis TP, Ke PC, Ladner DA, Ding F. J Phys Chem C. 2015 [Google Scholar]
- 25.Ding F, Radic S, Chen R, Chen P, Geitner NK, Brown JM, Ke PC. Nanoscale. 2013;5:9162–9169. doi: 10.1039/c3nr02147e. [DOI] [PMC free article] [PubMed] [Google Scholar]
- 26.Ge X, Ke PC, Davis TP, Ding F. Small. 2015;11:4894–4899. doi: 10.1002/smll.201501049. [DOI] [PMC free article] [PubMed] [Google Scholar]
- 27.Petrenko V, Bulavin L, Avdeev M, Garamus V, Koneracka M, Kopcansky P. Macromol Symp. 2014;335:20–23. [Google Scholar]
- 28.Rubinson KA, Krueger S. Polymer. 2009;50:4852–4858. [Google Scholar]
- 29.Devanand K, Selser JC. Macromolecules. 1991;24:5943–5947. [Google Scholar]
- 30.Kawaguchi S, Imai G, Suzuki J, Miyahara A, Kitano T, Ito K. Polymer. 1997;38:2885–2891. [Google Scholar]
- 31.Prasitnok K, Wilson MR. Phys Chem Chem Phys. 2013;15:17093–17104. doi: 10.1039/c3cp52958d. [DOI] [PubMed] [Google Scholar]
- 32.Jackson AM, Myerson JW, Stellacci F. Nat Mater. 2004;3:330–336. doi: 10.1038/nmat1116. [DOI] [PubMed] [Google Scholar]
- 33.Singh C, Ghorai PK, Horsch MA, Jackson AM, Larson RG, Stellacci F, Glotzer SC. Phys Rev Lett. 2007;99:226106. doi: 10.1103/PhysRevLett.99.226106. [DOI] [PubMed] [Google Scholar]
- 34.Manciulea A, Baker A, Lead JR. Chemosphere. 2009;76:1023–1027. doi: 10.1016/j.chemosphere.2009.04.067. [DOI] [PubMed] [Google Scholar]
- 35.Sathe TR, Agrawal A, Nie S. Anal Chem. 2006;78:5627–5632. doi: 10.1021/ac0610309. [DOI] [PubMed] [Google Scholar]
- 36.Kumar S, Rosenberg JM, Bouzida D, Swendsen RH, Kollman PA. J Comput Chem. 1992;13:1011–1021. [Google Scholar]
Associated Data
This section collects any data citations, data availability statements, or supplementary materials included in this article.