

Summary
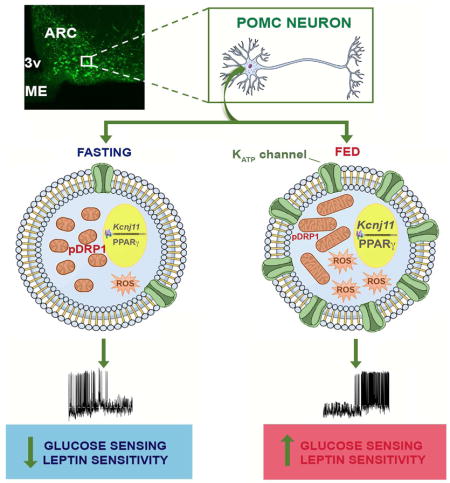
Hypothalamic Pro-opiomelanocortin (POMC) neurons regulate energy and glucose metabolism. Intracellular mechanisms that enable these neurons to respond to changes in metabolic environment are ill-defined. Here we show reduced expression of activated dynamin-related protein (pDRP1), a mitochondrial fission regulator, in POMC neurons of fed mice. These POMC neurons displayed increased mitochondrial size and aspect ratio compared to POMC neurons of fasted animals. Inducible deletion of DRP1 of mature POMC neurons (Drp1fl/fl-POMC-cre:ERT2) resulted in improved leptin sensitivity and glucose responsiveness. In Drp1fl/fl-POMC-cre:ERT2 mice, POMC neurons showed increased mitochondrial size, ROS production and neuronal activation with increased expression of Kcnj11 mRNA regulated by peroxisome proliferator-activated receptor (PPAR). Furthermore, deletion of DRP1 enhanced the glucoprivic stimulus in these neurons causing their stronger inhibition, and, a greater activation of counter-regulatory responses to hypoglycemia that were PPAR-dependent. Together these data unmasked a role for mitochondrial fission in leptin sensitivity and glucose sensing of POMC neurons.
Keywords: POMC neurons, Drp1, Mitochondrial fission, Leptin, Glucose sensing, Counter-regulatory responses to hypoglycemia
Graphical Abstract
Introduction
In the Central Nervous System (CNS), the hypothalamus plays a major role in regulating energy and glucose homeostasis (Diano, 2013) via the ability of several neuronal populations to respond to circulating peripheral signals, including nutrients. The molecular mechanisms by which hypothalamic neurons are able to sense these circulating signals and to respond by altering their activity levels have been the subject of many investigations. Studies from our laboratory have shown that reactive oxygen species (ROS), a by-product of nutrient oxidation, are important regulators of the anorexigenic and glucose-sensing pro-opiomelanocortin (POMC) neuronal activity (Andrews et al., 2008; Diano et al., 2011; Long et al., 2014). A positive correlation between POMC activity and ROS levels exists that leads to cessation of feeding and increased energy expenditure. Indeed, when ROS scavangers are selectively placed in the mediobasal hypothalamus, feeding behavior and cellular event associated with fasting such as POMC inhibition, are promoted (Diano et al., 2011).
Mitochondria are a major site of ROS production. These organelles are highly dynamic as they are able to move and change their morphology according to the energetic needs of a cell. Mitochondrial morphological alterations include fission and fusion (Nasrallah and Horvath, 2014). These processes are finely regulated by several proteins including Mitofusin 1 and 2 (MFN1 and MFN2) and Optic Atrophy (OPA) 1 for mitochondrial fusion, and, mitochondrial fission 1 (Fis1), mitochondrial fission factor (Mff), and Dynamin-related protein (Drp) 1 for mitochondrial fission (Liesa et al., 2009). Fis 1 and Mff are located on the outer mitochondrial membrane and are aggregated in contact with the endoplasmic reticulum to create a microdomain for assembly of DRP1, Mff and Fis1 (Hoppins et al 2012). When DRP1, a cytosolic protein, is activated, translocates to the outer membrane of the mitochondrion where it multimerizes generating a ring-like structure that constricts and divides this organelle (Lackner and Nunnari, 2009; Yoon and McNiven, 2001; Zhu et al., 2004). DRP1 activation is rapidly regulated by the phosphorylation of serine 616 and dephosphorylation of serine 637, that are targeted by different phosphatases and kinases, including Protein Kinase A (PKA) and calcium-calmodulin-dependent kinase (CamK; Han et al., 2008; Wilson et al., 2013).
Recent findings from our laboratory have shown that mitochondrial fission mediated by DRP1 is an important mechanism that enables glucose-excited neurons of the ventromedial nucleus of the hypothalamus to sense changes in circulating glucose levels and to alter their activity levels, thus, affecting peripheral glucose homeostasis (Toda et al., 2016). As arcuate POMC neurons are also important nutrients-sensing neurons involved in the regulation of energy and glucose homeostasis, this study was undertaken to examine the role of mitochondrial fission regulated by DRP1 in POMC-mediated control of energy and glucose metabolism.
Results
Decreased DRP1 activation in POMC neurons of fed mice
Mitochondrial dynamics has been shown to play a role in hypothalamic nutrient-sensing (Dietrich et al., 2013; Schneeberger et al., 2013; Toda et al., 2016). To further study its role in hypothalamic pro-opiomelanocortin (POMC) neurons, we performed double labeling for POMC and phosphorylated dynamin-related protein 1 (pDRP1) in fed and fasting conditions. Analysis of the double labeling revealed a significant difference in pDRP1-POMC co-localization in fasted versus fed states (Fig. 1A–G), with the fasted state showing a significant greater colocalization level (Fig. 1A–C,G) compared to the fed state (Fig. 1D–G). These data suggest that activation of POMC neurons in fed state is associated with reduced DRP1 activation, and thus, reduced mitochondrial fission.
Fig. 1. Decreased DRP1 activation in POMC neurons of fed mice.

(A–C) Representative light micrograph showing immunostaining for POMC (green; A) and phosphorylated DRP1 (pDRP1; red; B) and merged (C) in the arcuate nucleus of the hypothalamus of a fasted mouse.
(D–F) Representative light micrograph showing immunostaining for POMC (green; D) and phosphorylated DRP1 (pDRP1; red; E) and merged (F) in the arcuate nucleus of the hypothalamus of a fed mouse. Arrows point to colocalizing cells.
(G) Graph showing the percentage of POMC neurons immunopositive for pDRP1 (n= 6 per group).
(H–J) Representative electron micrographs showing mitochondria (asterisks) in a silent (cfos negative) POMC neuron of a fasted mouse (H), a silent (cfos negative) POMC neuron of a fed mouse (I) and an activated POMC cell (cfos positive) of a fed mouse (J). Arrows indicate POMC staining. Note cfos staining in the nucleus of the cell shown in J.
(K–N) Average mitochondrial area (K), mitochondrial density (L), mitochondrial coverage (M), and cumulative probability distribution of mitochondrial aspect ratio (N) in silent POMC neurons from fasted and fed mice and activated POMC neurons of fed mice (fasted mice, n = 700 mitochondria/15 cells/3 mice; fed mice, n=674 mitochondria/14 cfos negative cells/3mice and n=557 mitochondria/14 cfos positive cells/3mice).
Bar scale in C (for A–F) represents 50 μm. Bar scale in J (for H–J) represents 500 nm. 3v= third ventricle; ARC= arcuate nucleus; ME= median eminence. Data are represented as mean ± SEM. **=P<0.01 compared to fasted; and ****=P<0.0001 compared to fasted.
Increased mitochondrial size in activated POMC neurons of fed animals
We then analyzed mitochondrial size, density, coverage and aspect ratio in POMC neurons of fed and fasted mice. In support of the decreased pDRP1 expression and related fission in POMC neurons of fed mice, we found an increase in mitochondrial size (Fig. 1H–K), coverage (Fig. 1M) and cumulative probability distribution of mitochondrial aspect ratio (AR; the ratio between the major and minor axis of the ellipse equivalent to the mitochondrion; Fig. 1N) in activated (cfos positive) POMC neurons of fed animals compared to silent POMC neurons of fasted mice. No difference in mitochondrial density (Fig. 1L) was observed in POMC neurons of fed mice compared to fasted animals. Non-activated POMC neurons (cfos-negative) of fed mice showed also a significant increase in the average mitochondrial area (Fig. 1H–K) compared to POMC neurons of fasted mice, however, no difference in mitochondrial coverage (Fig. 1M) and cumulative probability distribution of mitochondrial AR (Fig. 1N) were observed. Altogether, these data further suggest that mitochondrial fusion specifically in activated POMC neurons is associated with fed state.
Selective deletion of DRP1 in POMC neurons alters POMC expression, activation and mitochondrial size
To study the role of mitochondrial fission in POMC neurons, we generated mice with selective deletion of DRP1 in POMC neurons (Drp1fl/fl-POMC-cre) using the loxP-Cre system (Fig. S1). To validate our model, we analyzed and found no DRP1 expression in the ARC of 3-months old Drp1fl/fl-POMC-cre compared to controls by immunohistochemistry (Fig. S1B–G). To assess the effects of DRP1 deletion at the cellular level, we performed POMC immunostaining in hypothalamic sections and observed a significant decrease of POMC immunoreactivity in the arcuate nucleus of Drp1fl/fl-POMC-cre mice compared to controls (Fig. S2A–C) as well as a significant reduction in POMC fibers in the hypothalamic paraventricular nucleus (Fig. S2D–F). No difference in AgRP fiber staining was observed between the 2 experimental groups (Fig. S2G–I). Electron microscopic examination of POMC neurons showed a significant increase in mitochondrial size (Fig. S2J–L) and coverage (Fig. S2M). No changes in aspect ratio (Fig. S2N) was observed while a decrease in mitochondrial number (Fig. S2O) was found in Drp1fl/fl-POMC-cre mice compared to controls.
Selective deletion of DRP1 in POMC neurons alters energy and glucose metabolism
To determine the effect of POMC-selective DRP1 deletion on the animal physiology, we then assessed their metabolic phenotype. Three-months old Drp1fl/fl-POMC-cre male mice fed on a standard chow diet showed an increased body weight due to increased fat mass (Fig. S3A–C) compared to both Drp+/+-POMC-cre and Drp1fl/fl-POMC-cre negative male mice. Since no differences were observed between Drp+/+-POMC-cre and Drp1fl/fl-POMC-cre negative male mice, Drp+/+-POMC-cre male mice were used in all experiments as control mice. While no difference in corticosterone levels was found between the groups (Fig. S1H), a significant increase in circulating leptin levels was observed (Fig. S3D). Similar data were obtained from female mice (Fig. S4A–D). Both in males and females, the obese phenotype was associated with increased food intake (Fig. S3E and Fig. S4E), decreased energy expenditure and locomotor activity (Fig. S3F–H and Fig. S4F–H) and increased respiratory quotient specifically in female mice (Fig. S4I). Significant decreases in markers of BAT thermogenesis were also observed in both male and female Drp1fl/fl-POMC-cre mice compared to controls (Fig. S3J–K and Fig. S4J–K). In agreement with the observed phenotype, Drp1fl/fl-POMC-cre mice showed glucose intolerance (Fig. S3L and Fig. S4L) and insulin resistance (Fig. S3M and Fig. S4M).
Altogether these data suggest that deletion of DRP1 during development has significant effects on POMC neuronal integrity, which in turn, underpinned the altered adult metabolic phenotype of these animals. However, these results do not address the role of mitochondrial fission in the adult functioning of POMC neurons.
Inducible deletion of DRP1 in POMC neurons does not affect POMC expression
To bypass the developmental phase, we then generated mice with selective deletion of DRP1 in POMC neurons using a tamoxifen-inducible POMC-cre mouse model (POMC-cre:ERT2; (Berglund et al., 2013), that allows temporal control of cre recombinase activity. DRP1+/+-POMC-cre:ERT2, used as control, and DRP1fl/fl-POMC-cre:ERT2 mice were injected with tamoxifen (ip, 0.1 mg/g BW daily for 5 days) starting at 5 weeks of age, to induce POMC neurons mature-onset loss of DRP1 in Drp1fl/fl-POMC-cre:ERT2 mice (Padilla et al., 2010; Fig. S5A). To validate our model, we analyzed and found no DRP1 expression in the ARC of 3-months old conditional knockout animals compared to controls by immunohistochemistry (Fig. S5B and C). In addition, no pDRP1 staining was observed in Drp1fl/fl-POMC-cre:ERT2 mice (Fig. S5D–F). Further analyses of the mouse model also showed no differences in POMC cell counts (Fig. S5G–I) or their projection fields in several hypothalamic and extra-hypothalamic targets, including the hypothalamic paraventricular nucleus (PVN; Fig. S5J–L). In addition, over 95% of tdTomato-positive neurons were found to be POMC labeled (Fig. S5M–O). No difference in hypothalamic (Fig. S5P) and pituitary (Fig. S5Q) POMC mRNA and circulating corticosterone levels (Fig. S5R) were found between the 2 experimental groups.
Inducible deletion of DRP1 in POMC neurons increases POMC mitochondrial size, ROS content and neuronal activation in response to glucose
To assess the intracellular effects of DRP1 deletion in POMC, first we studied mitochondrial morphology. Compared to control animals, Drp1fl/fl-POMC-cre:ERT2 mice showed a significant increase in the average mitochondrial size (Fig. 2A–C) paralleled by a decrease in the aspect ratio (Fig. 2D) in POMC neurons, while no changes in mitochondrial density (Fig. 2E) and coverage (Fig. 2F) were observed. In response to a glucose load, increased ROS levels in POMC neurons were found in Drp1fl/fl-POMC-cre:ERT2 mice compared to controls (Fig. 3A–B). Because increased ROS levels were shown to increase POMC neuronal activation (Diano et al., 2011; Long et al., 2014), we then assessed c-fos immunolabeling in POMC neurons after a glucose load. Compared to controls, Drp1fl/fl-POMC-cre:ERT2 mice showed an increase in c-fos immunoreactivity in POMC neurons 1 hour after the glucose load (Fig. 3C–G). In support of the cfos data, electrophysiological recordings showed that while 45% of POMC neurons in control mice were responsive to changes in glucose levels (5 POMC neurons out of 11 cells; n=8 mice; Fig. 3H), in Drp1fl/fl-POMC-cre:ERT2 mice 83% of POMC cells were responsive (10 POMC neurons out of 12 cells; n=8 mice; Fig. 3H). Furthermore, POMC neurons of Drp1fl/fl-POMC-cre:ERT2 mice had a greater membrane potential compared to controls (Fig. 3I) and, they showed a stronger inhibitory response to decreased glucose levels compared to control mice (Fig. 3J and K). Potassium ATP channels have been shown to play a role in POMC glucose responsiveness (Parton et al., 2007). Next we assessed the RNA expression of Kcnj11. Compared to control animals, Drp1fl/fl-POMC-cre:ERT2 mice had significant higher arcuate Kcnj11 mRNA levels (Fig. 3L).
Figure 2. Inducible deletion of DRP1 in POMC neurons affects mitochondrial morphology.
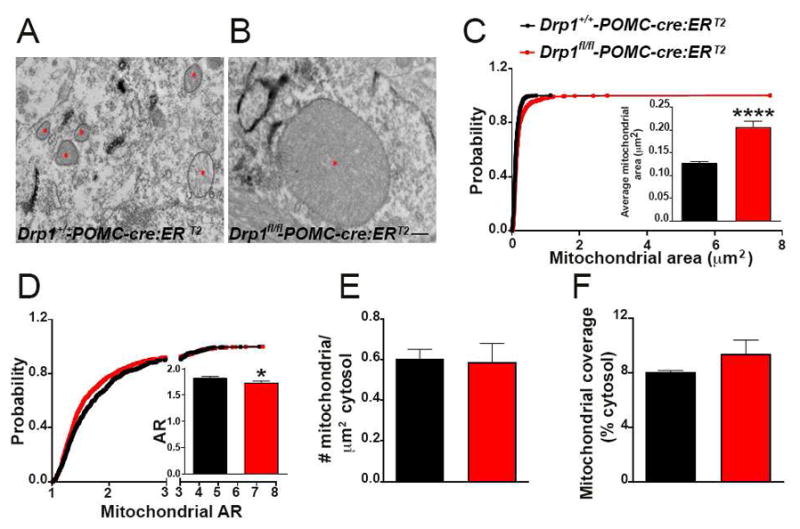
(A and B) Representative electron micrographs showing mitochondria (asterisks) in POMC neurons of a Drp1+/+-POMC-cre:ERT2 (A) and a Drp1fl/fl-POMC-cre:ERT2 mouse (B).
(C–F) Cumulative probability distribution of cross-sectional mitochondrial area and average mitochondrial area (C), cumulative probability distribution of mitochondrial aspect ratio and aspect ratio (D), mitochondrial density (E), and mitochondrial coverage (F) in POMC neurons from Drp1+/+-POMC-cre:ERT2 (n = 725 mitochondria/15 cells/3 mice) and Drp1fl/fl-POMC-cre:ERT2 mice (n =810 mitochondria/20 cells/4 mice).
Bar scale in B (for A) represents 500 nm. Data are represented as mean ± SEM. *=P<0.05; ****=P<0.0001.
Figure 3. Inducible deletion of DRP1 in POMC neurons increases POMC glucose sensing.

(A) Representative micrographs showing fluorescent DHE (red) in POMC neurons (green) of a Drp1fl/fl-POMC-cre:ERT2 mouse injected with vehicle and a Drp1fl/fl-POMC-cre:ERT2 mouse injected with tamoxifen 1h after ip glucose administration.
(B) Quantification of DHE particles number in POMC neurons of Drp1fl/fl-POMC-cre:ERT2 mouse injected with vehicle and a Drp1fl/fl-POMC-cre:ERT2 mouse injected with tamoxifen (n=5 per group) 1h after glucose load.
(C–F) Representative micrographs showing double immunostaining for cfos (green) and tdTomato (red, representing POMC) of saline (C and E) or glucose (D and F) injected Drp1+/+-POMC-cre:ERT2 (n=5 per group) and Drp1fl/fl-POMC-cre:ERT2 mice (n= 5 per group).
(G) Quantification of cfos expression in POMC neurons of saline or glucose injected Drp1+/+-POMC-cre:ERT2 (n= 5 per group) and Drp1fl/fl-POMC-cre:ERT2 mice (n= 5 per group).
(H) Graph showing the percent of glucose responsive POMC neurons of the arcuate nucleus of the hypothalamus in Drp1+/+-POMC-cre:ERT2 (5 POMC neurons out of 11 cells; n=8 mice) and Drp1fl/fl-POMC-cre:ERT2 mice (10 POMC neurons out of 12 cells; n=8 mice).
(I) Graph showing the resting membrane potential in POMC neurons of Drp1+/+-POMC-cre:ERT2 (n=6 mice) and Drp1fl/fl-POMC-cre:ERT2 mice (n=7 mice).
(J) Representative tracers from POMC neurons of a Drp1+/+-POMC-cre:ERT2 and a Drp1fl/fl-POMC-cre:ERT2 mouse showing their responses to changes in glucose concentrations.
(K) Graph showing the percent change of firing rate of POMC neurons at different glucose concentrations. n = 11 cells/8 control mice; n = 12 cells/8 Drp1fl/fl-POMC-cre:ERT2 mice.
(L) Graph showing Kcnj11 mRNA levels in the arcuate nucleus of Drp1+/+-POMC-cre:ERT2 (n=6) and Drp1fl/fl-POMC-cre:ERT2 (n=7) mice.
Scale bar in A (upper right panel) represents 25 μm for all panels. Scale bar in D (for C, E, and F) represents 100 μm. Data are represented as mean ± SEM. *=P<0.05; **=P<0.01; ***=P<0.001.
Together these results revealed that inhibition of mitochondrial fission in POMC neurons enhances their glucose responsiveness.
Inducible deletion of DRP1 in POMC neurons improves peripheral glucose metabolism
Next we assessed the metabolic phenotype of DRP1fl/fl-POMC-cre:ERT2 mice and their controls. Contrary to Drp1fl/fl–POMC-cre mice, no differences in body weight, fat or lean mass contents were observed between Drp1fl/fl-POMC-cre:ERT2 mice and controls consisting of Drp1+/+-POMC-cre:ERT2 injected with tamoxifen and Drp1fl/fl-POMC-cre:ERT2 injected with vehicle, up to 3 months of age (Fig. 4A–C). Because no differences were observed in the 2 control groups, animals were then grouped together in all experiments that did not require POMC visualization by tdTomato. In that case, only Drp1+/+-POMC-cre:ERT2 mice injected with tamoxifen were used as control.
Figure 4. Inducible deletion of DRP1 in POMC neurons improves glucose metabolism and leptin sensitivity.

(A–C) Graphs showing body weight (A), fat mass (B) and lean mass (C) of 3 months old male Drp1+/+-POMC-cre:ERT2 mice injected with tamoxifen, Drp1fl/fl-POMC-cre:ERT2 mice injected with vehicle and Drp1fl/fl-POMC-cre:ERT2 mice injected with tamoxifen (n=10 per group).
(D) Graph showing improved glucose tolerance in 3 months old male Drp1+/+-POMC-cre:ERT2 mice injected with tamoxifen (n=7), Drp1fl/fl-POMC-cre:ERT2 mice injected with vehicle (n=7) and Drp1fl/fl-POMC-cre:ERT2 mice injected with tamoxifen (n=18).
(E and F) Graph showing circulating insulin (E) and glucagon (F) levels during glucose tolerant test in controls (Drp1+/+-POMC-cre:ERT2 mice injected with tamoxifen and Drp1fl/fl-POMC-cre:ERT2 mice injected with vehicle; n=6 total) and Drp1fl/fl-POMC-cre:ERT2 mice (n=7).
(G) Graph showing food intake in control mice (Drp1+/+-POMC-cre:ERT2 mice injected with tamoxifen and Drp1fl/fl-POMC-cre:ERT2 mice injected with vehicle; n=8) and Drp1fl/fl-POMC-cre:ERT2 mice (n=6) after leptin administration.
(H) Representative micrographs showing double immunostaining for cfos (green) and tdTomato (red, representing POMC) of Drp1+/+-POMC-cre:ERT2 (n=5) and Drp1fl/fl-POMC-cre:ERT2 mice (n= 5) 1h after leptin administration.
(I) Quantification of cfos expression in POMC neurons of leptin injected Drp1+/+-POMC-cre:ERT2 (n=5) and Drp1fl/fl-POMC-cre:ERT2 mice (n= 5).
(J) Representative micrographs showing double immunostaining for pSTAT3 (green) and tdTomato (red, representing POMC) of Drp1+/+-POMC-cre:ERT2 (n=5) and Drp1fl/fl-POMC-cre:ERT2 mice (n= 5) 1h after leptin administration.
(K) Quantification of pSTAT3 expression in POMC neurons of leptin injected Drp1+/+-POMC-cre:ERT2 (n= 5) and Drp1fl/fl-POMC-cre:ERT2 mice (n= 5).
Scale bar in H and J (lower right panel) represents 100 μm (for all panels). Data are represented as mean ± SEM. *=P<0.05; **=P<0.01; ****=P<0.0001.
No difference in leptin levels was observed in either females (3.86±0.38 ng/ml in controls versus 3.55±0.65 ng/ml in Drp1fl/fl-POMC-cre:ERT2 mice; n=9 and 10 mice, respectively) or males (4.43±0.87 ng/ml in controls versus 4.50±0.79 ng/ml in Drp1fl/fl-POMC-cre:ERT2 mice; n=8 and 9 mice, respectively).
Since selective and inducible DRP1 deletion in POMC neurons showed a significant change in their glucose responsiveness (see Fig. 3), we then performed a glucose tolerance test. A significant improvement in glucose tolerance was observed in Drp1fl/fl-POMC-cre:ERT2 mice compared to controls (Fig. 4D). While no difference in circulating insulin levels was found during the GTT (Fig. 4E), a significant decrease in glucagon levels was found in Drp1fl/fl-POMC-cre:ERT2 mice compared to their controls (Fig. 4F).
Inducible deletion of DRP1 in POMC neurons increases leptin sensitivity by enhancing POMC neuronal activation by leptin
We then assessed whether Drp1fl/fl-POMC-cre:ERT2 mice were also more responsive to other circulating signals, such as leptin. Leptin administration at the beginning of the dark cycle induced a significant decrease in food intake in Drp1fl/fl-POMC-cre:ERT2 mice compared to controls (Fig. 4G). In agreement with this, one hour after leptin injection, significant increases of cfos (Fig. 4H and I) and pSTAT3 staining (Fig. 4J and K) were observed in the POMC neurons of Drp1fl/fl-POMC-cre:ERT2 mice compared to controls.
Inducible deletion of DRP1 decreases POMC neuronal activation and increases food intake in response to glucoprivation
POMC electrophysiological recordings showed that selective and inducible DRP1 deletion in POMC neurons induced a stronger inhibition in POMC neurons when glucose levels decline (Fig. 3J–K). To assess POMC neuronal activation in response to glucoprivation, we analyzed c-fos immunolabeling in POMC neurons 45 minutes after 2-deoxyglucose (2DG) administration. A significant decrease in double immunostaining for c-fos and POMC was observed in Drp1fl/fl-POMC-cre:ERT2 mice compared to controls (Fig. 5A–C). This increased POMC inhibition was also associated with a significant increase in food intake in Drp1fl/fl-POMC-cre:ERT2 mice compared to controls after 2DG injection (Fig. 5D).
Figure 5. Inducible deletion of DRP1 in POMC neurons enhances counter-regulatory responses to hypoglycemia.
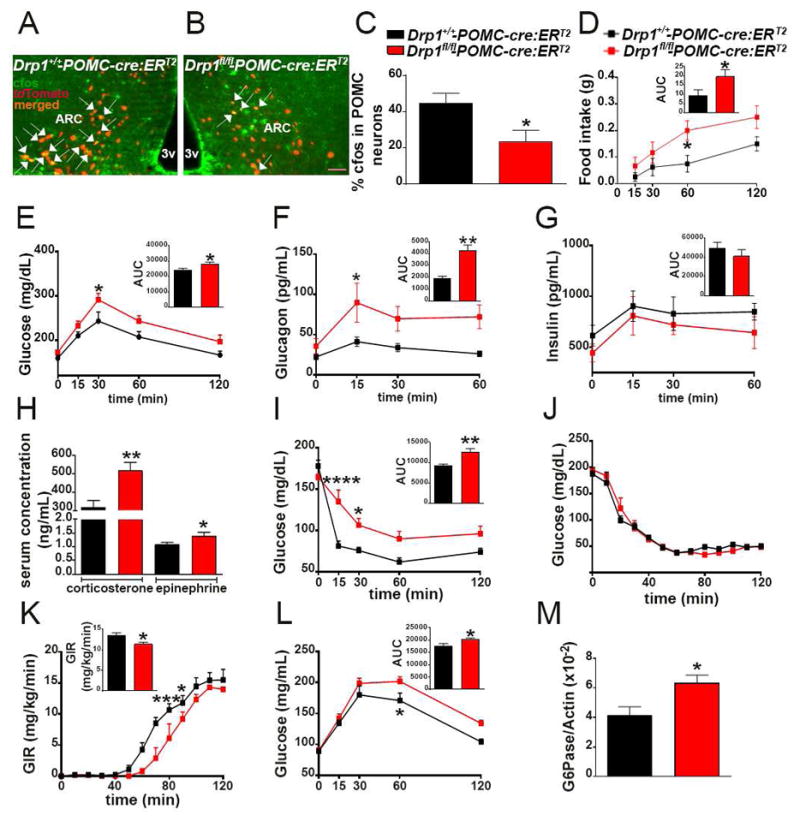
(A and B) Representative micrograph of hypothalamic sections showing double immunostaining for cfos (green) and tdTomato (red, representing POMC) from a Drp1+/+-POMC-cre:ERT2 mouse (A) and a Drp1fl/fl-POMC-cre:ERT2 mouse (B) 45 minutes after 2DG injection (200 mg/kg BW).
(C) Graph showing the percent of POMC neurons immunostained for cfos in Drp1+/+-POMC-cre:ERT2 mice (n=5) and Drp1fl/fl-POMC-cre:ERT2 mice (n=4).
(D) Graph showing the amount of food consumed by Drp1+/+-POMC-cre:ERT2 (n=8) and Drp1fl/fl-POMC-cre:ERT2 mice (n=6) after 2DG administration (200 mg/kg BW).
(E–G) Graphs showing glucose (E), glucagon (F) and insulin (G) levels during a 2DG test in Drp1+/+-POMC-cre:ERT2 (n=9) and Drp1fl/fl-POMC-cre:ERT2 mice (n=7).
(H) Graph showing corticosterone and epinephrine levels in Drp1+/+-POMC-cre:ERT2 (n=9) and Drp1fl/fl-POMC-cre:ERT2 mice (n=7) after 45 minutes from 2DG injection (200 mg/kg BW).
(I) Graph showing the results of insulin-induced hypoglycemia in Drp1+/+-POMC-cre:ERT2 (n=9) and Drp1fl/fl-POMC-cre:ERT2 mice (n=10).
(J and K) Graphs showing the results of hyperinsulemic-hypoglycemic clamp studies in Drp1+/+-POMC-cre:ERT2 (n=7) and Drp1fl/fl-POMC-cre:ERT2 mice (n=8). After glucose levels were clamped (J), glucose infusion rate (K) was measured.
(L) Graph showing glucose levels during pyruvate tolerance test in Drp1+/+-POMC-cre:ERT2 (n=10) and Drp1fl/fl-POMC-cre:ERT2 mice (n=10).
(M) mRNA levels of liver G6Pase in Drp1+/+-POMC-cre:ERT2 (n=7) and Drp1fl/fl-POMC-cre:ERT2 mice (n=6) 45 minutes after 2DG administration.
Scale bar in B (for A) represents 50 μm. Data are represented as mean ± SEM. *=P<0.05; **=P<0.001; ***=P<0.001; ****=P<0.0001.
Inducible deletion of DRP1 in POMC neurons improves counter-regulatory responses to hypoglycemia
To further assess POMC responsiveness to hypoglycemia, we then performed 2DG test with simultaneous measurements of insulin and glucagon levels. Drp1fl/fl-POMC-cre:ERT2 mice showed a stronger response to 2DG test (Fig. 5E), with significant higher glucagon (Fig. 5F) but not insulin (Fig. 5G) levels during the test. Furthermore, Drp1fl/fl-POMC-cre:ERT2 mice showed greater levels of circulating corticosterone and epinephrine (Fig. 5H) compared to control mice 45 minutes after 2DG injection. In agreement with these data, Drp1fl/fl-POMC-cre:ERT2 mice displayed a blunted insulin-induced hypoglycemia (Fig. 5I). To further analyze their response to hypoglycemia, we then performed hyperinsulemic-hypoglycemic clamp study in DRP1fl/fl-POMC-cre:ERT2 mice and their controls (Fig. 5J and K). A significant reduction in glucose infusion rate was required to prevent blood glucose from falling below the clamped level in Drp1fl/fl-POMC-cre:ERT2 mice compared to their controls (Fig. 5K), suggesting an increase in counter-regulatory responses in Drp1fl/fl-POMC-cre:ERT2 mice compared to controls. To determine whether a differential hepatic glucose production was occurring in Drp1fl/fl-POMC-cre:ERT2 mice, pyruvate tolerance test was performed that showed increased circulating glucose levels in Drp1fl/fl-POMC-cre:ERT2 mice compared to controls (Fig. 5L). This was also associated with increased hepatic G6Pase mRNA levels (Fig. 5M), further suggesting that selective and inducible deletion of DRP1 in POMC neurons enhances counter-regulatory responses by elevating counter-regulatory hormone release and hepatic glucose output.
Inducible deletion of DRP1 in POMC neurons affects PPARγ expression levels
We found that inducible deletion of DRP1 in POMC neurons significantly affected POMC ROS levels, neuronal activation and responsiveness to glucose (Fig. 3A–K). Interestingly, we observed that the arcuate mRNA levels of Kcnj11, the gene encoding the Potassium ATP channel, are significantly elevated in Drp1fl/fl-POMC-cre:ERT2 mice compared to controls (Fig. 3L). Since we have previously shown (Diano et al., 2011; Long et al., 2014) that the activation and mRNA levels of the nuclear receptor Peroxisome proliferator-activated receptor gamma (PPARγ) are associated with POMC ROS levels and neuronal activation, next, we assessed whether PPARγ was altered in our animal model. Compared to control mice, Drp1fl/fl-POMC-cre:ERT2 mice showed a significant increase of PPARγ protein levels in punches of the hypothalamic arcuate nucleus (Fig. 6A and B).
Figure 6. Inducible deletion of DRP1 in POMC neurons alters PPARγ expression and PPARγ modulation affects 2DG-induced hypoglycemia and Kcnj11 mRNA levels.

(A) Representative Western Blot images for PPARγ and β-actin in arcuate punches of Drp1+/+-POMC-cre:ERT2 and Drp1fl/fl-POMC-cre:ERT2 mice.
(B) Graph showing densitometry results for PPARγ in arcuate punches of Drp1+/+-POMC-cre:ERT2 (n=5) and Drp1fl/fl-POMC-cre:ERT2 mice (n=5).
(C) Graph showing changes in glucose levels after 2DG injection given 45 minutes after either GW9662 (icv, 1μg/μl) or vehicle (same volume) in Drp1+/+-POMC-cre:ERT2 (n=12 mice with vehicle; n=7 mice with GW9662) and Drp1fl/fl-POMC-cre:ERT2 mice (n=9 mice with vehicle; n=9 mice with GW9662).
(D) Graph showing the results of the area under the curve (AUC) of the 2DG test shown in C.
(E) Graph showing changes in glucose levels after 2DG injection given 45 minutes after either rosiglitazone (icv, 1μg/μl) or vehicle (same volume) in Drp1+/+-POMC-cre:ERT2 (n=6 mice for both vehicle and rosiglitazone) and Drp1fl/fl-POMC-cre:ERT2 mice (n=6 mice for both vehicle and rosiglitazone).
(F) Graph showing the results of the area under the curve (AUC) of the 2DG test shown in E.
(G) Graph showing Kcnj11 mRNA levels in arcuate punches of Drp1+/+-POMC-cre:ERT2 mice 45 minutes after icv injection of either vehicle or rosiglitazone (n=4 mice per group), and Drp1fl/fl-POMC-cre:ERT2 mice 45 minutes after icv injection of either vehicle or GW9662 (n=4 mice per group).
Data are represented as mean ± SEM. *=P<0.05; **=P<0.001; ***=P<0.001; ****=P<0.0001.
Activation or inhibition of PPARγ affects 2DG-induced hypoglycemia and Kcnj11 mRNA levels
To further determine the role of PPARγ, we then studied the effects of intracerebroventricular (icv) administration of either Rosiglitazone, a PPARγ agonist, or GW9662, a non-selective PPARγ antagonist, on 2DG-induced hypoglycemia in Drp1fl/fl-POMC-cre:ERT2 and control mice. While icv injection of GW9662 forty-five minutes before ip administration of 2DG showed no significant effects compared to vehicle injection in control mice (Fig. 6C and D), icv GW9662 administration in Drp1fl/fl-POMC-cre:ERT2 mice significantly impaired their response to hypoglycemia by lowering glucose to levels similar to those of control mice injected with either GW9662 or vehicle (Fig. 6C and D).
Consistently, when rosiglitazone was icv administered 45 minutes before ip 2DG, a significant increase in glucose levels in response to hypoglycemia was observed in control mice compared to vehicle-injected controls (Fig. 6E and F). Rosiglitazone-treated control mice showed glucose levels comparable to those of Drp1fl/fl-POMC-cre:ERT2 mice injected with vehicle after 2DG administration (Fig. 6E and F). No changes in glucose levels were found in Drp1fl/fl-POMC-cre:ERT2 mice treated either with vehicle or rosiglitazone (Fig. 6E and F).
To assess whether administration of rosiglitazone in control mice or GW9662 in Drp1fl/fl-POMC-cre:ERT2 mice had any effects on Kcnj11 mRNA levels in arcuate punches, we performed Real-Time PCR (Fig. 6G). In agreement with the changes in glucose levels observed after 2DG administration, rosiglitazone significantly increased arcuate Kcnj11 mRNA in control mice compared to controls injected with vehicle (Fig. 6G), whereas GW9662 injection significantly decreased arcuate Kcnj11 mRNA in Drp1fl/fl-POMC-cre:ERT2 mice compared to vehicle-injected Drp1fl/fl-POMC-cre:ERT2 mice (Fig. 6G). Altogether, these data suggest that deletion of DRP1 in POMC neurons, by increasing PPARγ levels, alters KATP channels, which in turn, affects POMC neuronal responsiveness to metabolic shifts.
Discussion
Our findings revealed a critical role for mitochondrial fission in the regulation of POMC neuronal responsiveness to glucose. First, we showed that phosphorylated dynamin-related protein 1 (active form; pDRP1), a GTPase that regulates mitochondrial fission, is significantly decreased in POMC neurons of fed compared to fasted animals. In agreement with this, mitochondrial analyses revealed that activated POMC neurons in fed animals have increased mitochondrial size and aspect ratio compared to POMC neurons of fasted animals, suggesting that mitochondrial fusion may be a required process for POMC neuronal activation as implied by previous work (Schneeberger et al., 2013). To delineate the role of DRP1 in POMC neurons, we then generated mice with selective deletion of DRP1 in POMC cells (Drp1fl/fl-POMC-cre). In these mice, DRP1 deletion strongly affected POMC neuronal development and integrity as shown by the significant reduction in arcuate POMC expression, neuronal density and projections. Drp1fl/fl-POMC-cre mice showed alterations in their metabolic phenotype displaying increased body weight and fat mass that was associated with increased food intake and decreased energy expenditure and locomotor activity. An impaired glucose metabolism was also observed. Strikingly, this phenotype quasi phenocopied that of mice in which the fusion-driver Mfn2 was knocked out throughout development (Schneebereger et al., 2013). These observations argue that mitochondrial fission and fusion mechanisms are critically involved in the proper development of the POMC neuronal circuitry.
However, when the activity of the Cre recombinase was temporally controlled and DRP1 deleted in mature POMC neurons, a differential phenotype was observed. No differences in body weight and composition were found in Drp1fl/fl-POMC-cre:ERT2 mice compared to their controls. At the cellular level, no changes in POMC expression and POMC neuronal number in the arcuate nucleus were found between the two experimental groups. However, an increase in leptin sensitivity and glucose responsiveness were observed in Drp1fl/fl-POMC-cre:ERT2 mice compared to controls. These enhanced sensitivities were combined with increased POMC neuronal activation both by cfos immunostaining and electrophysiological recordings that was associated with an increase in arcuate KATP mRNA levels. In addition, an increased mitochondrial size and elevated ROS levels were found in POMC neurons of Drp1fl/fl-POMC-cre:ERT2 mice compared to controls. As results their response to recombinant leptin on feeding was vastly impaired. In addition to improved leptin sensitivity, selective and inducible deletion of DRP1 in POMC neurons improved glucose metabolism in response to either a glucose load or in response to hypoglycemia by inducing a greater activation of counter-regulatory responses. In both glycemic conditions, changes in glucagon levels and hepatic output were observed. Since we have previously shown that changes in POMC ROS levels are associated with changes in hypothalamic PPARγ (Diano et al., 2011; Long et al., 2014), we then assessed whether deletion of DRP1 by affecting ROS levels may affect PPARγ in Drp1fl/fl-POMC-cre:ERT2 mice. A significant upregulation of PPARγ protein levels was observed in the arcuate punches of Drp1fl/fl-POMC-cre:ERT2 mice compared to controls. Furthermore, central inhibition or activation of PPARγ affected the response of Drp1fl/fl-POMC-cre:ERT2 and control mice, respectively, to 2DG-induced hypoglycemia. This was associated with significant changes of Kcnj11 mRNA levels in the arcuate nucleus of control and Drp1fl/fl-POMC-cre:ERT2 mice treated with either rosiglitazone or GW9662, respectively. Overall, these findings provide evidence for a role of DRP1-mediated mitochondrial fission in adult POMC nutrient-sensing. In addition, our studies highlight the notion that germ-line deletion of molecules in control of mitochondrial fission unmasks a critical role for mitochondrial dynamics in neuronal development, but this approach does not reveal how these processes play roles in adult neuronal functioning and related physiological processes.
Mitochondrial fission and fusion are highly regulated processes in which mitochondria continuously fuse and divide to adapt their morphology and number to the environmental conditions. In mammals, mitochondrial fusion is mediated by mitofusin 1 and 2 and OPA1, that are located in the outer and inner membranes, respectively. On the other hand, mitochondrial fission is mediated by DRP1, which is located in the cytosol and when activated, it is recruited to the mitochondrial surface to induce the fission of the mitochondrial membranes (Lackner and Nunnari, 2009; Yoon and McNiven, 2001). Mutations in any of these proteins in humans have shown to induce neurological disorders and neurodevelopmental abnormalities (Alexander et al., 2000; Delettre et al., 2000; Waterham et al., 2007; Zuchner et al., 2004). More recently, alterations in mitochondrial fission or fusion have been associated with metabolic disorders such as type 2 diabetes and obesity (Dietrich et al., 2013; Nasrallah and Horvath, 2014; Schneeberger et al., 2013; Toda et al., 2016). Thus, understanding the physiological and cellular functions of mitochondrial dynamics in mammals is of critical importance to gain insights on the pathogenesis of diseases, including metabolic disorders.
DRP1 deletion during brain development has been shown to negatively affect neuronal proliferation (Ishihara et al., 2009; Wakabayashi et al., 2009). Similarly, we have found that DRP1 deletion in POMC neurons during embryogenesis affects their development as significant reductions in POMC expression, number and projections were found in Drp1fl/fl-POMC-cre mice, thus suggesting that POMC neuronal development strongly depends on mitochondrial fission. Therefore, to understand the role of mitochondrial fission in mature POMC neurons, mice were generated in which the temporal control of Cre recombinase activity allowed the selective deletion of DRP1 in mature POMC neurons. Similar to previous reports, we found that selective and inducible DRP1 deletion in POMC neurons induced increased mitochondrial size as well as the formation of large spheres together with an increase in content of reactive oxygen species (ROS) in POMC neurons. While increased ROS levels may have detrimental effects in several neuronal cell types (Kim et al., 2015), POMC neuronal activation is driven by a rise in ROS levels (Diano et al., 2011; Long et al., 2014). Indeed, a significant increase in POMC neuronal activation was found in Drp1fl/fl-POMC-cre:ERT2 mice compared to their controls that was associated with increased PPARγ and KATP channel expression levels. In association with these cellular changes, Drp1fl/fl-POMC-cre:ERT2 mice showed increased leptin sensitivity and increased glucose sensing to both hyperglycemia and hypoglycemia. Indeed, central rosiglitazone injection to controls significantly improved while central GW9662 injection to Drp1fl/fl-POMC-cre:ERT2 mice significantly impaired glucose metabolism in response to 2DG-induced hypoglycemia. In support of a role for PPARγ in improving counter-regulatory responses to hypoglycemia, PPARγ agonists have been shown to amplify counter-regulatory responses to hypoglycemia in non-diabetic subjects (Gabriely et al., 2000)
As different cell types have diverse mitochondrial number and morphology, it is conceivable that the role of mitochondrial fission and fusion in specific cell types may differentially regulate various cell types. This may be the case for glucose-sensing POMC neurons in the hypothalamic arcuate nucleus and the glucose-sensing hypothalamic ventromedial (VMH) neurons. While in this study we have found that increased glucose levels, such as in fed state, reduced DRP1 activation in glucose-excited POMC neurons, our recent study in VMH glucose-excited neurons (Toda et al., 2016) showed that increased glucose levels activate DRP1 and, this mechanism plays a role in the ability of these neurons to properly respond to a glucose load.
In summary, our studies revealed that DRP1-mediated mitochondrial fission plays a negative role in POMC neuronal responses to glucose and leptin sensitivity, which further elaborate on the role of mitochondria in central control of homeostasis (Horvath et al., 1999).
Experimental procedures
Animals
All animal work was approved by the Yale University Institutional Animal Care and Use Committee. Mice were housed at 22°C–24°C with a 12 hr light/12 hr dark cycle with standard chow (Harlan Teklad no. 2018, 18% calories from fat) and water provided ad libitum. All mice studied were on the same background.
Generation of experimental mice with a conditional and/or inducible deletion of Drp1 specifically in POMC neurons
We used the cre/loxP technology to generate mice in which DPR1 was selectively ablated in POMC neurons (POMC Drp1fl/fl). We generated mice by crossing Drp1 floxed mice (Drp1fl/fl; Kageyama et al., 2014) with POMC-cre that express Cre recombinase in exclusively in POMC neurons of the ARC. As control mice, Drp1fl/fl-POMC-cre negative and Drp1+/+-POMC-cre positive littermates were used. All mice studied were on a mixed background (129SvEv, FVB and C57BL/6J).
Tamoxifen-inducible cre:ERT2 (Berglund et al., 2013) mice controlled by Pomc regulatory elements were developed to temporally control cre excision specifically in POMC-expressing neurons. Founder lines with inducible cre activity were screened by injecting 5-week-old cre reporter mice from these lines (R26RtdTomato+[tdTomato] × POMC-cre:ERT2) with a single daily dose of tamoxifen (0.10 mg/g body weight) or vehicle (corn oil) for 5 consecutive days.
The expression of tdTomato in 3-months old mice was detected in nearly all POMC neurons (>95%) in the ARC as well as in a small number of neurons in the brainstem. Recombination was strictly dependent upon tamoxifen treatment, as no cre activity could be detected in the absence of tamoxifen when Drp1fl/fl-POMC-cre:ERT2 were injected with vehicle. Cre activity was also not detected in other regions of the CNS after tamoxifen injections. Cre activated reporter expression was present in the pituitary gland where the Pomc gene was endogenously expressed. As controls, Drp1fl/fl-POMC-cre:ERT2 injected with vehicle and Drp1+/+-POMC-cre:ERT2 injected with tamoxifen were used. However, because there were no differences between these 2 control groups, the majority of the experiments was performed using Drp1+/+-POMC-cre:ERT2 injected with tamoxifen (to visualize POMC neurons via tdTomato expression) unless otherwise specified.
Immunostaining for DRP1 was routinely performed to validate our animal models. Perfused (4% PFA) coronal brain sections (50 μm) were incubated with mouse anti-DRP1 antibody (BD Biosciences #611738, 1:500) for 24 hr at room temperature followed by the secondary antibody (biotinylated goat anti-mouse IgG; 1:250 in PB; Vector Laboratories) and Alexa Fluor 488 avidin (1:2000 in PB; Life Technologies). Immunostaining was visualized using fluorescence microscopy.
Indirect calorimetry system and body composition
Animals were acclimated in metabolic chambers (TSE System-Core Metabolic Phenotyping Center, Yale University) for 3 days before the start of the recordings. Mice were continuously recorded for 2 days, with the following measurements taken every 30 min: food intake, locomotor activity (in the xy- and z-axes), and gas exchange (O2 and CO2; The TSE LabMaster System). Energy expenditure was calculated according to the manufacturer’s guidelines (PhenoMaster Software, TSE System). The respiratory quotient was estimated by calculating the ratio of CO2 production to O2 consumption.
Values were adjusted by body weight to the power of 0.75 (kg–0.75) where mentioned.
Body composition was measured in vivo by MRI (EchoMRI; Echo Medical Systems, Houston, TX).
Measurement of circulating hormones
Serum insulin and glucagon (Bio-Plex Pro Diabetes Assays, BioRad), corticosterone (ab108821, Corticosterone ELISA kit, Abcam), epinephrine (MBS700597, Mouse Epinephrine ELISA Kit, MyBioSource) and leptin (Cat. # EZML-82K, Mouse Leptin ELISA kit, Millipore) were measured following the manufacturer’s protocol.
Glucose, insulin and pyruvate tolerance tests and 2DG test
Glucose (2g/kg BW; Sigma Aldrich), insulin (0.75U/kg; Humulin R; Eli Lilly, Indianapolis, IN), and pyruvate (2g/kg BW sodium pyruvate; Sigma-Aldrich, St. Louis, MO, Cat#P5280) tolerance tests were performed as previously reported (Kim et al., 2014; Long et al., 2014; Toda et al., 2016).
2-Deoxyglucose (2DG) test was performed by ip injection of 200 mg/kg BW 2DG (Sigma-Aldrich, St. Louis, MO).
Surgical procedure for clamp studies
Hyperinsulemic-hypoglycemic clamps were performed under conscious and unrestrained condition in control and conditional knock-out mice (Flak et al., 2014). Under deep anesthesia, polyethylene catheters were inserted into the right carotid arteries and jugular veins of mice. Lines were flushed daily with 50 μl heparinized saline for the 3–5 days recovery period. On the day of the study, insulin (Humulin-R; Lilly, Indianapolis, IN) was infused intravenously at 10 mU•kg−1•min−1 for 120 min, combined with a variable infusion of glucose to maintain target blood glucose levels of ~50 mg/dl (hypoglycemia). Glucose was measured every 10 min in whole arterial blood (5 μl) with a glucose meter (Hemocue, Lake Forest, CA). To replace volume and red cells lost in sampling, heparinized blood cells from donor mice were resuspended in saline and infused intravenously, along with the insulin and glucose, at 6 μl/min. Once the 120-min blood sample was collected, mice were immediately euthanized under deep anesthesia by decapitation.
phospho-DRP1 immunostaining
Ad libitum fed or 12 h fasted mice were perfused with saline following 4% PFA transcardially. Rabbit anti-phospho-DRP1 (Ser616) antibody (Cell signaling, Cat# 4494, 1:1000) and rabbit anti-POMC antibody (Phoenix Pharmacuticals, 1:2000) in PB were used for immunostaining and analyzed with fluorescent microscope as previously reported (Long et al., 2014; Toda et al., 2016).
c-fos immunostaining
After overnight fasting, mice were injected with either saline (same volume than glucose) or glucose (2g/kg, ip) and after 1 h from the injection they were perfused. In another set of experiments, 2h fasted mice were injected with 2DG (200 mg/kg, ip) and after 45 minutes from the injection they were transcardially perfused. Brain sections were then immunostained for cfos (rabbit anti-c-fos antibody; Santacruz, 1:2000). No staining was performed to visualize POMC neurons since mice were expressing in this neuronal population tdTomato which is per se fluorescent. Sections were mounted on glass slide with vectashield (Vector lab) and analyzed with fluorescent microscope.
DHE administration
ROS levels in POMC neurons were measured by injecting dihydroethidium (DHE, 1mg/ml; Invitrogen) through tail vain of Drp1fl/fl-POMC-cre:ERT2 injected with corn oil (as control) or tamoxifen (tdTomato negative) as previously reported (Andrews et al., 2008; Long et al., 2014; Toda et al., 2016). Two hours after the DHE injection, glucose (2g/kg BW) was injected and one hour after the glucose injection, mice were transcardially perfused. Brain sections were then immunostained with anti-rabbit POMC antibody (1:2000, Phoenix Pharmaceuticals).
Fluorescent images of five to seven brain sections were captured with confocal microscope and analyzed by imaging Software (Image J).
Electron Microscopy analysis
Ad libitum fed or 16 h fasted mice were anesthetized and transcardially perfused with 0.9% saline followed by fixative (4% paraformaldehyde, 15% picric acid, 0.1% glutaraldehyde in 0.1 M PB. Brain coronal sections were either immunostained with anti-POMC primary antibodies (1:3000) or double-stained with anti-cfos (1:2000) and anti-POMC primary antibodies (1:7000). Ribbons of serial ultrathin arcuate sections were collected on Formvar-coated single slot grids and examined using a Philips CM-10 electron microscope. Mitochondria morphology in activated (double stained) and non-activated (only POMC stained) POMC neurons in fed and fasted mice was measured as previously reported (Toda et al., 2016).
Leptin sensitivity
Individually housed mice were ip injected with recombinant murine leptin (3 μg/g body weight, Peprotech) just before the dark phase and food intake was measured at 1, 2, 4, 12 and 24 hours after leptin injection. For immunostaining, mice were injected with leptin (3 μg/g body weight, Peprotech) at 9:00 AM and 1 hour later, mice were rapidly perfused, and brains were processed for immunostaining for p-STAT3 (1:250 in 0.1 M PB; Cell Signaling Technology) or c-fos (diluted 1:2,500 in 0.1 M PB; Calbiochem) as previously described (Long et al., 2014; Toda et al., 2016). No staining was performed to visualize POMC neurons since mice were expressing in this neuronal population tdTomato which is per se fluorescent. Sections were mounted with VectaShield antifade (Vector Laboratories) for analysis.
Real-time PCR
Total RNA was extracted using Trizol solution (Invitrogen). A High Capacity cDNA Reverse transcription Kit (Applied Biosystems) was used for the reverse transcription. Real-time PCR (LightCycler 480; Roche) was performed using the following: Mm02619580_g1 for β-actin, Mm00839363_m1 for G6Pase, Mm00515664_m1 for DIO-2, and Mm01244861_m1 for UCP1 (ThermoFisher Scientific). The expression of the Kcnj11 gene, which encodes the Kir6.2 KATP channel subunit, was evaluated in the ARC. The calculations of average Cp values, SDs, and resulting expression ratios for each target gene were based on the Roche LightCycler 480 software.
Electrophysiology
Seven to eight-weeks-old mice were used and the hypothalamic slices were prepared as previously described (Liu et al., 2011; Toda et al., 2016). Perforated patch recording was performed in POMC-Tomato neurons of the ARC under voltage- and current clamp. The membrane and spontaneous action potential were recorded in POMC neurons under current clamp. We recorded action potential firing for 4–8 min at a glucose concentration of 2.5 mM. When firing was stable, glucose concentration was changed to 0.2 mM for 4 minutes before to return to 2.5 mM glucose for 6 minutes. At the end of the perforated patch recordings, the membrane of every cell was ruptured and whole cell patch recording measured to check current-voltage relationship. All data were sampled at 3–10 kHz, filtered at 1–3 kHz and analyzed with an Apple Macintosh computer using AxoGraph X (AxoGraph Scientific). Statistics and plotting were performed with KaleidaGraph (Synergy software) and Igor Pro (WaveMetrics).
The average firing rate was calculated in the last 2 minutes of each glucose concentrations. All the experiments were performed blindly to the electrophysiologist.
Western blot analysis
Protein lysates from hypothalamic ARC punches were prepared by modified RIPA buffer (50 mM Tris-HCl, pH 7.5, 150 mM NaCl, 1mM EDTA, 0.1 mM Na3VO4, 1 mM NaF, 1% TritonX-100, 0.1% SDS, 1 mM phenylmethylsulfonyl fluoride) supplemented with protease inhibitor cocktail (Roche, Cat# 11 836 170 001) on ice for 30 minutes. Protein concentrations were measured using the BCA kit (Thermo scientific, Cat# 23228 and 1859078). Membranes were overnight incubated at 4°C with anti-PPARγ antibody (Santa Cruz Biotechnology, Cat# sc-7273) and developed by ECL kit (Thermo scientific, Cat#2016). Membrane was reused to detect β-actin (Sigma, Cat# A5441) after stripping with RestoreTM PLUS western blot stripping buffer (Thermo scientific, Cat#46430).
Lateral ventricle cannulation
A sterile guide cannula was implanted into the lateral brain ventricle (0.3 mm posterior and 1 mm lateral relative to bregma, and 3 mm below the surface of the skull) as previously described (Diano et al., 2011).
PPARγ agonist (rosiglitazone; Enzo Life Sciences Inc., Farmingdale, NY, USA) and antagonist GW9662 (2-chloro-5-nitrobenzanilide; Cayman Chemical Company) were dissolved in dimethyl sulfoxide (DMSO) at 10 μg/mL concentration. This stock solution was then diluted 1:10 in saline in order to inject 1 μg of rosiglitazone or GW9662 in 1 μl of vehicle. In both experiments, mice injected with the same volume of vehicle (DMSO in saline ratio 1:10) were used as control.
2h fasted animals were i.c.v. injected with vehicle, rosiglitazone or GW9662, and 45 minutes after their administration, 2DG test (200 mg/kg, ip) was performed as described above. Mice were killed 45 minutes after i.c.v. injections, and the ARC was collected to measure the expression of Kcjn11 mRNA through Real Time PCR as described above.
Statistical analysis
All analyses were performed blinded to the individual performing the experiment and analysis. Two-way ANOVA was used to determine the effect of the genotype and treatment with the Prism 7.0 software (GraphPad Software, San Diego, CA).
For repeated-measures analysis, ANOVA was used when values over different times were analyzed. Significant effects were evaluated followed with Fisher’s protected least significant difference post hoc test with Tukey or Bonferroni’s correction. When only two groups were analyzed, statistical significance was determined by unpaired Student t-test. A value of P < 0.05 was considered statistically significant. All data are shown as means ± SEM.
Supplementary Material
Acknowledgments
The authors thank Ashley Kristant, Arielle Landau, Xiao-Bing Gao, Chitoku Toda, Giuseppe Bruschetta and Klara Szigeti-Buck for their technical assistance. Anna Santoro and Michela Campolo were partially supported by fellowships from the Italian Society of Pharmacology (SIF). This work was supported by the National Institute of Health R01 DK097566, DK105571 and DK107293 (to S.D.).
Footnotes
Author contributions
A.S., M.C., J.D.K., and Z-W.L. conducted the experiments, A.S., M.C., R.M., J.D.K., Z-W.L., and S.D. analyzed the data, C.L. and S.H. provided key animal models, S.D. conceived the study, designed the experiments and wrote the manuscript.
Publisher's Disclaimer: This is a PDF file of an unedited manuscript that has been accepted for publication. As a service to our customers we are providing this early version of the manuscript. The manuscript will undergo copyediting, typesetting, and review of the resulting proof before it is published in its final citable form. Please note that during the production process errors may be discovered which could affect the content, and all legal disclaimers that apply to the journal pertain.
References
- Alexander C, Votruba M, Pesch UE, Thiselton DL, Mayer S, Moore A, Rodriguez M, Kellner U, Leo-Kottler B, Auburger G, et al. OPA1, encoding a dynamin-related GTPase, is mutated in autosomal dominant optic atrophy linked to chromosome 3q28. Nat Genet. 2000;26:211–215. doi: 10.1038/79944. [DOI] [PubMed] [Google Scholar]
- Andrews ZB, Liu ZW, Walllingford N, Erion DM, Borok E, Friedman JM, Tschop MH, Shanabrough M, Cline G, Shulman GI, et al. UCP2 mediates ghrelin’s action on NPY/AgRP neurons by lowering free radicals. Nature. 2008;454:846–851. doi: 10.1038/nature07181. [DOI] [PMC free article] [PubMed] [Google Scholar]
- Berglund ED, Liu C, Sohn JW, Liu T, Kim MH, Lee CE, Vianna CR, Williams KW, Xu Y, Elmquist JK. Serotonin 2C receptors in pro-opiomelanocortin neurons regulate energy and glucose homeostasis. J Clin Invest. 2013;123:5061–5070. doi: 10.1172/JCI70338. [DOI] [PMC free article] [PubMed] [Google Scholar]
- Delettre C, Lenaers G, Griffoin JM, Gigarel N, Lorenzo C, Belenguer P, Pelloquin L, Grosgeorge J, Turc-Carel C, Perret E, et al. Nuclear gene OPA1, encoding a mitochondrial dynamin-related protein, is mutated in dominant optic atrophy. Nat Genet. 2000;26:207–210. doi: 10.1038/79936. [DOI] [PubMed] [Google Scholar]
- Diano S. Role of reactive oxygen species in hypothalamic regulation of energy metabolism. Endocrinol Metab (Seoul) 2013;28:3–5. doi: 10.3803/EnM.2013.28.1.3. [DOI] [PMC free article] [PubMed] [Google Scholar]
- Diano S, Liu ZW, Jeong JK, Dietrich MO, Ruan HB, Kim E, Suyama S, Kelly K, Gyengesi E, Arbiser JL, et al. Peroxisome proliferation-associated control of reactive oxygen species sets melanocortin tone and feeding in diet-induced obesity. Nat Med. 2011;17:1121–1127. doi: 10.1038/nm.2421. [DOI] [PMC free article] [PubMed] [Google Scholar]
- Dietrich MO, Liu ZW, Horvath TL. Mitochondrial dynamics controlled by mitofusins regulate Agrp neuronal activity and diet-induced obesity. Cell. 2013;155:188–199. doi: 10.1016/j.cell.2013.09.004. [DOI] [PMC free article] [PubMed] [Google Scholar]
- Flak JN, Patterson CM, Garfield AS, D’Agostino G, Goforth PB, Sutton AK, Malec PA, Wong JM, Germani M, Jones JC, et al. Leptin-inhibited PBN neurons enhance responses to hypoglycemia in negative energy balance. Nat Neurosci. 2014;17:1744–1750. doi: 10.1038/nn.3861. [DOI] [PMC free article] [PubMed] [Google Scholar]
- Gabriely I, Wozniak R, Hawkins M, Shamoon H. Troglitazone amplifies counterregulator responses to hypoglycemia in nondiabetic subjetc. Journal Clinical Endocrinology & Metabolism. 2000;86:521–528. doi: 10.1210/jcem.86.2.7197. [DOI] [PubMed] [Google Scholar]
- Han XJ, Lu YF, Li SA, et al. CaM kinase I alpha-induced phosphorylation of Drp1 regulates mitochondrial morphology. J Cell Biol. 2008;182:573–585. doi: 10.1083/jcb.200802164. [DOI] [PMC free article] [PubMed] [Google Scholar]
- Hoppins S, Nunnari J. Cell biology: mitochondrial dynamics and apoptosis -- the ER connection. Science. 2012;337:1052–1054. doi: 10.1126/science.1224709. [DOI] [PubMed] [Google Scholar]
- Horvath TL, Warden CH, Hajos M, Lombardi A, Goglia F, Diano S. Brain uncoupling protein 2: uncoupled neuronal mitochondria predict thermal synapses in homeostatic centers. J Neurosci. 1999;19(23):10417–27. doi: 10.1523/JNEUROSCI.19-23-10417.1999. [DOI] [PMC free article] [PubMed] [Google Scholar]
- Ishihara N, Nomura M, Jofuku A, Kato H, Suzuki SO, Masuda K, Otera H, Nakanishi Y, Nonaka I, Goto Y, et al. Mitochondrial fission factor Drp1 is essential for embryonic development and synapse formation in mice. Nat Cell Biol. 2009;11:958–966. doi: 10.1038/ncb1907. [DOI] [PubMed] [Google Scholar]
- Kageyama Y, Hoshijima M, Seo K, Bedja D, Sysa-Shah P, Andrabi SA, Chen W, Hoke A, Dawson VL, Dawson TM, et al. Parkin-independent mitophagy requires Drp1 and maintains the integrity of mammalian heart and brain. EMBO J. 2014;33:2798–2813. doi: 10.15252/embj.201488658. [DOI] [PMC free article] [PubMed] [Google Scholar]
- Kim GH, Kim JE, Rhie SJ, Yoon S. The Role of Oxidative Stress in Neurodegenerative Diseases. Exp Neurobiol. 2015;24:325–340. doi: 10.5607/en.2015.24.4.325. [DOI] [PMC free article] [PubMed] [Google Scholar]
- Kim JD, Toda C, D’Agostino G, Zeiss CJ, DiLeone RJ, Elsworth JD, Kibbey RG, Chan O, Harvey BK, Richie CT, et al. Hypothalamic prolyl endopeptidase (PREP) regulates pancreatic insulin and glucagon secretion in mice. Proc Natl Acad Sci U S A. 2014;111:11876–11881. doi: 10.1073/pnas.1406000111. [DOI] [PMC free article] [PubMed] [Google Scholar]
- Lackner LL, Nunnari JM. The molecular mechanism and cellular functions of mitochondrial division. Biochim Biophys Acta. 2009;1792:1138–1144. doi: 10.1016/j.bbadis.2008.11.011. [DOI] [PMC free article] [PubMed] [Google Scholar]
- Liesa M, Palacin M, Zorzano A. Mitochondrial dynamics in mammalian health and disease. Physiol Rev. 2009;89:799–845. doi: 10.1152/physrev.00030.2008. [DOI] [PubMed] [Google Scholar]
- Liu ZW, Gan G, Suyama S, Gao XB. Intracellular energy status regulates activity in hypocretin/orexin neurones: a link between energy and behavioural states. J Physiol. 2011;589:4157–4166. doi: 10.1113/jphysiol.2011.212514. [DOI] [PMC free article] [PubMed] [Google Scholar]
- Long L, Toda C, Jeong JK, Horvath TL, Diano S. PPARgamma ablation sensitizes proopiomelanocortin neurons to leptin during high-fat feeding. J Clin Invest. 2014;124:4017–4027. doi: 10.1172/JCI76220. [DOI] [PMC free article] [PubMed] [Google Scholar]
- Nasrallah CM, Horvath TL. Mitochondrial dynamics in the central regulation of metabolism. Nat Rev Endocrinol. 2014;10:650–658. doi: 10.1038/nrendo.2014.160. [DOI] [PubMed] [Google Scholar]
- Padilla SL, Carmody JS, Zeltser LM. Pomc-expressing progenitors give rise to antagonistic neuronal populations in hypothalamic feeding circuits. Nat Med. 2010;16:403–405. doi: 10.1038/nm.2126. [DOI] [PMC free article] [PubMed] [Google Scholar]
- Parton LE, Ye CP, Coppari R, Enriori PJ, Choi B, Zhang CY, Xu C, Vianna CR, Balthasar N, Lee CE, Elmquist JK, Cowley MA, Lowell BB. Glucose sensing by the POMC neurons regulates glucose homeostasis and is impaired in obesity. Nature. 2007;449(7159):228–32. doi: 10.1038/nature06098. [DOI] [PubMed] [Google Scholar]
- Schneeberger M, Dietrich MO, Sebastian D, Imbernon M, Castano C, Garcia A, Esteban Y, Gonzalez-Franquesa A, Rodriguez IC, Bortolozzi A, et al. Mitofusin 2 in POMC neurons connects ER stress with leptin resistance and energy imbalance. Cell. 2013;155:172–187. doi: 10.1016/j.cell.2013.09.003. [DOI] [PMC free article] [PubMed] [Google Scholar]
- Toda C, Kim JD, Impellizzeri D, Cuzzocrea S, Liu ZW, Diano S. UCP2 Regulates Mitochondrial Fission and Ventromedial Nucleus Control of Glucose Responsiveness. Cell. 2016;164:872–883. doi: 10.1016/j.cell.2016.02.010. [DOI] [PMC free article] [PubMed] [Google Scholar]
- Wakabayashi J, Zhang Z, Wakabayashi N, Tamura Y, Fukaya M, Kensler TW, Iijima M, Sesaki H. The dynamin-related GTPase Drp1 is required for embryonic and brain development in mice. The Journal of cell biology. 2009;186:805–816. doi: 10.1083/jcb.200903065. [DOI] [PMC free article] [PubMed] [Google Scholar]
- Waterham HR, Koster J, van Roermund CW, Mooyer PA, Wanders RJ, Leonard JV. A lethal defect of mitochondrial and peroxisomal fission. N Engl J Med. 2007;356:1736–1741. doi: 10.1056/NEJMoa064436. [DOI] [PubMed] [Google Scholar]
- Wilson TJ, Slupe AM, Strack S. Cell signaling and mitochondrial dynamics: Implications for neuronal function and neurodegenerative disease. Neurobiology of disease. 2013;51:13–26. doi: 10.1016/j.nbd.2012.01.009. [DOI] [PMC free article] [PubMed] [Google Scholar]
- Yoon Y, McNiven MA. Mitochondrial division: New partners in membrane pinching. Curr Biol. 2001;11:R67–70. doi: 10.1016/s0960-9822(01)00011-2. [DOI] [PubMed] [Google Scholar]
- Zhu PP, Patterson A, Stadler J, Seeburg DP, Sheng M, Blackstone C. Intra- and intermolecular domain interactions of the C-terminal GTPase effector domain of the multimeric dynamin-like GTPase Drp1. J Biol Chem. 2004;279:35967–35974. doi: 10.1074/jbc.M404105200. [DOI] [PubMed] [Google Scholar]
- Zuchner S, Mersiyanova IV, Muglia M, Bissar-Tadmouri N, Rochelle J, Dadali EL, Zappia M, Nelis E, Patitucci A, Senderek J, et al. Mutations in the mitochondrial GTPase mitofusin 2 cause Charcot-Marie-Tooth neuropathy type 2A. Nat Genet. 2004;36:449–451. doi: 10.1038/ng1341. [DOI] [PubMed] [Google Scholar]
Associated Data
This section collects any data citations, data availability statements, or supplementary materials included in this article.