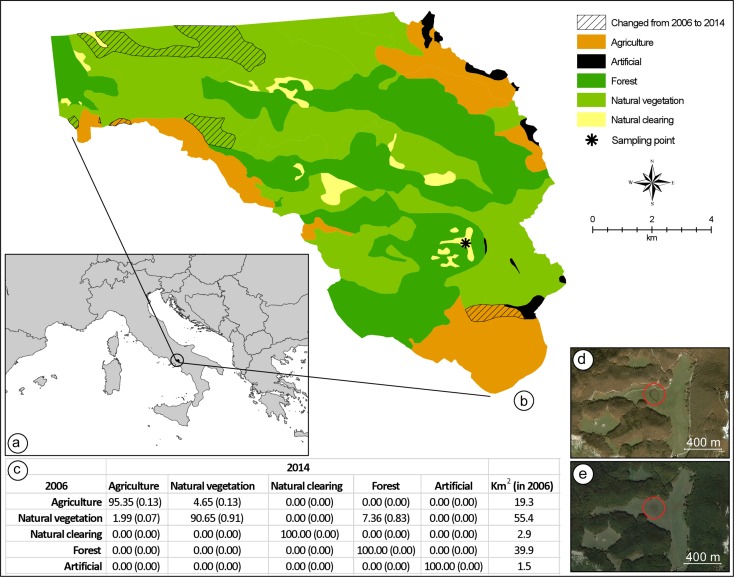
Figure 2. Land-use change detection analysis.
(A) Location of the study area in Italy. (B) Map of the land-use in 2006, as obtained from direct interpretation of an aerial photo collected on 31 October 2006; in the same map, the exact location where the hybridisation event has been registered is indicated, as well as all areas where land-use was different when compared to a second aerial photo collected on 9 October 2014. Both aerial photos were obtained from Google Earth Pro 7.1.5.1557 (Google Inc., Mountain View, CA, USA). (C) Average percent change (range of percent change in parenthesis) in land-use classes from 2006 to 2014; total square kilometre area for each land-cover class in 2006 is provided in the last column. Aerial photos of the breeding site and its neighbourhoods collected on 31 October 2006 (D), and 9 October 2014 (E).

