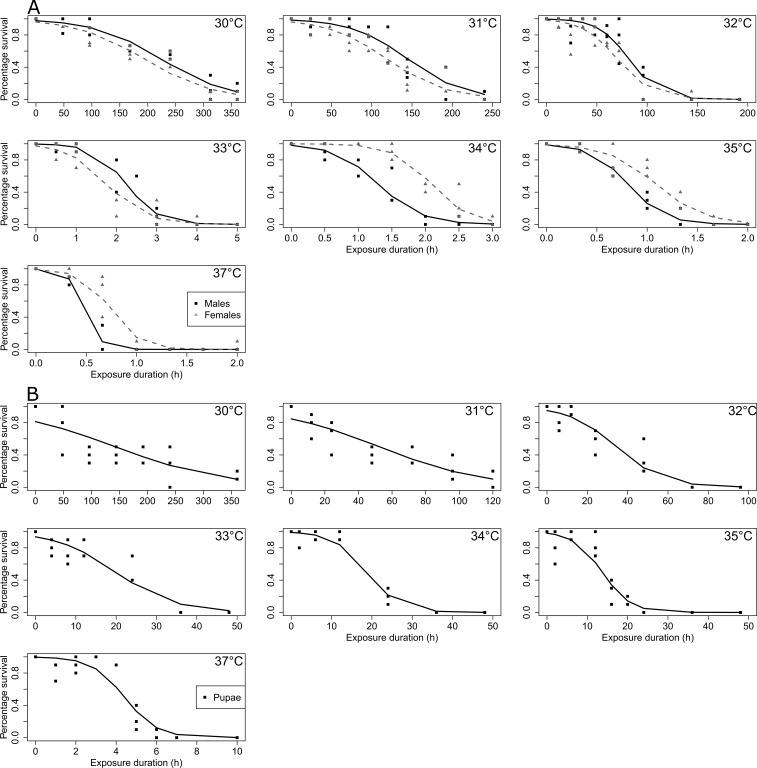
Figure 3. SWD survival as a function of high temperature and duration exposure.
(A) adults; (B) pupae. Points correspond to observed data, and lines to GLM predictions. In (A), black solid lines correspond to male’s predictions, and grey dashed lines to female’s predictions. In (B), black solid lines correspond to pupae’s predictions. The tested temperatures are indicated in the left top corner of each plot.

