

Abstract
Purpose
To use contrast based on longitudinal relaxation times (T1) or rates (R1) to quantify the biodistribution of iron oxide nanoparticles (IONPs), which are of interest for hyperthermia therapy, cell targeting, and drug delivery, within primary clearance organs.
Methods
Mesoporous silica-coated IONPs (msIONPs) were intravenously injected into 15 naïve mice. Imaging and mapping of the longitudinal relaxation rate constant at 24 hours or 1 week post-injection were performed with an echoless pulse sequence (SWIFT). Alternating magnetic field heating measurements were also performed on ex vivo tissues.
Results
Signal enhancement from positive T1 contrast caused by IONPs was observed and quantified in vivo in liver, spleen, and kidney at concentrations up to 3.2 mg Fe/(g tissue wt.) (61 mM Fe). In most cases, each organ had a linear correlation between the R1 and the tissue iron concentration despite variations in intra-organ distribution, degradation, and IONP surface charge. Linear correlation between R1 and volumetric SAR in hyperthermia therapy was observed.
Conclusion
The linear dependence between R1 and tissue iron concentration in major organs allows quantitative monitoring of IONP biodistribution in a dosage range relevant to magnetic hyperthermia applications, which falls into the concentration gap between CT and conventional MRI techniques.
Keywords: Iron oxide nanoparticle, Biodistribution, primary clearance organs, SWIFT, hyperthermia
Introduction
Magnetic iron oxide nanoparticles (IONPs) are receiving increased attention based on their potential for providing MRI contrast, hyperthermia therapy, cell targeting, and drug delivery through appropriate coating (1–5). X-ray computed tomography (CT) is used for IONP quantification for magnetic nanoparticle hyperthermia clinically in Europe; however, CT relies on small changes in bulk density and is only practical at high concentrations (> 5 mg Fe/mL (89 mM Fe)) (6). Conventional MRI can localize IONPs with negative contrast, but can only be used for quantification at very low concentrations (7). This leaves a gap in the detectable IONP concentration range (0.1 to 10 mg Fe/mL (~ 2 to 200 mM)) where neither CT nor conventional MRI has a sufficient sensitivity for quantification (6).
Clinically used IONP-based MR contrast agents, such as FDA-approved Resovist, take advantage of negative contrast produced by the IONPs (4). The majority of MRI pulse sequences produce contrast by exploiting the transverse (T2* and T2) relaxation shortening properties of IONPs. Quantification of transverse relaxation usually requires working with low IONP concentrations where T2* or T2 is long enough to be imaged (7). The relevant IONP concentrations for theranostic applications in cancer, which aim to combine both therapies and imaging, typically exceed the concentrations that can be quantified by conventional T2- or T2*-weighted MRI (6,8). The inadequacy of current clinical imaging techniques to quantify IONP biodistribution at high concentrations has hindered current clinical applications of magnetic nanoparticles.
The relaxation rate constant per unit IONP concentration for longitudinal magnetization recovery (the relaxivity, r1) is usually much smaller than the corresponding parameter describing transverse magnetization decay (r2). As a result, positive T1 contrast for imaging and quantifying IONPs in tissues has not been widely used. However, sequences like swept imaging with Fourier transformation (SWIFT) and ultra-short echo-time (UTE) have recently demonstrated utility for detecting and quantifying high IONP concentrations with positive contrast (9–13) at relatively high iron concentrations. These sequences have a negligible T2 or T2* weighting because they acquire signal immediately during or after the excitation pulse. Thus, the purpose of this study was to determine the feasibility of using T1 contrast to non-invasively quantify and monitor the biodistribution of IONPs in vivo in major organs in a wide, clinically relevant concentration range which falls within the measurement gap between conventional MRI and CT methods.
Methods
Nanoparticle Synthesis and Characterization
Functionalized mesoporous silica-coated IONPs (msIONPs) were produced with superparamagnetic iron oxide cores (EMG-308, Ferrotec USA) following a previously described protocol to synthesize the mesoporous silica shell with a polyethylene glycol and trichloromethylsilane coating with an average diameter of 74 ± 2 nm (14). Iron content varied between 6.0 and 7.5% mass of msIONPs. The longitudinal relaxivity, r1, of msIONPs at 9.4 T and 23°C in agarose was assessed following previously described methods (13) and was measured to be 5.13 ± 0.08 (mg Fe/ml)−1s−1 [0.29 ± 0.005 mM−1 s−1]. The low toxicity and colloidal stability within biological environments allowed us to assume aggregation did not have an effect on the in vivo R1 measurements (14). Adjustments to surface charge were induced by varying the drying time after purification. Drying was performed using a rotory evaporator (IKA RV 10) in a hot water bath set to 40°C. Long drying times (~ 1.5 h) reliably produced high negatively charged nanoparticles (−30 to −35 mV). Shorter drying times resulted in negatively charged particles (−19 mV), however, variability (−15 to −35 mV) in the surface charge was observed between batches. Further assessment is being performed to understand the impact drying time has on surface functionalization and to obtain better control over the drying protocol. The surface charge of the nanoparticle was approximated with the ζ-potential measurements (Brookhaven Zeta PALS, 15 mV, 635 nm diode laser) made in a pH 7.0 solution. Results are reported as the average of five instrumental runs with 10 s wait periods between each run.
Animal Handling and in vivo Studies
Fifteen female nude mice (Athymic Nude-Foxn1nu, Harlan Laboratories, Indianapolis, IN, USA), 6 – 8 weeks old, weighing 19 to 26 g received intravenous injections through the tail vein at a range of IONP concentrations from 0 to 0.18 mg Fe/(g of mouse weight). The injected IONP solution was at approximately 20 mg Fe/mL and the injection volume was between 50 – 200 μL. The variation of IONP concentration within the organs was achieved by changing the injection volume to each mouse. All animal procedures and care were approved by the University of Minnesota Institutional Animal Care and Use Committee.
In vivo MR imaging and relaxation rate measurements
MR imaging was performed 24 hour and 1 week post-injection and all mice were sacrificed after a single imaging session. All MR images were acquired on a 9.4 T 31cm MRI scanner (Agilent Technologies, USA). A home-made Helmholtz volume RF coil with dimensions 4 cm × 4 cm × 5.5 cm was used. Both 3D multi-band SWIFT (MB-SWIFT) and 3D gradient echo (GRE) images were acquired (15). The imaging parameters for MB-SWIFT were: flip angle = 10°, acquisition delay ≈ 2 μs, BW = 384 kHz, TR = 2.7 ms, gaps = 4, and voxel resolution = 97 × 97 × 97 μm. The GRE imaging parameters were: flip angle = 10°, TE = 2.1 ms, BW = 100 kHz and TR = 4.2 ms. The 3D T1 map was acquired using SWIFT Look-Locker method with MB-SWIFT sequence as readout with flip angle = 1°, acquisition delay ≈ 2 μs, BW = 384 kHz, TR = 1.2 ms, gaps = 2, voxel resolution = 194 × 194 × 194 μm and total acquisition time around 7 minutes (13,15). Respiratory and cardiac gating were not used. All data processing was performed using MATLAB 2012b. The raw data from MB-SWIFT sequence were processed as described in a previous methodology paper (15). For each voxel, 64 time points along the T1 recovery curve were acquired and fitted (13). For each animal, 3D regions of interest (ROI) were manually drawn around the margins of the organs by the same person to ensure consistency when comparing organs. The mean and standard deviation of the R1 over all voxels in the ROI were calculated for each organ individually.
Ex Vivo heating measurement for magnetic nanoparticle hyperthermia
As described previously, a 1 kW Hotshot inductive heating system with a 2.75-turn, water-cooled copper coil (Ameritherm Inc., Scottsville, NY) was used to generate the alternating magnetic field. Reported SAR data were acquired at 20 kA/m field strength (volume-averaged peak-amplitude across the sample) with an applied frequency fixed at 190 ± 10% kHz (14,16).
Each tissue sample was placed in a plastic insulated microcentrifuge tube and centered in the coil. During heating the temperature was continuously recorded with a Luxtron 3100 fluoroptic thermometry system (Luxtron Inc., Santa Clara, CA). The volumetric specific absorption rate (SARv) was calculated from the temperature vs. time curve measured in triplicate. The fit method and time frame used to define the time rise and therefore SARv was determined from the first derivative (Supporting Figure S1). A combination of linear fitting and Box-Lucas fitting was used with this analysis which (Supporting Figure S2 and Supporting Table S1) (17,18). The specific absorption rate as a function of the iron present (SARFe) was determined by the linear fit of SARv and the measured iron content.
Ex Vivo Tissue Characterization
Histological analysis and iron quantification were performed on the liver, spleen, and kidney. For histological analysis, the organs were routinely fixed with 10% buffered formalin, dehydrated, and processed into paraffin blocks. Tissue sections were cut at 4 μm and stained with Prussian blue and nuclear fast red. The histopathologic reaction of the tissues was assessed with a serial section from each tissue block stained with hematoxylin and eosin. For iron quantitation, tissue samples rinsed 3× with phosphate buffered saline, stored at −80°C, dehydrated by lyopholization (SP Scientific Benchtop K, Gardener, NY), digested in a 5:1:1 mixture of concentrated nitric:hydrochloric:hydrofluoric acid, and diluted 2-fold with a 4% solution of boric acid to allow full dissolution of silica. Iron quantitation was performed on a Thermo Scientific iCAP 6500 dual-view ICP-OES (West Palm Beach, FL) with 1150 W power.
Transmission electron microscopy (TEM) was performed on a Tecnai T12 transmission electron microscope operating at 120 kV for all samples. Dark-field TEM was utilized to distinguish nanoparticles from the surrounding biological matrix (19). Tissue samples were embedded into resin using a typical process of fixation and stained with 1% osmium tetroxide (16).
Statistical Analysis
In total, 15 mice were used in this study. Datasets were acquired at 24 hour and 1 week post-injection. Within the 24 hour dataset, besides the iron concentration, there are two different sub-groups corresponding to the two different nanoparticles: highly negatively charged and negatively charged. For liver and spleen, calibration fits performed separately on these two different charge datasets were not statistically distinct (p = 0.6567 and 0.9351, respectively). For kidney a difference in relaxivity was observed based on charge (p = 0.0011), and therefore, those datasets were reported separately. Data for the kidney combines data acquired for both the left and right kidney. Finally, for spleen there were n = 2 statistical outliers for the measured iron concentration (defined by the Q-test), and these datasets were removed from the biodistribution and R1 data analysis. Statistical analysis was performed using Graphpad Prism version 6.02 (GraphPad Software, La Jolla California USA). The relaxivity measurements were determined with least-squares fitting. One-way ANOVA was used to assess statistical significance.
Results
In vivo MR Images and Maps
The effects on image contrast caused by the presence of msIONPs at 24 h post-injection are demonstrated in Figure 1. In GRE post-injection images, a large signal void is observed over almost the entire abdomen due to the ultra-short T2* caused by msIONPs in tissues, specifically at the locations of the liver, spleen, and kidneys. The huge susceptibility difference and ultra-short T2* also increases the overall noise level of the images as compared to the control. In SWIFT post-injection images, the T1 contrast between these three organs is much more evident than in the control images. Furthermore, uptake into the bone marrow was observed with SWIFT images (Figure 1, red arrows), however, due to the high localized concentration, dipole artifacts are observed and the bone marrow uptake could not be quantified. At high injection doses (0.18 mg/g mouse wt.), dipole shaped artifacts were observed in the bone marrow of the femur due to large susceptibility differences (red arrows in Figure 1). The non-specific uptake of nanoparticles into the bone marrow through macrophage uptake is known, but is often over looked due to the small uptake in comparison to the liver and spleen (20). In the SWIFT R1 map, the liver, spleen, kidney and even the abdominal aorta were further highlighted from the surrounding tissues. While a decrease in signal is observed at the top of the image for the injected SWIFT images, it is worth noting that the Look-locker R1 map at the current setting is highly insensitive to field inhomogeneity (13). Notice stomach and colon also have very short T1 (Figure 1, black stars), which is independent of the iron deposition.
Figure 1.

A comparison of coronal images is shown in naïve nude mice in control (without any injection), with 0.09 and 0.18 mg Fe/(g mouse wt.) msIONPs injected. The organs of interest, liver, spleen, and kidneys are shown in the GRE and SWIFT images outlined in purple, orange, and green, respectively. Red arrows in the SWIFT images indicate the presence of a dipole artifact within the femur and pelvis of the mouse. The black stars indicate susceptibility artifacts within the digestive track of the mouse.
Examples of the voxel-based T1 recovery curves for the SWIFT Look-Locker sequence with saturation recovery are shown in Figure 2 for the primary clearance organs at 24h post-injection. Due to the ultra-short T2* of the tissues, the signal was not fully saturated at the beginning. Therefore, three-variable exponential fitting was applied to compensate for the residual magnetization (13).
Figure 2.
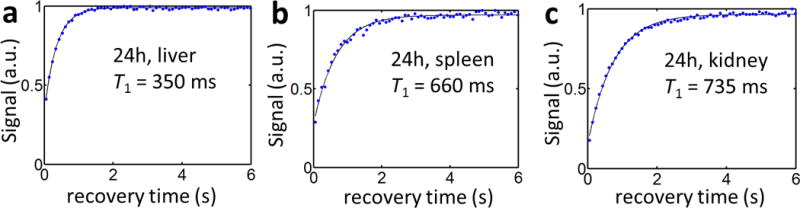
Representative data from the liver (a), spleen (b), and kidney (c) demonstrate the exponential fits obtained for each voxel.
Correlation between R1 and msIONP concentration in Organ Uptake
Plots between the average R1 over the 3D ROI of different organs and iron concentration from mass spectroscopy are shown in Figure 3. Two different post-injection times (24 h and 1 week) were compared. Each data point corresponds to a single animal, where the error bars indicate the standard deviation of the R1 over the entire ROI of each organ.
Figure 3.

Relaxivity (R1 vs. iron concentration) of the liver (R2 = 0.994, n = 11), spleen (R2 = 0.984, n = 4 at 24 h and 0.977, n = 4 at 1 week), and kidneys at 24 h (R2 = 0.976, n = 9) and 1 week post-injection.
At 24 hour post-injection, a linear dependence between R1 and iron concentration was demonstrated in all three organs. At 1 week post-injection, the linear relation still holds in liver and spleen, but not in kidney. The change in post-injection time had an impact on the spleen relaxivity (r1, the correlation between R1 and iron concentration), but not the liver. The relaxivities for the liver at these two time points deviated only by 0.002 (mg Fe/g tissue wt.) −1s−1 (0.063 mM−1 s−1, 0.2%; p = 0.2698; n = 6 for 24 h; n = 5 for 1 wk) and thus were fitted to the same linear equation for a final relaxivity (Figure 3.A). The error within the measured iron content is not visible on the plot and was determined to be < 0.001 mg Fe/g tissue wt. (0.018 mM Fe). The spleen relaxivity increased from 0.329 to 0.843 (mg Fe/g tissue wt.) −1s−1 (0.017 to 0.045 mM−1 s−1; n = 4) between 24 h and 1 week (Table 1 & Figure 3.B). The relaxivity within the kidney at 1 week post-injection was not reported due to a poor linear correlation (R2 = 0.456; n = 10, Figure 3.C).
Table 1.
msIONP r1 values
| 24 h post-injection | 1 week post-injection (highly negative) | |||
|---|---|---|---|---|
| negative | highly negative | |||
| Liver | g s−1 mg−1 | 1.19 ± 0.042 (n = 11) |
||
| mM−1 s−1 | 0.063 ± 0.002 | |||
| Spleen | g s−1 mg−1 | 0.329 ± 0.030 (n = 4) |
0.843 ± 0.092 (n = 4) |
|
| mM−1 s−1 | 0.017 ± 0.002 | 0.045 ± 0.005 | ||
| Kidney | g s−1 mg−1 | 2.32 ± 0.14 (n = 5) |
4.63 ± 0.27 (n = 9) |
N/A (n = 10) |
| mM−1 s−1 | 0.119 ± 0.005 | 0.247 ± 0.014 | ||
Histology and TEM images
Histology and TEM images of different organs are presented in Figures 4 – 6. Routine histologic sections of liver, spleen, and kidney were used to assess the histopathologic reaction caused by the nanoparticle at 24 h and 1 week post-injection with similar injection dose (~ 0.16 mg Fe/g mouse weight). An increase in mitotic activity was observed in the liver at 1 week post-injection, but no changes were observed in the other tissues at either time point. Iron oxide core degradation within the nanoparticle was observed using TEM. The mesoporous silica shells appeared to be intact in all three organs.
Figure 4.
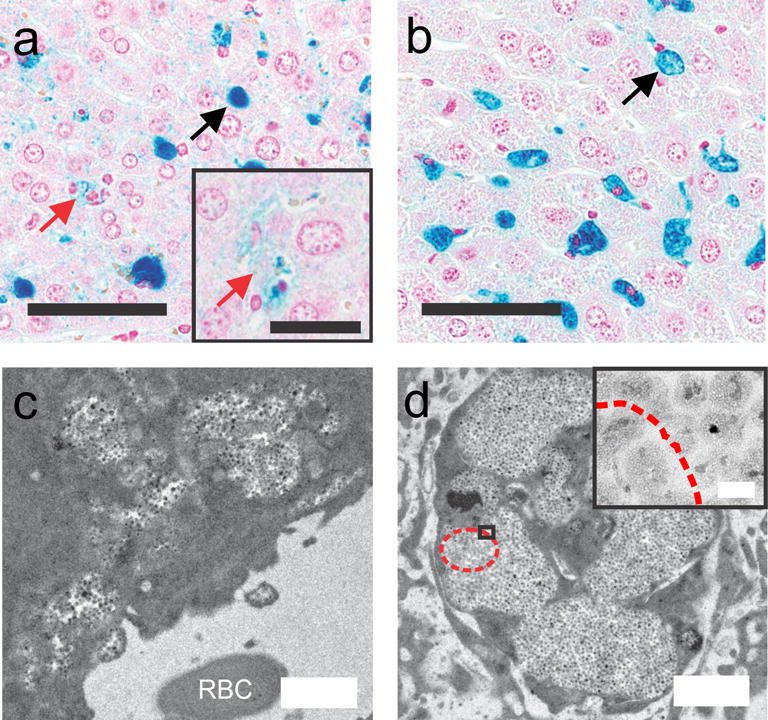
Histology sections of the liver stained with Prussian blue demonstrate uptake (blue granular staining) at 24 h (a) and 1 week (b) post-injection. Black bar = 60 μm, inset bar = 30 μm. Uptake into the kupffer cells (black arrows, concentrated areas of intensely positive blue staining) is present at both time points, while hepatocyte uptake (faint granular cytoplasmic staining) is visible at 24 h (red arrows), but is less pronounced at 1 week. TEM provides better detail of the nanoparticle uptake at 24 h (c) and 1 week (d) post-injection. White bar = 1 μm, inset bar = 50 nm. The 24 h post-injection uptake (c) was noted adjacent to the sinusoid (red blood cell is marked with RBC). In (d) for 1 week post-injection, the nanoparticles have been taken up by a Kupffer cell. Furthermore, degradation of the iron core is visible (red dashed outline).
Figure 6.

Histology of Prussian-blue stained sections of kidney showing faint iron uptake with the cortex at 24 h (a) and 1 week (d) post-injection (black bar = 60 μm) and more intense iron uptake within the medulla at 24 h (b) and 1 week (c) post-injection (black bar = 300 μm). TEM of the kidney demonstrates the apparent degradation of the iron oxide core (red arrows) in the msIONPs at 1 week (e) compared to none at 24 h (f) post injection.
Liver
The intra-organ distribution of iron uptake within the liver was verified histologically at 24 h (Figure 4.A) and 1 week (Figure 4.B) post-injection. For both time points, most of the iron was localized in clusters within Kupffer cells (Figure 4.A and B, black arrows). At 24 h post-injection, small amounts of iron are observed in the extracellular space and within hepatocytes identified by the presence of pale granular blue material (Figure 4.A, red arrows). This was not observed at 1 week post-injection (Figure 4.B). From TEM at 24 hours post-injection (Figure 4.C), IONPs were observed to be located adjacent to the sinusoid. At one week, most nanoparticles were located within macrophages (Figure 4.D). Also, degradation of the iron cores with intact shells was noticeable (Figure 4.D, red dashed oval) by the missing dark contrast of the core in the center of the nanoparticle. At one week post-injection, 5% of the iron oxide core within the nanoparticles had completely degraded (n = 300). On the contrary, all of the IONP cores were intact in the TEM of the original IONP sample and the liver tissue for 24 h post-injection.
Spleen
The iron uptake within the spleen was verified histologically and demonstrated that IONPs migrated from the red pulp into the white pulp over the course of the week (Figure 5). At 24 h post-injection the iron was mostly confined to the red pulp (Figure 5.B). The iron observed in the white pulp is not qualitatively increased compared to that observed in a control mouse (Figure 5.A). At 1 week, iron was no longer confined to the red pulp and was present in the center of the white pulp (Figure 5.C). The binary distribution of IONPs in red and white pulp can also be seen in the SWIFT images (Figure 5.E). Similar to the liver, almost all of the nanoparticles observed within the spleen at 1 week were taken up by macrophages. Unlike the liver, degradation of the core was not observed using TEM (n = 300) at 24 h or 1 week post-injection (Figures 5.E and F).
Figure 5.

Prussian Blue histology of spleen in control (a), 24 h (b), and 1 week (c) post-injection; black bar = 300 μm. A difference in uptake between the red pulp (peripheral area with increased blue staining) and the white pulp (central more circular pink areas with minimal blue staining) is noticeable between all three images. The uptake has a noticeable impact on image contrast within the coronal SWIFT MRI for control (d, red arrow) and 24 h (e, red arrow) post-injection images. Of the primary organs, the spleen was observed to have no core degradation 1 week post-injection with TEM (f); white bar = 200 nm.
Kidney
Iron uptake in kidney was heterogeneous with a different uptake observed within the cortex and the medulla at both post-injection time points (Figure 6). The cortex at 24 h shows some uptake into the renal tubules (Figure 6.A) and a higher uptake after 1 week (Figure 6.B). Iron in the medulla was confined to be outside of the tubules either by uptake into endothelial cells or macrophages and within the blood stream (Figure 6.C and D). While this uptake was still visible 1 week after injection, a much lower amount of iron was observed and the iron appeared to be confined to macrophages. Regarding particle degradation, the assessment of the nanoparticles from the TEM images indicated that at 1 week 18% of the iron oxide cores were degraded leaving a hole within the nanoparticle (Figure 6.F).
Effects of msIONP Surface Charge on Relaxivity
In addition to investigating the change in relaxivity between 24 h and 1 week, the effect of msIONP surface charge was explored (Figure 7). Changes in surface charge were elicited by changes in drying time during the final purification step. Two charges were compared with ζ-potentials of −19 (negative) and −32 mV (highly negative). Different surface charges were compared at a 24 h post-injection time.
Figure 7.
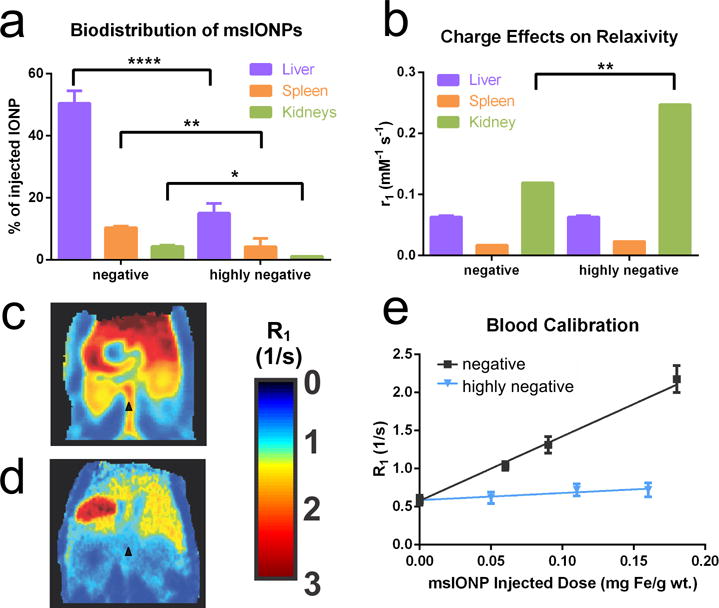
The biodistribution in liver, spleen, and kidneys as a function of the surface charge of msIONPs (a). A comparison of relaxivity in different organs as a function of surface charge (b). The R1 maps of a mouse 24 h post-injection of negative (c) and highly negative (d) nanoparticles at 0.18 mg Fe/g mouse wt. The change in R1 within the abdominal aorta (black triangle in c and d) as a function of the injected dose is plotted (e). **** indicates high significance (p ≤ 0.001), * indicates significance (p ≤ 0.05).
The biodistribution within the mouse was significantly affected by the charge of the msIONP surface coating (Figure 7.A & Table 2). In this study, only the biodistribution within the liver, spleen, and kidney was measured with ICP-OES iron quantification. This accounted for 63% of the negatively charged IONPs and 20% of the highly negatively charged IONPs. The excretion of the IONPs or biodistribution within the heart, brain, or lungs was not verified through MRI or ICP-OES. The relaxivity for the liver and spleen at 24h post-injection both appeared to be unaffected by the change in surface charge (n = 3) (Figure 7,) whereas a change was observed in the kidneys (n = 6). A comparison of R1 maps for mice injected with IONPs with different surface charge (~0.16 mg Fe/g wt.) (Figures 7.C and D) demonstrate reduction in IONP concentration in the primary clearance organs corresponding to Figure 7.A.
Table 2.
msIONP Biodistribution
| 24 h post-injection | 1 week post-injection (highly negative) | ||
|---|---|---|---|
| negative | highly negative | ||
| Liver | 50.4 ± 4.0% (n = 3) |
15.0 ± 3.1% (n = 3) |
14.5 ± 2.4% (n = 4) |
| Spleen | 10.4a | 4.2 ± 2.1% (n = 3) |
2.7 ± 0.9% (n = 4) |
| Kidney | 2.2 ± 0.4% (n = 6) |
0.5 ± 0.1% (n = 7) |
0.9 ± 0.3% (n = 8) |
Spleen (n = 2) difference between and measurements ± 0.5%
The difference in uptake caused by msIONP surface charge was also evident in the abdominal aorta (black star, Figures 7.c and d). With a similar injection dose, the negatively charged msIONPs demonstrated an increased concentration in the abdominal aorta (Figure 7.c); however, this was not true for the highly negatively charged msIONPs at the same post-injection time (24h) (Figure 7.d). Furthermore, when comparing the relaxivity within the abdominal aorta to the amount of msIONP injected, a correlation with charge was observed (Figure 7.e). This demonstrated very different circulation times of msIONPs with different surface charge. The R1 in Figure 7.e represents the average R1 from the ROI over aorta in different mice.
Correlation between R1 and SAR for magnetic nanoparticle hyperthermia
Figure 8 demonstrates preliminary heating data acquired with these nanoparticles. The ideal dosage range for magnetic fluid hyperthermia is 0.1 – 10 mg Fe/g tissue (6). A linear correlation was observed between the R1 and the volumetric specific absorption rate (SARv). Within the liver a linear correlation of 0.114 ± 0.010 W*s/mL (R2 = 0.961; n = 7) was observed at 24 h post-injection. The spleen also demonstrated linear correlation of 0.314 ± 0.053 W*s/mL (R2 = 0.916; n = 5). SARFe was observed to be approximately 134 and 107 W/g Fe in the liver and spleen, respectively. Interestingly, SARFe from msIONPs in agar and other biological solutions has been previously reported to be at 180 W/g Fe (14). Further studies are required to understand this drop in SARFe and obtain a more robust correlation due to effects from nanoparticle surface charge, tissue localization, and the presence of endogenous iron.
Figure 8.
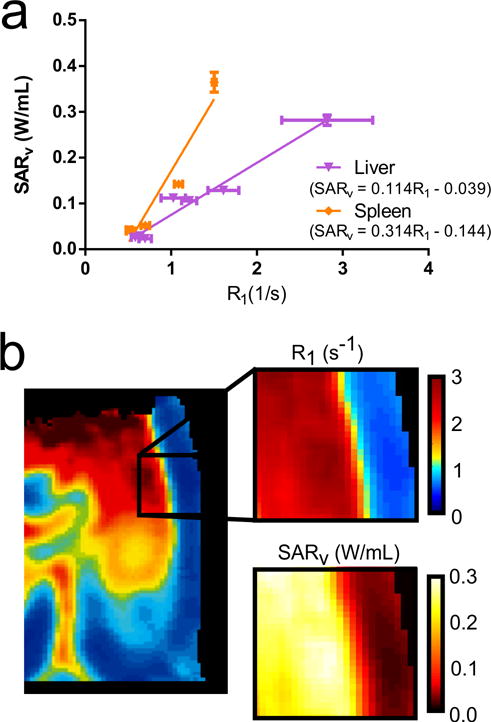
The ex vivo specific absorption rate, a metric of the heat produced from heating, with the in vivo R1. A linear correlation is observed within the spleen (R2 = 0.916, n = 5) and liver (R2 = 0.961, n = 7) 24 h post-injection (a). Using the calibration from the liver, a section of the R1 map including nearby tissue without msIONP uptake is converted to a SARv map (b).
Discussion
From this work, the advantage of a T1-weighted method over a T2* or T2-weighted method becomes evident for high concentrations of IONPs, reducing the current gap in quantifiable IONP concentration range (0.1 to 10 mg Fe/mL (~ 2 to 200 mM)) where neither CT nor conventional MRI has sufficient sensitivity for quantification (6). Several ultra-short TE MR sequences have been recently developed to preserve signal from spins with an ultra-short T2* including UTE, zero echo time (ZTE), SWIFT, and pointwise encoding time reduction with radial acquisition (PETRA) (21–24). The quantification of IONPs in blood in vivo has been previously demonstrated with UTE, in the concentration range of 0.03 – 0.16 mg Fe/mL (0.54 – 2.9 mM Fe) (10). In our study, we expand the concentration range up to 3.2 mg Fe/mL (61 mM Fe) for in vivo biodistribution imaging (13). This work demonstrates the potential for biodistribution monitoring and quantification of organ uptake of the IONPs through positive T1 contrast in a wide dose range. The method has allowed us to extend the quantifiable in vivo IONP concentration range further into the gap between current MRI and CT techniques, which is desired for clinical heating applications, such as ferrofluid hyperthermia.
When using MRI for quantitative measurement of IONPs, the contrast induced by IONPs typically depends on concentration, water accessibility, particle size and heterogeneity of IONP distribution within the microenvironment. Aggregation and compartmentalization are two major challenges. Aggregation of IONPs induced in biological systems usually reduces their longitudinal relaxivity (14,16). The msIONPs used here are known to maintain colloidal stability under relevant biological (i.e. aggregating) conditions (14) and thus are thought to not aggregate in vivo. It is therefore assumed that the observed changes in R1 are from other factors such as their distribution in the tissues, including intra-organ distribution, as well as degradation. Furthermore, studies have shown that with this mesoporous silica coating, a full dissolution of the iron oxide core occurred after 50 h of exposure to highly acidic conditions (pH 0). The majority of the core dissolution did not occur until after 24 h (25). This explains the observation of intact cores within the msIONPs at 24 h, but core dissolution at 1 week post-injection. Another challenge which complicates the in vivo quantification of IONPs is compartmentalization, i.e. nanoparticles which are internalized in the cells compared to dispersed nanoparticles in the extracellular space (26–28). Compartmentalization in vivo has a known influence on the relaxation of contrast agents by changing water exchange and particle spacing relative to water diffusion (29). Billotey et. al. and Girard et. al. both showed in vitro that r1 was reduced for IONPs internalized by murine leukemic macrophage and endometrial regenerative stem cells (26,27). However, studies by Mandeville et. al. and Bacic et. al. concluded that a fast exchange assumption could be made for the water exchange between hepatocytes and extracellular space (30,31). In Kupffer cells where clusters of IONPS exist, the average surface area for water exchange is expected to be decreased, whereas the average diffusion path length is expected to be increased. These factors influence relaxivity differently as compared with IONPs in hepatocytes and in the extracellular space. From the current data, due to the limited resolution, multiple relaxation components were not observed in the T1 recovery curve for all three organs (Figure 2). Therefore, to simplify the condition, a single relaxation component was assumed and applied in the relaxivity fitting protocol. If the influence of cell internalization on relaxivity is mild, the single component is believed to be a good approximation by quantifying the average effect. The determination of whether the influence is significant enough to induce very different relaxation time constants in our case with current msIONPs and dose settings will require more thorough analyses in future work.
The liver was observed to have a negligible change in relaxivity between 24 hrs and 1 week post-injection, despite the observed particle degradation, change in local nanoparticle distribution, and different IONP surface charges. Excess iron in the liver is processed into endogenous iron, such as ferritin, within the hepatocytes and macrophages (32). Therefore, while IONP degradation was observed in liver, a strong impact on relaxivity was not observed.
Within the spleen, the change in relaxivity over time appeared to be tied to the change in location of the nanoparticles as observed qualitatively through histology. While we were unable to differentiate the red and white pulp within the R1 map due to limited spatial resolution, the distinction between the two areas was visible within the SWIFT image which has two-fold higher resolution (Figure 3). At high injected doses (0.18 mg Fe/g mouse wt.), T2 effects were observed within the red pulp. However, the SNR is still high enough for quantification, as observed in the T1 fitting. With the binary distribution for msIONPs in spleen existing on a much larger scale than in the liver, different relaxivities due to their different locations in spleen seems plausible. Degradation of the IONP cores was not visible and thus degradation does not appear to be a factor in the change of relaxivity in the spleen over time. Further investigation, specifically on the impact of location within the red and white pulp, is necessary to fully understand the relaxivity change observed within the spleen.
The change in relaxivity over time in the kidney is hypothesized to be dominated by the degradation of the iron oxide core. The majority of IONP dissolution within a mesoporous silica coating exposed to highly acidic solution conditions (pH 0) does not occur until after 24 h (25). The major byproduct of IONP degradation, Fe3+, is also known to cause T1 shortening (33). The rate of degradation, the migration of degraded products from other organs, and the differences in the organ distribution and relaxivity are all contributing factors resulting in a non-linear response to iron concentration. To enter the tubules in kidney, as indicated in the histology, the iron must be smaller than 5.5 nm (34). Therefore, the IONP degradation observed in kidney had a strong impact on relaxivity, unlike the liver.
Nanoparticle surface charge is known to affect biodistribution, especially at highly negative charges where the ζ-potential exceeds |30| mV (35). More specifically, highly charged nanoparticles have been demonstrated to be quickly excreted from the body (35,36). Despite the drastic change in biodistribution elicited by the different surface charge (Figure 7.a), the change of relaxivity in the liver and spleen was unaffected (Figure 7.b). The kidney demonstrated a statistically significant change in relaxivity, however the kidney uptake is extremely low for the high negatively charged msIONP. Based on these observations, R1 mapping methods that use ultra-short TE sequences could be viable methods to compare differences in biodistribution caused by adjusting the surface charge of the IONP platform.
In addition to clearance organs, the presence of IONPs in the blood stream was still observed at 24 h post-injection within the abdominal aorta in SWIFT images (Figures 7.c and d). At 24 h post-injection highly negatively charged msIONPs were demonstrated to exit from the circulatory system much faster than the negatively charged nanoparticles (Figure 7.e). This was verified in the liver histology, where a higher amount of negatively charged msIONPs were found in the micro hepatic vessels than the highly negatively charged IONPs.
An imaging approach which can quantify and monitor the biodistribution of IONPs is a necessity for therapeutic heating to be practical in the clinic. Previously, linear correlation between R1 and SARv was demonstrated in a phantom (16). In the case with msIONPs, at 24h post-injection time, the SARv demonstrated a linear correlation with the R1 in both liver and spleen. Further work is required to fully understand the mechanism of the linear correlation and the influence of different surface charges and post-injection time on the correlation. Notice the electromagnetic energy deposited with this method is very different from the heat generated while acquiring an MR image. For hyperthermia, the magnetization of IONPs is forced to change orientation rapidly (kHz) with the RF magnetic field, leading to the creation of local heat. For MRI, the RF is in the tens to hundreds of MHz range and is at a lower strength. The magnetization of the tissue is also much lower than that of the IONPs. Thus, the SAR created in MRI scanning is usually much lower than in hyperthermia. Note that the current hyperthermia technique cannot be performed inside the MRI scanner, because the strong B0 field will lock the orientation of the IONPs and thus reduce heat generation.
There were several limitations within the current experiments and analysis which should be considered. Firstly, only one relaxation time constant was assumed in the voxel-based T1 fitting, while apparent heterogeneity of IONP distribution within the microenvironment was observed in all three organs. Future studies on the influence of IONP compartmentalization, mapping with higher resolution, and use of multiple relaxation components fitting may provide more accurate local information. Secondly, the determination of IONP local distribution within the microenvironment is limited. The prevention of aggregation of msIONPs actually imposes an extra challenge to capture the big picture about their local distribution through histology, since the resolution of histology is far from enough to demonstrate the distribution of dispersed msIONPs. Although TEM images were presented, due to the limited FOV explored, the overall distribution of msIONPs in organs concluded in this paper is still limited (14,37). Thirdly, the iron content determination was performed by digesting the entire organ and then was measured with ICP-OES, which is impacted by both the endogenous iron present in the tissue, as well as excess ferritin produced due to the degraded iron oxide core. With this method of preparation, all of the iron within the organs, including the endogenous iron, was measured. While we anticipate this will not change the trend, the endogenous iron can fluctuate between mice and over time. Lastly, at this stage, we are not able to quantify the msIONPs in bone marrow due to the extremely high local concentration, which can easily cause a dipole artifact. The use of a higher bandwidth will help resolve the signal (15). Further investigation is needed to extend this method to a true full body assessment.
Conclusion
In summary, the results of our study demonstrated the potential and the limitations of R1 measurements to non-invasively quantify IONPs within three major organs. Of the organs observed, the liver demonstrated the most promise for monitoring biodistribution due to its constant r1 over different post-injection times and surface charge properties and the linear correlation between R1 and SARv. Further studies are required to fully understand the mechanisms which cause changes in R1 and determine if they can be used to monitor and predict the biodistribution of IONPs within the body.
Supplementary Material
Supporting Figure S1: A normalized temperature vs. time curve from spleen tissue with msIONP uptake demonstrates the exponential curve observed as a thermal steady state is achieved within the system (left). The first derivatives demonstrate a plateau characteristic, however, for high concentrations (3.2 mg Fe/g tissue wt.) an immediate decrease is observed after the initial heating (right).
Supporting Figure S2: SARv as a function of iron concentration for the liver (left) and the spleen (right). For high concentrations of iron within both tissues, the linear fit obtains an underestimate of the SARv.
Supporting Table S1: SARFe & SARv:R1 Fitting Comparison within the liver and spleen.
Acknowledgments
This work was funded by: NIH P41 EB015894, S10 RR25437, WM KECK Foundation, NSF/CBET-1066343 & 1336659 and MN Futures Grant (UMN). K.H. acknowledges support from an NSF Graduate Research Fellowship (00006595). Q.S. acknowledges support from the University of Minnesota IEM Cancer Animal Core Lab. Parts of this work were carried out in the Characterization Facility, University of Minnesota, which receives partial support from NSF through the MRSEC program. Histologic services were provided by the Histology and Immunohistochemistry (IHC) Laboratory, University of Minnesota. Histologic imaging was provided by the Digital Imaging Facility, BioNet, University of Minnesota. The authors would like to thank Z. Gao and N. Klein for their valuable discussion; L. Utecht for her support with animal care; F. Zhou for her support with transmission electron microscopy sample preparation; R. Knurr for his support with ICP-OES acquisition; and C. Forster for her support with histology.
References
- 1.Smolensky ED, Marjanska M, Pierre VC. A responsive particulate MRI contrast agent for copper(I): a cautionary tale. Dalton Trans. 2012;41:8039–8046. doi: 10.1039/c2dt30416c. [DOI] [PMC free article] [PubMed] [Google Scholar]
- 2.Corot C, Robert P, Idée J-M, Port M. Recent advances in iron oxide nanocrystal technology for medical imaging. Advanced Drug Delivery Reviews. 2006;58(14):1471–1504. doi: 10.1016/j.addr.2006.09.013. [DOI] [PubMed] [Google Scholar]
- 3.Sun C, Lee JSH, Zhang M. Magnetic nanoparticles in MR imaging and drug delivery. Advanced Drug Delivery Reviews. 2008;60(11):1252–1265. doi: 10.1016/j.addr.2008.03.018. [DOI] [PMC free article] [PubMed] [Google Scholar]
- 4.Ros PR, Freeny PC, Harms SE, Seltzer SE, Davis PL, Chan TW, Stillman AE, Muroff LR, Runge VM, Nissenbaum MA. Hepatic MR imaging with ferumoxides: a multicenter clinical trial of the safety and efficacy in the detection of focal hepatic lesions. Radiology. 1995;196(2):481–488. doi: 10.1148/radiology.196.2.7617864. [DOI] [PubMed] [Google Scholar]
- 5.Dennis CL, Jackson AJ, Borchers JA, Hoopes PJ, Strawbridge R, Foreman AR, Van Lierop J, Grüttner C, Ivkov R. Nearly complete regression of tumors via collective behavior of magnetic nanoparticles in hyperthermia. Nanotechnology. 2009;20(39):395103. doi: 10.1088/0957-4484/20/39/395103. [DOI] [PMC free article] [PubMed] [Google Scholar]
- 6.Gneveckow U, Jordan A, Scholz R, Brüss V, Waldöfner N, Ricke J, Feussner A, Hildebrandt B, Rau B, Wust P. Description and characterization of the novel hyperthermia-and thermoablation-system MFH300F for clinical magnetic fluid hyperthermia. Medical physics. 2004;31:1444–1444. doi: 10.1118/1.1748629. [DOI] [PubMed] [Google Scholar]
- 7.Kuhlpeter R, Dahnke H, Matuszewski L, Persigehl T, von Wallbrunn A, Allkemper T, Heindel WL, Schaeffter T, Bremer C. R2 and R2* Mapping for Sensing Cell-bound Superparamagnetic Nanoparticles: In Vitro and Murine in Vivo Testing. Radiology. 2007;245(2):449–457. doi: 10.1148/radiol.2451061345. [DOI] [PubMed] [Google Scholar]
- 8.Kiessling F, Mertens ME, Grimm J, Lammers T. Nanoparticles for Imaging: Top or Flop? Radiology. 2014;273(1):10–28. doi: 10.1148/radiol.14131520. [DOI] [PMC free article] [PubMed] [Google Scholar]
- 9.Zhou R, Idiyatullin D, Moeller S, Corum C, Zhang H, Qiao H, Zhong J, Garwood M. SWIFT detection of SPIO-labeled stem cells grafted in the myocardium. Magnetic Resonance in Medicine. 2010;63(5):1154–1161. doi: 10.1002/mrm.22378. [DOI] [PMC free article] [PubMed] [Google Scholar]
- 10.Gharagouzloo CA, McMahon PN, Sridhar S. Quantitative contrast-enhanced MRI with superparamagnetic nanoparticles using ultrashort time-to-echo pulse sequences. Magnetic Resonance in Medicine. 2015;74(2):431–441. doi: 10.1002/mrm.25426. [DOI] [PMC free article] [PubMed] [Google Scholar]
- 11.Wang L, Corum CA, Idiyatullin D, Garwood M, Zhao Q. T(1) Estimation for Aqueous Iron Oxide Nanoparticle Suspensions Using a Variable Flip Angle SWIFT Sequence. Magnetic resonance in medicine: official journal of the Society of Magnetic Resonance in Medicine/Society of Magnetic Resonance in Medicine. 2013;70(2) doi: 10.1002/mrm.24831. [DOI] [PMC free article] [PubMed] [Google Scholar]
- 12.Wang L, Zhong X, Qian W, Huang J, Cao Z, Yu Q, Lipowska M, Lin R, Wang A, Yang L, Mao H. Ultrashort Echo Time (UTE) imaging of receptor targeted magnetic iron oxide nanoparticles in mouse tumor models. Journal of Magnetic Resonance Imaging. 2014;40(5):1071–1081. doi: 10.1002/jmri.24453. [DOI] [PMC free article] [PubMed] [Google Scholar]
- 13.Zhang J, Chamberlain R, Etheridge M, Idiyatullin D, Corum C, Bischof J, Garwood M. Quantifying iron-oxide nanoparticles at high concentration based on longitudinal relaxation using a three-dimensional SWIFT look-locker sequence. Magnetic Resonance in Medicine. 2014;71(6):1982–1988. doi: 10.1002/mrm.25181. [DOI] [PMC free article] [PubMed] [Google Scholar]
- 14.Hurley KR, Ring HL, Etheridge M, Zhang J, Gao Z, Shao Q, Klein ND, Szlag VM, Chung C, Reineke TM, Garwood M, Bischof JC, Haynes CL. Predictable Heating and Positive MRI Contrast from a Mesoporous Silica-Coated Iron Oxide Nanoparticle. Molecular Pharmaceutics. 2016 doi: 10.1021/acs.molpharmaceut.5b00866. [DOI] [PubMed] [Google Scholar]
- 15.Idiyatullin D, Corum CA, Garwood M. Multi-Band-SWIFT. Journal of Magnetic Resonance. 2015;251(0):19–25. doi: 10.1016/j.jmr.2014.11.014. [DOI] [PMC free article] [PubMed] [Google Scholar]
- 16.Etheridge ML, Hurley KR, Zhang J, Jeon S, Ring HL, Hogan C, Haynes CL, Garwood M, Bischof JC. Accounting for biological aggregation in heating and imaging of magnetic nanoparticles. Technology. 2014;02(03):214–228. doi: 10.1142/S2339547814500198. [DOI] [PMC free article] [PubMed] [Google Scholar]
- 17.Bordelon DE, Cornejo C, Grüttner C, Westphal F, DeWeese TL, Ivkov R. Magnetic nanoparticle heating efficiency reveals magneto-structural differences when characterized with wide ranging and high amplitude alternating magnetic fields. Journal of Applied Physics. 2011;109(12):124904. [Google Scholar]
- 18.Kallumadil M, Tada M, Nakagawa T, Abe M, Southern P, Pankhurst QA. Suitability of commercial colloids for magnetic hyperthermia. Journal of Magnetism and Magnetic Materials. 2009;321(10):1509–1513. [Google Scholar]
- 19.Klein ND, Hurley KR, Feng ZV, Haynes CL. Dark Field Transmission Electron Microscopy as a Tool for Identifying Inorganic Nanoparticles in Biological Matrices. Analytical Chemistry. 2015;87(8):4356–4362. doi: 10.1021/acs.analchem.5b00124. [DOI] [PubMed] [Google Scholar]
- 20.Sou K. Advanced Drug Carriers Targeting Bone Marrow. In: Sezer AD, editor. Recent Advances in Novel Drug Carrier Systems: In Tech. 2012. [Google Scholar]
- 21.Robson MD, Gatehouse PD, Bydder M, Bydder GM. Magnetic Resonance: An Introduction to Ultrashort TE (UTE) Imaging. Journal of Computer Assisted Tomography. 2003;27(6) doi: 10.1097/00004728-200311000-00001. [DOI] [PubMed] [Google Scholar]
- 22.Hafner S. Fast imaging in liquids and solids with the Back-projection Low Angle ShoT (BLAST) technique. Magnetic Resonance Imaging. 1994;12(7):1047–1051. doi: 10.1016/0730-725x(94)91236-p. [DOI] [PubMed] [Google Scholar]
- 23.Idiyatullin D, Corum C, Park J-Y, Garwood M. Fast and Quiet MRI using a Swept Radiofrequency. Journal of Magnetic Resonance. 2006;181(2):342–349. doi: 10.1016/j.jmr.2006.05.014. [DOI] [PubMed] [Google Scholar]
- 24.Grodzki DM, Jakob PM, Heismann B. Ultrashort echo time imaging using pointwise encoding time reduction with radial acquisition (PETRA) Magnetic Resonance in Medicine. 2012;67(2):510–518. doi: 10.1002/mrm.23017. [DOI] [PubMed] [Google Scholar]
- 25.Hurley KR, Lin Y-s, Zhang J, Egger SM, Haynes CL. Effects of Mesoporous Silica Coating and Post-Synthetic Treatment on the Transverse Relaxivity of Iron Oxide Nanoparticles. Chemistry of materials: a publication of the American Chemical Society. 2013;25(9):1968–1978. doi: 10.1021/cm400711h. [DOI] [PMC free article] [PubMed] [Google Scholar]
- 26.Billotey C, Wilhelm C, Devaud M, Bacri JC, Bittoun J, Gazeau F. Cell internalization of anionic maghemite nanoparticles: Quantitative effect on magnetic resonance imaging. Magnetic Resonance in Medicine. 2003;49(4):646–654. doi: 10.1002/mrm.10418. [DOI] [PubMed] [Google Scholar]
- 27.Girard OM, Ramirez R, McCarty S, Mattrey RF. Toward absolute quantification of iron oxide nanoparticles as well as cell internalized fraction using multiparametric MRI. Contrast media & molecular imaging. 2012;7(4):411–417. doi: 10.1002/cmmi.1467. [DOI] [PMC free article] [PubMed] [Google Scholar]
- 28.Wilson GJ, Woods M, Springer CS, Bastawrous S, Bhargava P, Maki JH. Human Whole Blood (1)H(2)O Longitudinal Relaxation with Normal and High-Relaxivity Contrast Reagents: Influence of Trans-Cell-Membrane Water Exchange. Magnetic resonance in medicine. 2014;72(6):1746–1754. doi: 10.1002/mrm.25064. [DOI] [PMC free article] [PubMed] [Google Scholar]
- 29.Donahue KM, Weisskoff RM, Burstein D. Water diffusion and exchange as they influence contrast enhancement. J Magn Reson Imaging. 1997;7(1):102–110. doi: 10.1002/jmri.1880070114. [DOI] [PubMed] [Google Scholar]
- 30.Mandeville JB, Moore J, Chesler DA, Garrido L, Weissleder R, Weisskoff RM. Dynamic liver imaging with iron oxide agents: Effects of size and biodistribution on contrast. Magnetic Resonance in Medicine. 1997;37(6):885–890. doi: 10.1002/mrm.1910370613. [DOI] [PubMed] [Google Scholar]
- 31.Bacic G, Alameda JC, Jr, Iannone A, Magin RL, Swartz HM. NMR study of water exchange across the hepatocyte membrane. Magnetic Resonance Imaging. 1989;7(4):411–416. doi: 10.1016/0730-725x(89)90490-6. [DOI] [PubMed] [Google Scholar]
- 32.Longmire M, Choyke PL, Kobayashi H. Clearance Properties of Nano-sized Particles and Molecules as Imaging Agents: Considerations and Caveats. Nanomedicine (London, England) 2008;3(5):703–717. doi: 10.2217/17435889.3.5.703. [DOI] [PMC free article] [PubMed] [Google Scholar]
- 33.Saha P, Andia ME, Modarai B, Blume U, Humphries J, Patel AS, Phinikaridou A, Evans CE, Mattock K, Grover SP, Ahmad A, Lyons OT, Attia RQ, Renné T, Premaratne S, Wiethoff AJ, Botnar RM, Schaeffter T, Waltham M, Smith A. Magnetic Resonance T(1) Relaxation Time of Venous Thrombus Is Determined by Iron Processing and Predicts Susceptibility to Lysis. Circulation. 2013;128(7):729–736. doi: 10.1161/CIRCULATIONAHA.113.001371. [DOI] [PMC free article] [PubMed] [Google Scholar]
- 34.Longmire MR, Ogawa M, Choyke PL, Kobayashi H. Biologically Optimized Nanosized Molecules and Particles: More than Just Size. Bioconjugate Chemistry. 2011;22(6):993–1000. doi: 10.1021/bc200111p. [DOI] [PMC free article] [PubMed] [Google Scholar]
- 35.Souris JS, Lee C-H, Cheng S-H, Chen C-T, Yang C-S, Ho J-aA, Mou C-Y, Lo L-W. Surface charge-mediated rapid hepatobiliary excretion of mesoporous silica nanoparticles. Biomaterials. 2010;31(21):5564–5574. doi: 10.1016/j.biomaterials.2010.03.048. [DOI] [PMC free article] [PubMed] [Google Scholar]
- 36.Sonavane G, Tomoda K, Makino K. Biodistribution of colloidal gold nanoparticles after intravenous administration: Effect of particle size. Colloids and Surfaces B: Biointerfaces. 2008;66(2):274–280. doi: 10.1016/j.colsurfb.2008.07.004. [DOI] [PubMed] [Google Scholar]
- 37.Hurley KR, Ring HL, Kang H, Klein ND, Haynes CL. Characterization of Magnetic Nanoparticles in Biological Matrices. Analytical Chemistry. 2015;87(23):11611–11619. doi: 10.1021/acs.analchem.5b02229. [DOI] [PubMed] [Google Scholar]
- 38.Boutaleb S, Pouget JP, Hindorf C, Pelegrin A, Barbet J, Kotzki PO, Bardies M. Impact of Mouse Model on Preclinical Dosimetry in Targeted Radionuclide Therapy. Proceedings of the IEEE. 2009;97(12):2076–2085. [Google Scholar]
Associated Data
This section collects any data citations, data availability statements, or supplementary materials included in this article.
Supplementary Materials
Supporting Figure S1: A normalized temperature vs. time curve from spleen tissue with msIONP uptake demonstrates the exponential curve observed as a thermal steady state is achieved within the system (left). The first derivatives demonstrate a plateau characteristic, however, for high concentrations (3.2 mg Fe/g tissue wt.) an immediate decrease is observed after the initial heating (right).
Supporting Figure S2: SARv as a function of iron concentration for the liver (left) and the spleen (right). For high concentrations of iron within both tissues, the linear fit obtains an underestimate of the SARv.
Supporting Table S1: SARFe & SARv:R1 Fitting Comparison within the liver and spleen.