Abstract
Hydrogel could serve as a matrix material of new classes of solar cells and photoreactors with embedded microfluidic networks. These devices mimic the structure and function of plant leaves, which are a natural soft matter based microfluidic system. These unusual microfluidic-hydrogel devices with fluid-penetrable medium operate on the basis of convective-diffusive mechanism, where the liquid is transported between the non-connected channels via molecular permeation through the hydrogel. We define three key designs of such hydrogel devices, having linear, T-shaped, and branched channels and report results of numerical simulation of the process of their infusion with solute carried by the incoming fluid. The computational procedure takes into account both pressure-driven convection and concentration gradient-driven diffusion in the permeable gel matrix. We define the criteria for evaluation of the fluid infusion rate, uniformity, solute loss by outflow and overall performance. The T-shaped channel network was identified as the most efficient one and was improved further by investigating the effect of the channel-end secondary branches. Our parallel experimental data on the pattern of solute infusions are in excellent agreement with the simulation. These network designs can be applied to a broad range of novel microfluidic materials and soft matter devices with distributed microchannel networks.
I. INTRODUCTION
Microfluidic systems embedded in soft porous media are a promising platform for applications such as flow reactors, drug delivery, bioscaffolds, and energy harvesting devices. The permeable channel walls or porous plugs in these microfluidic systems enable a broad range of functions that cannot be realized in conventional microfluidic devices with non-permeable materials. Many of these devices with permeable walls have hierarchical channel structure, where the interconnected microchannels or nanochannels in the porous material enable selective transport of gases and liquids or enhanced mixing by splitting and recombining incoming flows.1–4 Additionally, the high surface area of the porous media could be used to host reaction sites when the pore surfaces are functionalized, or the porous network is made of an active material itself.3,5–8 The porous sections can also act as filters, whose pore size can be tuned depending on the composition of the porous materials, the preparation process, or the external stimuli.3,9–13
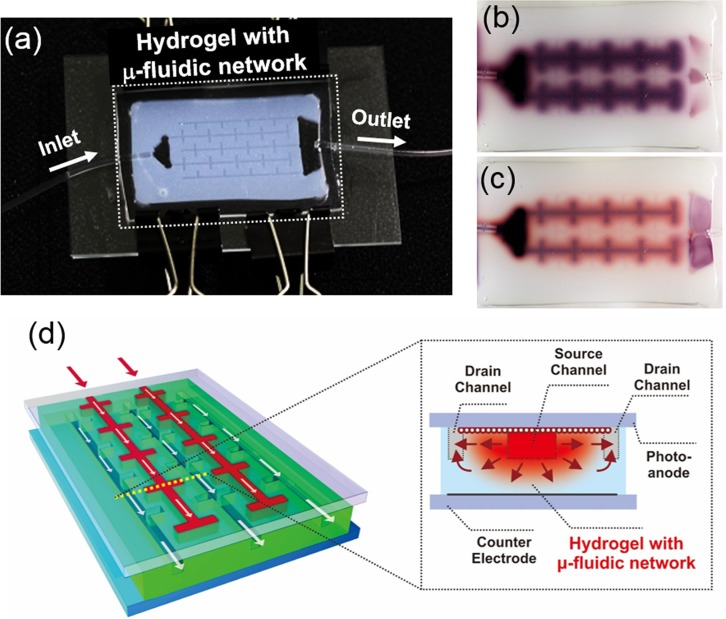
A hydrogel can serve as a novel medium for such microfluidic devices due to its high permeability and biocompatibility.14,15 Hydrogel based microfluidic systems for tissue engineering have been first reported by Stroock et al.16,17 The solutes are supplied via a rapid convective transport along the microfluidic channels embedded in hydrogels, whereas diffusion by concentration gradient is the dominant driving force for their delivery in the porous hydrogel. We have used the hydrogel-microfluidic matrices in demonstrating new classes of energy harvesting devices such as photoreactors18 and regenerable solar cells19 where gel-microfluidic network provides for a uniform and efficient supply and removal of reagents (Fig. 1). These devices mimic the structure and function of plant leaves, which are a natural hydrogel-like microfluidic system. The interdigitated channel design that we used is a rudimentary mimic of biological structures such as leaf venation network and blood vessel embedded tissue. The pressure gradient between the interdigitated source and drain channels drives the solute transport by convective flow in the channels, as well as diffusion of solutes in the gel media. The combination of these two transport mechanisms in the hydrogel-based microfluidic photoreactor and solar cell allowed supplying the dissolved reactants or light harvesting dye molecules rapidly and uniformly throughout the porous hydrogel media.
FIG. 1.
(a) A photograph of a prototype of the hydrogel-based microfluidic photoreactor with interdigitated branched channels. (b) Image of a typical pattern of dye infusion into the microfluidic hydrogel. (c) Subsequent image illustrating the photocatalytic degradation of the infused dye in the TiO2 embedded hydrogel reactor. Reproduced with permission from Koo and Velev, J. Mater. Chem. A 1, 11106 (2013). Copyright 2013 Royal Society of Chemistry.18 (d) A schematic of hydrogel photovoltaics with microfluidic supply-replenishment network. The inset on the right displays the cross section view across the dotted yellow line. The red arrows indicate the lateral diffusive/convective transport between the source channels and drain channels. Reproduced with permission from Koo and Velev, Sci. Rep. 3, 2357 (2013). Copyright 2013 Nature Publishing Group.19
The transport processes within such biomimetic devices are still incompletely understood, and the concrete principles of achieving efficient and directed solute transport and distribution within their cores are not established. Parametric criteria need to be defined to evaluate the efficiency of various channel designs in a particular application. Numerical simulations, where both convection and diffusion in porous media are taken into account, could help us gain a better understanding of the solute transport in new devices and identify the best channel structure for achieving the desired mass-transport goals. Here, we first present a simulation study comparing the fluid flows in various designs of hydrogel-microfluidic devices for efficient solute transport. Numerical criteria are defined to quantitatively evaluate how rapidly and efficiently (i.e., with minimum outflow loss), the solutes are transported in the channel designs. We first investigate how the parameters of basic interdigitated channels with a linear channel shape affect the solute supply. We then compare the T-shaped and branched channels to the linear channels to examine the effect of secondary channels branching off the primary ones. The relative dimensions of the channel designs are evaluated for a more efficient and uniform solute supply based on the efficiency criteria obtained from the simulations. Experimental results are compared with the model data to confirm the validity of the simulation procedure established in this report. The results establish the design routes of microfluidic systems based on other general porous media.
II. METHODS
A. Designs of the microfluidic channels embedded in hydrogel and numerical simulation
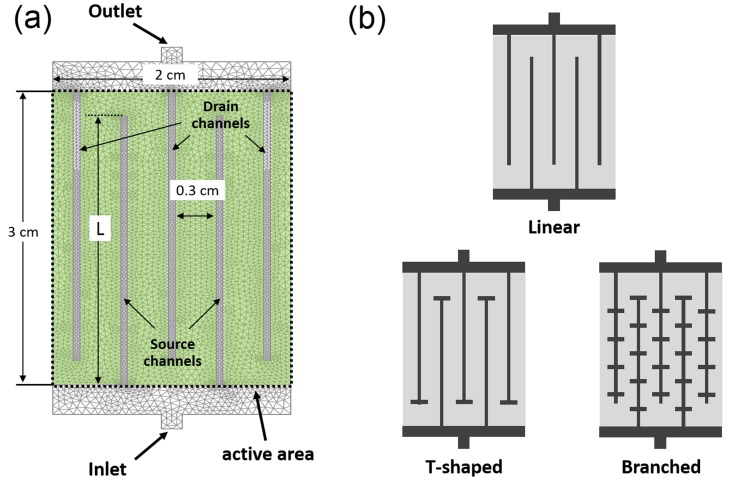
The goal of this study is to identify which simple channel designs make possible, rapid and efficient solute supply with minimum loss. The interdigitated channel structure is broadly similar to blood distribution in live tissues. The source and drain channels and the microscopic open pores are broadly analogous to arteries, veins, and capillaries, respectively. We previously reported that the channel interdigitation could enable a rapid and uniform solute supply.19 The numerical modelling of the solute distribution in porous gel devices with microfluidic channels was performed by using COMSOL Multiphysics simulation package (ver. 3.5, COMSOL Inc., Burlington, MA). The first straightforward design is the 2-D interdigitated channel structure shown in Scheme 1(a), which includes two source channels and three drain channels. We define the region covered with a porous gel as an “active area” where the solutes will be transported, adsorbed, catalysed, or subjected to other processing. Solute coverage and delivery efficiency (defined further down) are calculated within this area for parametric evaluation of the overall channel design characteristics. Its dimension is 2 cm × 3 cm. The channel width is 500 μm, and the gap between the channels is fixed by 0.3 cm. The channel length, L, is varied between 1.5 cm and 2.95 cm. The model follows how solutions are injected from the inlet, flow through the channel-embedded porous gel and drain to the outlet, driven by pressure difference between the inlet and the outlet. The transport of the solute is governed by combined convection and diffusion, the effect of both of which is captured by the following equation for convective-diffusive transport:
| (1) |
where c is the concentration of solute, D is the diffusion coefficient of the solute (3 × 10⁻¹⁰ m2/s, which is of the same order of magnitude as the value of large dye molecules in the literature,20 and is the velocity of fluid. The first and the second terms describe the mass fluxes driven by convection and diffusion, respectively. To calculate the velocity profiles of fluid determining the first term for the transport by convection, we used two different equations; Brinkman equation for the flow in the porous gel region (Eq. (2), green coloured area in Scheme 1(a)) and Navier-Stokes equation (Eq. (3)) for the flow in the channels.
| (2) |
| (3) |
| (4) |
where η is the viscosity of the solution (1 × 10⁻³ Pa s), ρ is its density (1 × 10³ kg/m3), k is the permeability of porous hydrogel (5.4 × 10⁻¹⁶ m2 for agarose hydrogel21), and εp is the gel porosity (0.98 for 2 wt. % agarose hydrogel21). The inlet boundary conditions are a constant pressure of 7 × 10³ Pa and solute concentration of 5 mol/m3. The outlet boundary conditions are no backpressure and convection-dominant transport with negligible diffusion (). All equations were used as predefined in the COMSOL simulation package. We identified three channel designs with different efficiencies and delivery rate; linear, T-shaped, and branched (Scheme 1(b)). We report and compare the results of time-dependent simulations for the convection and diffusion of solutes up to 7200 s (2 h), which as indicated by the data is the time needed to achieve a near steady-state distribution of the solute in all designs of the devices explored here.
SCHEME 1.
(a) A linear microfluidic design for finite element calculations. The light-green coloured domain has transport properties of porous hydrogel. The rectangle enclosed by the dotted lines indicates “active area” where solutes are targeted to be supplied. The uniformity of solute concentration and the efficiency of the device are evaluated within this area. (b) Three representative designs of porous microfluidic channels compared in this study (not drawn to scale).
B. Fabrication of the hydrogel based microfluidic devices
The devices were fabricated by the same procedures as in our previous publication.18 Briefly, the hot liquefied agarose aqueous solution (2 wt. %) was poured into a polydimethylsiloxane (PDMS) spacer on a patterned SU-8 mold and was cooled down to room temperature. The channel height was ∼500 μm. The patterned hydrogel with the spacer was peeled off from the mold and sandwiched by two glass substrates. Two pieces of Tygon tubes were inserted into the inlet and outlet of the device, and then the device was tightly clamped with binder clips. Aqueous solution of 0.1 M Allura Red dye was injected into the inlet tube with a syringe pump (NE-1600, New Era Pump Systems, Inc.).
III. RESULTS AND DISCUSSION
A. Definition of numerical parameters for evaluation of channel designs and results for solute transport in permeable gels with a linear channel design
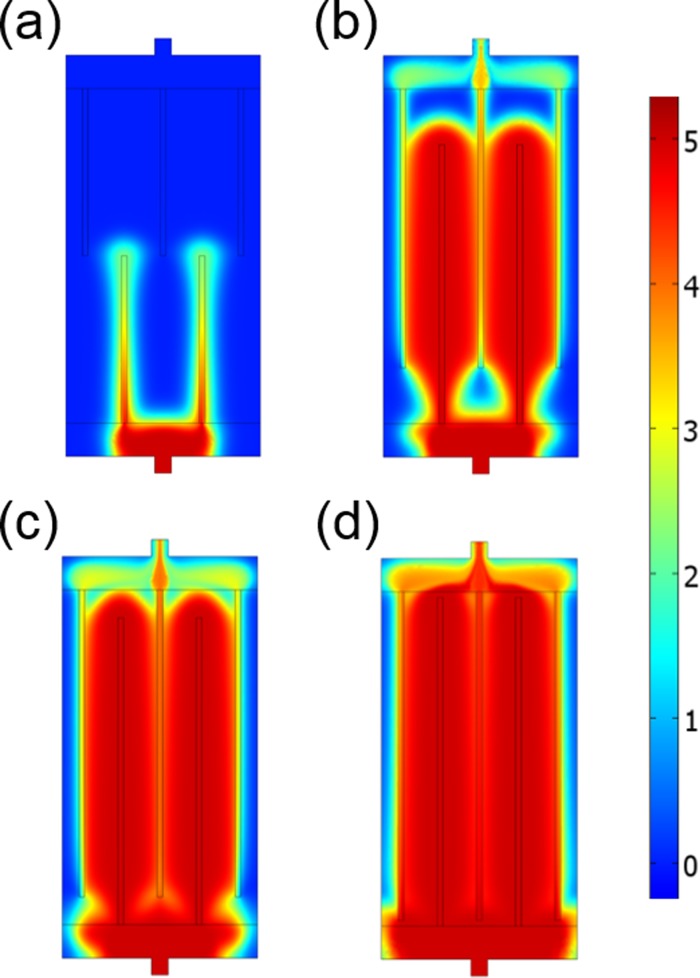
First, the effect of channel length relative to the length of the active area of the gel devices was investigated (Fig. 2). The images represent the solute concentration distribution at time t = 3600 s after solute injection. Qualitatively, the area infused with the solute at fixed infusion time increases as the length of the linear channels increases, which means a longer microfluidic channel exhibits a higher supply rate of the solute under an identical pressure. The resistance to flow is much higher in the porous gel media than in the channels. As the channel length increases, the solution can flow through larger areas of shorter pathways in the porous media, which reduces the flow resistance. A much less anticipated conclusion, however, is that when the channel length becomes too long, the efficiency of the solute supply decreases because of the large solute loss between the vertical microchannel ends and the large horizontal drain and source channels, which can be seen in the data in Fig. 2(d). Since the ends of the long microchannels get so close to the outlet collector channel, the vertical flow resistance at the microchannel ends is lower compared to the flow resistance in the perpendicular directions (See also the result for a solute distribution at 30 min in Fig. S1 in the supplementary material). As a result, a rapid solute outflow and loss occur at the end of the long channels, before the solute covers the active area uniformly.
FIG. 2.
Simulation results for color-mapped concentration at 3600 s in linear-microfluidic gel devices with different channel lengths. (a) 1.5 cm, (b) 2.5 cm, (c) 2.75 cm, (d) 2.95 cm. The data indicate that as the channel length increases, the rate of infusion increases, however, the efficiency plunges with too long channels. Images for the solute distribution calculated at more points in time are available in Fig. S1 in the supplementary material.
For numerical analysis of the solute supply as a function of time, we define the degree of coverage by
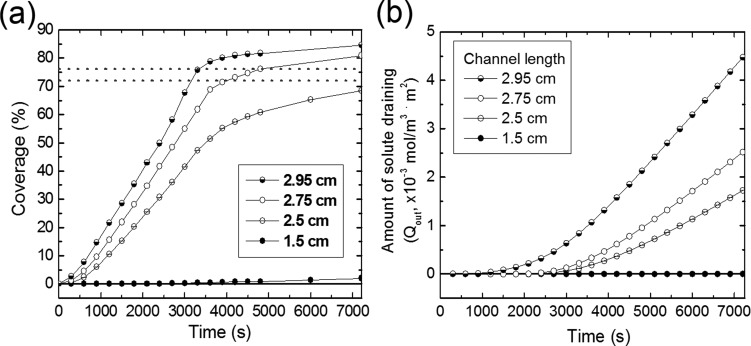
The covered area, i.e., the numerator in the equation above, was obtained by counting the number of pixels for a solute concentration higher than 80% of one of the injected solution (4 mol/m3) from the images of the simulation result as shown in Fig. 2. The degree of solute coverage of the active area as a function of time is plotted in Fig. 3(a). As expected, the increasing rate of coverage becomes larger as the channel length increases. The device with a 1.5 cm channel length shows negligible coverage within our maximum simulation time range of 7200 s. The slopes of other three graphs decrease drastically around 3500 s, which is associated with the onset of dominant solute loss through the drain channel. The amount of solute draining from the microfluidic device, Qout, which is plotted in Fig. 3(b), is obtained by
where Fin and Qdevice are the average molar flow rate and the solute amount in the device, respectively. Both values were obtained using the simulation routine. “Fin × t” is the total solute amount supplied until the given time, t. At around 3500 s, the solute reaches the outlet and begins to flow out, which would amount to a solute loss if the active area is not completely infused.
FIG. 3.
(a) Degree of solute penetration of the linear-microfluidic gel devices with different channel lengths as a function of time. Two horizontal dotted lines represent 72% and 76% of coverage in the active area. (b) Amount of solute draining (loss) from the devices in (a) as a function of time. Note that the longer channels achieving rapid surface coverage leads to earlier loss of the solute carried out by the liquid exiting the device outlet.
To quantitatively evaluate how rapidly the solute is supplied depending on the channel lengths, Tcoverage(%), the time required for a given coverage of the solute in the active area is compared. In the interdigitated network design, the flow of the injected solutions appears dominantly within the two outermost drain channels. The maximum coverage in “pseudo-steady state,” as shown in Fig. 2(d), is around 80% of the total active area. Based on this value, we selected the target criteria for coverage to be 72% and 76%, which are equivalent to 90% and 95% of the pseudo-steady state maximum coverage (i.e., 80%), respectively. The results for the times needed to attain T72% and T76% of the hydrogel microfluidic devices with various channel lengths are summarized in Table I. The devices with channel lengths of less than 2.5 cm do not achieve 72% solute coverage within 7200 s. The device with the 2.95 cm channels exhibits 20%–30% shorter T72% and T76% than that with the 2.75 cm channels because of lower resistance to flow in the porous gel media between the long channels as discussed. It is also confirmed that the rate of the solute inflow increases as the channel length increases (Table I). Thus, the longer microfluidic channel can achieve a more rapid supply of the solute in the linear-channel structure.
TABLE I.
Summary of the numerical evaluation of the inflow molar rate (Fin) and the efficiency of the linear channel-embedded hydrogel devices with different channel lengths based on required time (T), amount of solute draining (Qout), and efficiency for 72% and 76% of coverage. The graphs of the efficiencies as a function of time are shown in Fig. S2 in the supplementary material. The Qout and efficiency for the channel lengths of 1.5 cm and 2.5 cm are not displayed because the 72% and 76% coverage criteria are not achieved within 7200 s (indicated by “n/a”).
| Channel length | Fin (×10−7 mol·m−1·s−1) | For 72% coverage | For 76% coverage | ||||
|---|---|---|---|---|---|---|---|
| T72% | Qout (×10−4 mol·m−1) | Efficiency (%) | T76% | Qout (×10−4 mol·m−1) | Efficiency (%) | ||
| 1.5 cm | 1.0 | ≫7200 | n/a. | n/a | ≫7200 | n/a | n/a |
| 2.5 cm | 6.0 | ≫7200 | n/a. | n/a | ≫7200 | n/a | n/a |
| 2.75 cm | 7.5 | 4000 | 5.2 | 70 | 4790 | 9.5 | 62 |
| 2.95 cm | 10.4 | 3160 | 7.4 | 65 | 3320 | 8.6 | 63 |
The high rapid infusion rate criterion alone is not sufficient for evaluation of the practical operation of such devices. It is also important to characterize how efficiently the solute can be distributed into the active area with minimum loss through the outlet. We define the efficiency of a channel design by
where Qactive is the solute amount in the active area of the gel. It is noted that the difference between the denominator and the numerator would be almost equal to Qout, i.e., the amount of the solute that has passed through the device and has flown out through the drain channel. The efficiencies of the linear channel-embedded hydrogels at T72% and T76% are compared in Table I. These data reveal complex correlations between the rate of infusion and device efficiency. Of the two devices achieving >72% coverage within 7200 s, the one with the 2.75 cm channels has a higher efficiency than that with the 2.95 cm channels, whereas, for the 76% coverage, the efficiency of the device with the 2.95 cm channels is slightly higher than that of the device with 2.75 cm. Fig. 3(b) reveals that the outflow of the solute in the 2.95 cm channel design begins much earlier than in the design with 2.75 cm long channels (∼1000 s vs. ∼2500 s). However, the Qout in the 2.75 cm channel design significantly increases from 5.2 × 10⁻⁴ mol/m at T72% (4000 s) to 9.5 × 10⁻⁴ mol/m at T76% (4790 s) and becomes even larger than that in the 2.95 cm channel design at T76%. Thus, the efficiency of the solute supply can vary depending on the target criteria for coverage as well as channel designs. In the next round of research, we set the 76% coverage as a target coverage, in which case the 2.95 cm channel design shows the highest rate of solute supply with highest efficiency.
B. Effect of the secondary channel branches on the rate and efficiency of solute supply
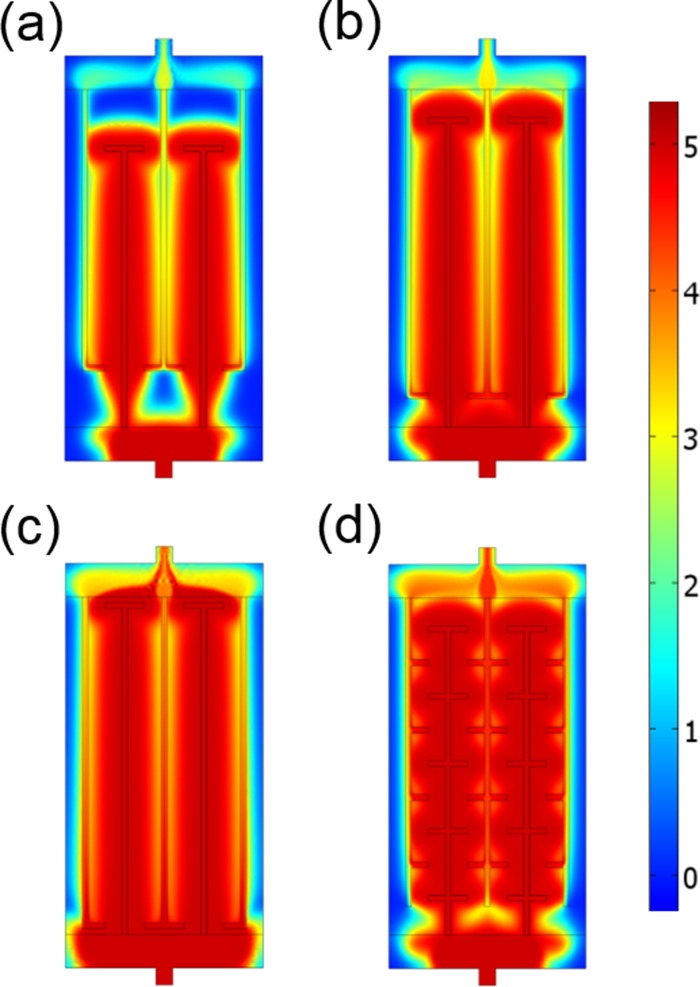
The analysis of the simple channel designs in Fig. 2 points out that the ends of the channels are the major origin of flow inhomogeneity and solute loss. This problem could be addressed by a geometric correction of the shape at the end of the source channels to facilitate the uniform lateral solute transport in this region. After sampling of a few configurations, we identified one simple solution for achieving better solute distribution—the use of T-shaped channels, where a pair of short lateral branches is added at the channel ends. We simulated the solute transport in such devices with T-shaped channels while varying the length of the primary channels (Figs. 4(a)–4(c)). It should be noted that the solute coverage in these designs with T-shaped channels at 2700 s is comparable to that of the linear channels at 3600 s in Fig. 2, which qualitatively confirms that the secondary branches of the T-shaped channels contribute to the rapid solute supply.
FIG. 4.
(a)–(c) Simulation results for color-mapped concentration at 2700 s in T-shaped hydrogel devices with different channel lengths. (a) 2.5 cm, (b) 2.75 cm, and (c) 2.95 cm. (d) Simulation result for solute distribution at 2700 s in a microfluidic device with hydrogel-embedded branched channels. The channel length is 2.75 cm. The length of the secondary branches perpendicular to the primary channels is 1.5 mm in all designs. The images reveal sources of inhomogeneities and leakiness during the solute infusion.
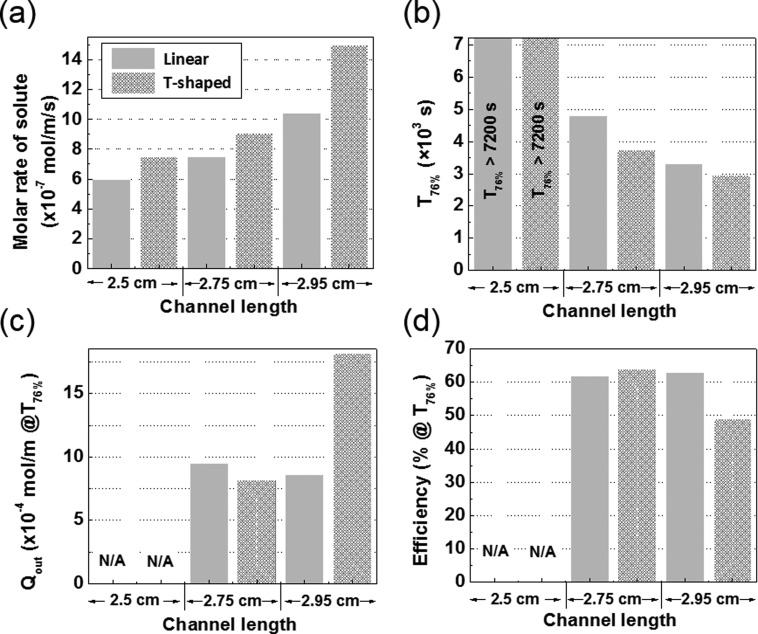
The numerical simulation results for the linear and the T-shaped channel device designs as a function of the primary channel length are compared in Fig. 5. The T-shaped design achieves a higher molar rate and, therefore, shorter T76% than the linear design at all channel lengths. The T-shaped design also has a slightly higher efficiency at T76% than the linear design at 2.75 cm channel length. However, the T76% efficiency of the T-shaped design drastically decreases at 2.95 cm channel length as a result of the large loss of the solute at the channel terminals that are close to the exit channel as shown in Fig. 4(c). Thus, the T-shaped channel enables a more rapid supply of the solute than the linear channel design at the same channel length and shows the maximum efficiency of solute supply with a channel length of 2.75 cm.
FIG. 5.
Comparison of linear and T-shaped channel design data in terms of (a) the molar injection rate of solute, (b) the time for which 76% solute coverage is achieved, (c), (d) the solute loss and the efficiency at T76% as a function of the length of primary channels.
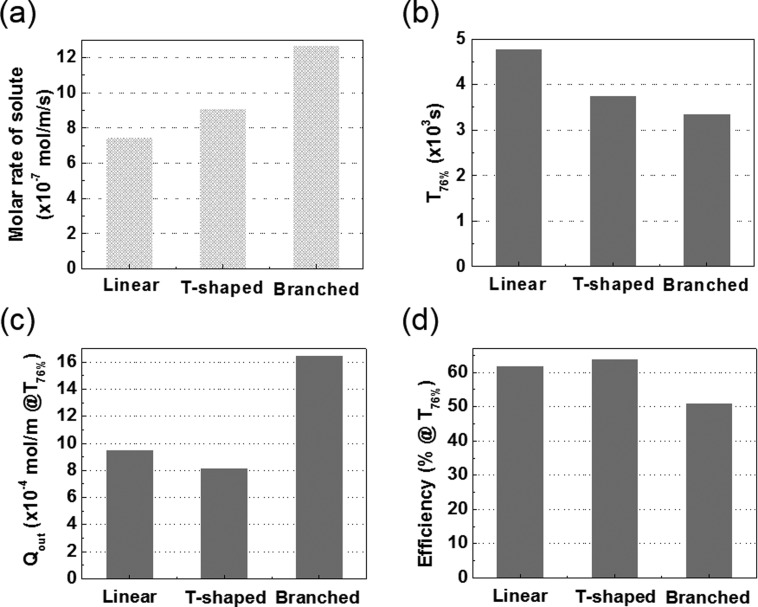
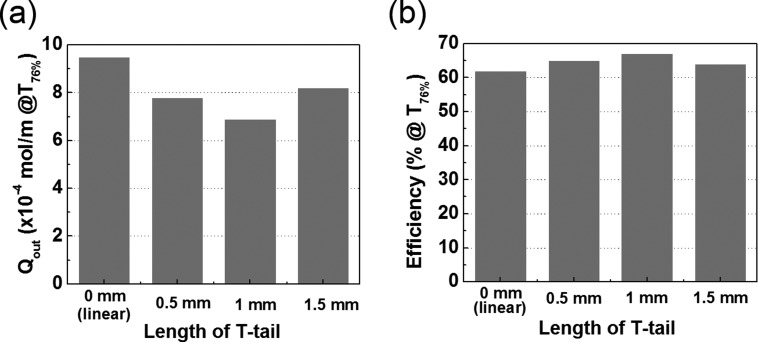
The results are of broad interest to the field of biomimetic structure design. The vascular fluid and nutrients supply system in many natural leaves consists of a hierarchical network of primary vein and many secondary veins branching off the primary one.22 The hierarchical structure of the veins appears to be Nature's way to achieve a uniform and efficient supply of water and minerals. To partially mimic the structure of such branched vascular microfluidic system, we performed simulations with the simple branched design shown in Fig. 2(b) and compared the results to the linear and the T-shaped ones. The branched design has five pairs of secondary channels per source primary channel and four pairs of secondary channels per drain primary channel. The channel length was fixed at 2.75 cm, where the T-shaped design shows the most efficient supply of the solute in Fig. 5(d). Fig. 4(d) shows the simulated concentration profile of the solute in the device with the branched channels at 2700 s, where the solute appears to be distributed more uniformly than in the linear and the T-shaped devices (Figs. 2(c) and 4(b)). The numerical parameters of the three designs are compared in Fig. 6. The branched design has the highest molar rate, thereby achieving the 76% coverage most rapidly among the three designs. The efficiency of the branched design at T76%, however, turned out to be more than 10% lower than those of the linear and the T-shaped designs due to the significant loss that is seen in Fig. 6(c). Thus, the T-shaped design was identified as the most efficient one under the stringent efficiency criteria defined. It was optimized further by investigating the effect of the length of the secondary branches on the efficiency at T76% (Figs. 7 and S3 in the supplementary material). We established that the optimized branch length of the perpendicular part of the T-shaped channel is 1 mm where the solute could be supplied most efficiently to 76% coverage.
FIG. 6.
Comparison of microfluidic devices with linear, T-shaped, and branched channels in terms of (a) the molar injection rate of solute, (b) the time for achieving 76% solute coverage, (c), (d) the solute loss and efficiency at T76%. The primary channel length is 2.75 cm in all devices.
FIG. 7.
The effect of the length of secondary branches in T-shaped channel design on the solute loss and the device efficiency at T76%.
It should be noted that Péclet number is an important parameter to determine if the simulation results reported here are valid in similar hydrogel-based or porous microfluidic systems. Péclet number, Pe, is the dimensionless number representing the ratio of convective transport rate to diffusive transport rate, which could be obtained from the simulation procedure. Pe increases as the device dimensions, the inlet pressure and the permeability of gel increases or the diffusivity of solute decreases. The influence of channel design on the solute supply becomes less important at low Pe number condition, i.e., when the diffusive transport of solute is more dominant than the convective one. All the simulation results discussed above are for devices where Pe ranges from 2–4, which means that the convection-driven transport is comparable to the diffusion-driven one. Further simulation (Fig. S4 in the supplementary material) reveals that, at low Pe condition in the gel media (Pe ≲ 0.4), the “isotropic” solute transport by diffusion mechanism is more dominant than the “guided” transport by convection, resulting in subtle differences in solute distribution regardless of the channel designs. At a high Pe condition (Pe > 10), the solute transport is largely affected by the channel design, similar to the results reported in this paper. All in all, our study will give a reasonable guideline for optimizing channel designs at the condition of Pe > 1 in the porous gel area.
C. Comparison of simulation results and experimental data for solute transport in microfluidic hydrogels
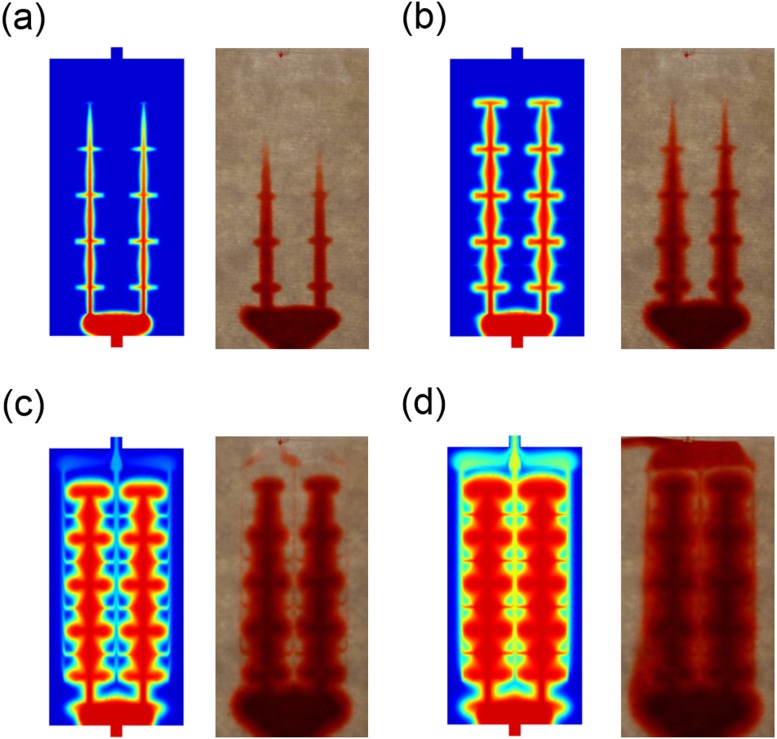
The major goal of this study was to understand the role of channel design and branching in developing new microfluidic-hydrogel devices. This is achieved largely by the computational procedure described above. In order to verify our conclusions, we also investigated whether these simulations present an accurate description of a real hydrogel-based system. To evaluate the validity of the simulation data, we followed colorimetrically the dye transport in a prototype of the microfluidic device based on hydrogels. Microfluidic channels with the branched design in Fig. 4(d) were formed in the hydrogel by replica molding as described in Section II. Aqueous solution of 0.1 M Allura Red dye was injected at a constant flow rate of 10 μl/min. The flow rate under the pressure of 7 × 10³ Pa, corresponding to the inlet boundary condition for the simulation, was ∼8 μl/min. The penetration of the dye solution was followed by optical imaging. The dye distribution profiles imaged at 5, 10, 20, and 30 min after the dye injection are compared with the corresponding simulation results in Fig. 8. The temporal distribution of the dye of the experimental data is in excellent agreement with that of the simulation, which confirms that the solute transport through the microvascular gels can be reasonably predicted by using the simulation procedure established in this study. The slight mismatch between the experiment and the simulation in Fig. 8(b) may result from the difference between the estimated values used in the simulation (e.g., the permeability in the gel and the diffusion coefficient of the dyes) and the real ones. Those properties may be affected by some degree of tortuosity, pore uniformity, molecular affinity to the gel medium, and other effects.
FIG. 8.
Comparison of simulation and experimental results for time-lapse dye transport in hydrogel microfluidic devices. (a) 5 min, (b) 10 min, (c) 20 min, and (d) 30 min after injection of the dye solution. The results demonstrate an excellent agreement between the convective–diffusive simulation and the dye infusion profiles in actual hydrogel devices.
IV. GENERAL DISCUSSION AND CONCLUSIONS
Microfluidic devices with channel networks embedded in semipermeable hydrogel form a new class of biomimetic structures that can find a range of applications in harvesting solar energy, photocatalysis, biological separations, design of new types of responsive “smart” materials, and others.5,14–19,23–26 The results of the simulations reported above demonstrate that the solute transport in a biomimetic hydrogel with microvascular network is carried out by a combination of convective flow in the channels and convective-diffusive transport through the surrounding hydrogel matrix. We have defined a set of parameters that make possible the quantitative evaluation of the rate of infusion and efficiency of channel designs, which include Tcoverage% (the required time for a given coverage), Qout (the amount of solute draining till a given time), and efficiency. The comparative study of the linear and the T-shaped channels under the constant inlet pressure (7 × 10³ Pa) reveals that the T-shaped channel design could enable a more rapid and efficient supply of solutes than the simple linear one. The high efficiency of this design possibly arises because the short channels terminating the T-junction allow distributing more evenly the solute reaching the vertical channel ends, which would otherwise be lost rapidly in the nearby drain channel. These T-shaped channels, which we identified as the most efficient design, were optimized further by varying the length of the secondary branches.
The interdigitated channel design in Fig. 4(d) is inspired by natural hierarchical channel structures, such as a blood vessel system and leaf venation networks. To mimic the leaf venation structure in nature, we designed a network of uniformly branching secondary channels. Interestingly, when this structure was compared with the linear and the T-shaped ones, it turned out that these branched channels enable not only the most rapid, but also the most inefficient, solute supply. The inefficiency appears to result from the loss of the solute at the multiple branched channel termination points. In this regard, it appears that the natural venation networks are “designed” for a rapid and redundant water and metabolite supply, which as we show, is best achieved with this type of network. It has been revealed that the venation architecture of natural leaves has been evolved for high water conductance.27–29
The experimental data of a soluble dye transport in a prototype hydrogel-microfluidic device are in excellent agreement with the simulation results, which proves the validity of the model and computational procedures used in this report. We hope that exemplifying and rationalizing the fluid and solute transport in biomimetic microfluidic structures such as the hydrogel-microfluidic devices studied here would allow further progress in this emerging multidisciplinary area of research and future technologies. The model allows a rapid evaluation of the effect of other key parameters in this class of devices, including, e.g., dimensions, channel size ratios, diffusivity, permeability, or porosity. The next stage in this research would entail adding a chemical or biological (photo)reactivity component with the hydrogel matrix (as in our photoreactive leaf-like devices reported earlier, Refs. 18 and 19) that would make the “artificial leaf” operational in a steady state conversion. For now, we demonstrate that the common numerical modelling of flow in porous media based on Brinkman equation describes excellently the real fluid flow in such devices. The simulation procedure and the numerical analysis, combined with the insight and criteria from this report can be used in the future design of microfluidic materials and devices ranging from continuous reactors to solar- or fuel-cells and drug delivery systems.19,30
V. SUPPLEMENTARY MATERIAL
See supplementary material for more graphical and numerical data from the simulations.
ACKNOWLEDGMENTS
We gratefully acknowledge the support of this work provided by the U.S. National Science Foundation through the Research Triangle MRSEC on Programmable Soft Matter (DMR-1121107) and Basic Science Research Program through the National Research Foundation of Korea (NRF) funded by the Ministry of Education (NRF-2015R1D1A1A01056812). Partial support from the U.S. Department of Energy (08NT0001925) is also acknowledged.
References
- 1. Yuen P. K. and DeRosa M. E., Lab Chip , 3249 (2011). 10.1039/c1lc20157c [DOI] [PubMed] [Google Scholar]
- 2. Yuen P. K., Su H., Goral V. N., and Fink K. A., Lab Chip , 1541 (2011). 10.1039/c0lc00660b [DOI] [PubMed] [Google Scholar]
- 3. Simms H. M., Brotherton C. M., Good B. T., Davis R. H., Anseth K. S., and Bowman C. N., Lab Chip , 151 (2005). 10.1039/b412589d [DOI] [PubMed] [Google Scholar]
- 4. Kendall E. L., Wienhold E., Rahmanian O. D., and DeVoe D. L., Sens. Actuators, B , 866 (2014). 10.1016/j.snb.2014.06.023 [DOI] [PMC free article] [PubMed] [Google Scholar]
- 5. Kjeang E., Michel R., Harrington D. A., Djilali N., and Sinton D., J. Am. Chem. Soc. , 4000 (2008). 10.1021/ja078248c [DOI] [PubMed] [Google Scholar]
- 6. Salloum K. S., Hayes J. R., Friesen C. A., and Posner J. D., J. Power Sources , 243 (2008). 10.1016/j.jpowsour.2007.12.116 [DOI] [Google Scholar]
- 7. Chueh B., Huh D., Kyrtsos C. R., Houssin T., Futai N., and Takayama S., Anal. Chem. , 3504 (2007). 10.1021/ac062118p [DOI] [PMC free article] [PubMed] [Google Scholar]
- 8. Peterson D. S., Rohr T., Svec F., and Fréchet J. M. J., Anal. Chem. , 4081 (2002). 10.1021/ac020180q [DOI] [PubMed] [Google Scholar]
- 9. Moorthy J. and Beebe D. J., Lab Chip , 62 (2003). 10.1039/b300450c [DOI] [PubMed] [Google Scholar]
- 10. de Jong J., Ankone B., Lammertink R. G. H., and Wessling M., Lab Chip , 1240–1247 (2005). 10.1039/b509280a [DOI] [PubMed] [Google Scholar]
- 11. Valiei A., Kumar A., Mukherjee P. P., Liu Y., and Thundat T., Lab Chip , 5133 (2012). 10.1039/c2lc40815e [DOI] [PubMed] [Google Scholar]
- 12. Foote R. S., Khandurina J., Jacobson S. C., and Ramsey J. M., Anal. Chem. , 57 (2005). 10.1021/ac049136w [DOI] [PubMed] [Google Scholar]
- 13. Yu C., Davey M. H., Svec F., and Fréchet J. M. J., Anal. Chem. , 5088 (2001). 10.1021/ac0106288 [DOI] [PubMed] [Google Scholar]
- 14. Bettinger C. J. and Borenstein J. T., Soft Matter , 4999 (2010). 10.1039/c0sm00247j [DOI] [Google Scholar]
- 15. Huang G., Zhang X., Xiao Z., Zhang Q., Zhou J., Xu F., and Lu T. J., Soft Matter , 10687 (2012). 10.1039/c2sm26126j [DOI] [Google Scholar]
- 16. Cabodi M., Choi N. W., Gleghorn J. P., Lee C. S. D., Bonassar L. J., and Stroock A. D., J. Am. Chem. Soc. , 13788 (2005). 10.1021/ja054820t [DOI] [PubMed] [Google Scholar]
- 17. Choi N. W., Cabodi M., Held B., Gleghorn J. P., Bonassar L. J., and Stroock A. D., Nat. Mater. , 908 (2007). 10.1038/nmat2022 [DOI] [PubMed] [Google Scholar]
- 18. Koo H.-J. and Velev O. D., J. Mater. Chem. A , 11106 (2013). 10.1039/c3ta12483e [DOI] [Google Scholar]
- 19. Koo H.-J. and Velev O. D., Sci. Rep. , 2357 (2013). 10.1038/srep02357 [DOI] [PMC free article] [PubMed] [Google Scholar]
- 20. Zanarini S., Rampazzo E., Ciana L. D., Marcaccio M., Marzocchi E., Montalti M., Paolucci F., and Prodi L., J. Am. Chem. Soc. , 2260 (2009). 10.1021/ja8077158 [DOI] [PubMed] [Google Scholar]
- 21. Johnson E. M. and Deen W. M., AIChE J. , 1220 (1996). 10.1002/aic.690420504 [DOI] [Google Scholar]
- 22. Roth-Nebelsick A., Uhl D., Mosbrugger V., and Kerp H., Ann. Bot. , 553 (2001). 10.1006/anbo.2001.1391 [DOI] [Google Scholar]
- 23. Johnson E. M., Berk D. A., Jain R. K., and Deen W. M., Biophys. J. , 1561 (1995). 10.1016/S0006-3495(95)80328-0 [DOI] [PMC free article] [PubMed] [Google Scholar]
- 24. Ling Y., Rubin J., Deng Y., Huang C., Demirci U., Karp J. M., and Khademhosseini A., Lab Chip , 756 (2007). 10.1039/b615486g [DOI] [PubMed] [Google Scholar]
- 25. Cheng S.-Y., Heilman S., Wasserman M., Archer S., Shuler M. L., and Wu M., Lab Chip , 763 (2007). 10.1039/b618463d [DOI] [PubMed] [Google Scholar]
- 26. Ucar A. B. and Velev O. D., Soft Matter , 11232 (2012). 10.1039/c2sm26635k [DOI] [Google Scholar]
- 27. Boyce C. K., Brodribb T. J., field T. S., and Zwieniecki M. A., Proc. R. Soc. B , 1771 (2009). 10.1098/rspb.2008.1919 [DOI] [PMC free article] [PubMed] [Google Scholar]
- 28. Brodribb T. J., field T. S., and Sack L., Funct. Plant Biol. , 488 (2010). 10.1071/FP10010 [DOI] [Google Scholar]
- 29. Hu L., Zhou H., Zhu H., Fan T., and Zhang D., Soft Matter , 8442 (2014). 10.1039/C4SM01413H [DOI] [PubMed] [Google Scholar]
- 30. Koo H.-J. and Velev O. D., Biomicrofluidics , 031501 (2013). 10.1063/1.4804249 [DOI] [PMC free article] [PubMed] [Google Scholar]
Associated Data
This section collects any data citations, data availability statements, or supplementary materials included in this article.
Supplementary Materials
See supplementary material for more graphical and numerical data from the simulations.


