

ABSTRACT
Skeletal muscle is the dominant executant in locomotion and regulator in energy metabolism. Embryonic myogenesis and postnatal muscle growth are controlled by a cascade of transcription factors and epigenetic regulatory mechanisms. MicroRNAs (miRNAs), a family of non-coding RNA of 22 nucleotides in length, post-transcriptionally regulates expression of mRNA by pairing the seed sequence to 3′ UTR of target mRNA. Increasing evidence has demonstrated that miRNAs are important regulators in diverse myogenic processes. The profiling of miRNA expression revealed that miR-432 is more enriched in the longissimus dorsi of 35-day-old piglets than that of adult pigs. Our gain of function study showed that miR-432 can negatively regulate both myoblast proliferation and differentiation. Mechanically, we found that miR-432 is able to down-regulate E2F transcription factor 3 (E2F3) to inactivate the expression of cell cycle and myogenic genes. We also identified that phosphatidylinositol 3-kinase regulatory subunit (P55PIK) is another target gene of miR-432 in muscle cells. downregulation of P55PIK by miR-432 leads to inhibition of P55PIK-mediated PI3K/AKT/mTOR signaling pathway during differentiation. The blocking effect of miR-432 on this pathway can be rescued by insulin treatment. Taken together, our findings identified microRNA-432 as a potent inhibitor of myogenesis which functions by targeting E2F3 and P55PIK in muscle cells.
KEYWORDS: E2F3, microRNA-432, myogenesis, P55PIK, PI3K/Akt/mTOR pathway
Introduction
Skeletal muscle is a major organ in maintaining homgeostasis1-3 During the formation of skeletal muscle, muscle progenitors expand, migrate, and differentiate into myoblasts, which express muscle lineage-specific genes and eventually fuse to generate multi-nucleated myotubes, The maturation of myotubes finally give rise to contractive skeletal myofibers.4 This clearly staged process is tightly controlled by a group of myogenic regulatory factors (MRFs), including myogenic factor 5 (Myf5), myoblast determination protein (MyoD), musclespecific regulatory factor 4 (MRF4; also known as MYF6) and myogenin (MyoG).5-7 Structural and functional normality of skeletal muscles constitute the precondition for a healthy life,8,9 and this accentuates the importance of a better understanding on skeletal muscle developmental processes and the related molecular mechanisms.
MiRNAs are a class of non-coding RNAs which regulate the stability or translational capacity of target genes at post-transcriptional level by targeting to the 3′ UTR of mRNAs.10 It's previously reported that skeletal muscle-specific knockout of Dicer, a key enzyme for pre-miRNA maturation, resultes in reduced muscle mass and abnormal skeletal muscle formation in mice, which suggests that miRNAs have a critical functions in the development of skeletal muscle.11 Some miRNAs present in skeletal muscle are actually muscle-specific, which include miR-1, miR-133, and miR-206,12-15 and skeletal muscle is also enriched with many ubiquitously expressed miRNAs, such as miR-139-5p and miR-2916,17 etc. Both muscle-specific and ubiquitous miRNAs are identified with critical roles in myogenesis. However, the functionally explored miRNAs hitherto only account for a small group compared to the large number of miRNAs expressed during myogenesis. Further studies are required to gain a comprehensive view on how miRNA network regulates myogenesis.
MiR-432 is identified in our previous high-throughput sequencing. We observed dramatic decrease of miR-432 level in longissimus dorsi after pigs reach adulthood. Previous studies on miR-432 have been focused on its role in tumorigenesis (eg. neuroblastoma and schizophrenia).18-20 Recent, studies showed that downregulation of miR-432 is also involved in Wnt/β-catenin signaling activation to promote human hepatocellular carcinoma cell proliferation.19 However, to our knowledge, there is no reported functions on miR-432 during myogenesis. In this paper, we demonstrated that miR-432 can inhibit myoblast proliferation by down-regulating E2F3 and P55PIK expression levels while it also suppresses myogenic differentiation by blocking P55PIK-mediated PI3K/Akt/mTOR signaling pathway.
2F3, a family member of E2F transcriptional factors, plays a crucial role in controlling of cell cycle and act as a tumor suppressor proteins.21 Importantly, E2F3 can promote myogenic differentiation.22 PI3-kinase is one of the primary signaling pathways leading to skeletal muscle differentiation; inhibition of PI3K blocks the differentiation program of rat and mouse skeletal muscle cell lines.23 PI3K was divided into four different classes: class I, class II, class III, and class IV. class I PI3Ks are heterodimers with a regulatory subunit and a catalytic subunit.24 P55PIK, playing an important role in PI3K/Akt-mediated biological processes,25,26 could interact with cell cycle modulators such as retinoblastoma protein (Rb)27 to promote cell cycle progression in leukemia cells28 and other cancer cells.29 During apoptosis, P55PIK undergoes cleavage by Caspase 6 (C6), and degenerated P55PIK will be dislocated in cells and cause cell cycle defects.30 As a downstream effector and regulator of Akt,31,32 mTOR molecule regulates mRNA translation, metabolism and autophagy to affect cell growth. Recently, significant advances have been made in understanding mTOR controlling protein synthesis using pharmacological and genetic manipulation in cellular and rodent models.33,34 Moreover, insulin was known as the major hormone controlling critical energy metabolism. Insulin activated the insulin receptor tyrosine kinase (IR), which phosphorylated and recruited different substrate adaptor.35,36 Tyrosine phosphorylated IRS displayed binding sites for numerous signaling partners. Among them, PI3Ks played a major role in insulin functions, mainly via the activation of Akt/PKB cascade.37 However, regulation of P55PIK by miRNA and how miR-432 responded to insulin stimuli to regulate myogenesis are still poorly known.
Here, we provide compelling evidence suggesting a negative role of miR-432 in both myoblast proliferation and differentiation. The target genes of miR-432 we identified, E3F3 and P55PIK, have well-established functions in cell proliferation and myogenesis, which support a model where miR-432 regulates myogenesis through inhibiting E2F3 and PI3K pathway.
Results
miR-432 acts as a candidate regulator in myogenesis
To identify the novel miRNA regulation myoblasts myogenesis, we performed miRNA high throughput sequencing using longissimus dorsi of Rongchang pigs on 35-day-old and 287-day-old (Fig. 1A, Table 1). Rongchang pig, one of Chinese indigenous pig breeds, is famous at its good meat quality. Interestingly, miR-432 showed 7-fold expression change in 287-day old adult pig than 35-day old weaned piglet among the highly conserved miRNAs (Fig. 1B). Indeed, the qPCR result confirmed expression of miR-432-5p with a significant difference between weaned piglet and adult pig (Fig. 1C). Furthermore, Sequence alignment of mature miR-432-5p among multiple species, including mice, pig, human, macaca mulatta, pan troglodytes and ovis aries, showed that miR-432 was highly conserved in seed sequence (Fig. 1D), which indicated that the role of miR-432 on mice was probably same as that in pig. Hence, miR-432 was screened as a novel potential regulator in myogenesis.
Figure 1.
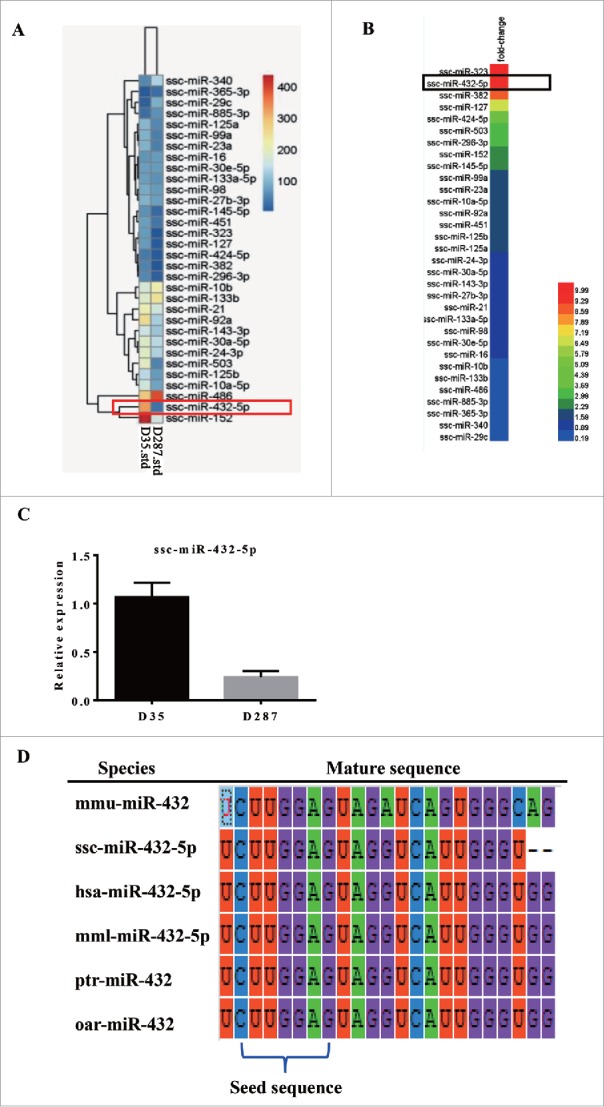
MiR-432 is a candidate regulator in myogenesis. (A) The partial microRNA sequencing results of longissimus dorsi from 35-day-old weaned Rongchang piglets and 287-day-old adult Rongchang pigs, respectively. Different colors represented the relative expression. (B) The fold change of miRNAs in 1A. (C) Relative expression of miR-432-5p in 35-day-old piglets and 287-day-old pigs by real time quantitative PCR (RT qPCR). Each treatment was carried out in triplicate and repeated 3 times. Data were representative of means ± SD. (D) Comparation of miR-432 seed sequence from mice, pig, human, macaca mulatta, pan troglodytes and ovis aries.
Table 1.
The normalized expression of miRNAs from longissimus dorsi of D35 Rongchang piglets and D287 pigs were listed.
| miR-name | D35-std | D287-std | log2 RLA/RLW | p-value |
|---|---|---|---|---|
| ssc-miR-10a-5p | 163.5404 | 80.3723 | −1.0248768 | 1.0752E-144 |
| ssc-miR-10b | 172.7317 | 215.3824 | 0.31836749 | 8.52574E-25 |
| ssc-miR-125a | 103.7969 | 57.0888 | −0.86248371 | 9.54414E-70 |
| ssc-miR-125b | 141.2585 | 73.6534 | −0.93951365 | 1.2563E-108 |
| ssc-miR-127 | 71.488 | 10.7755 | −2.72994628 | 5.1186E-251 |
| ssc-miR-130b | 10.6304 | 2.8735 | −1.88731493 | 3.37479E-25 |
| ssc-miR-133a-5p | 77.662 | 64.1879 | −0.2749075 | 7.41258E-08 |
| ssc-miR-143-3p | 160.848 | 122.1219 | −0.39737606 | 5.83134E-28 |
| ssc-miR-145-5p | 65.8711 | 26.8753 | −1.29336478 | 1.70318E-85 |
| ssc-miR-152 | 437.2838 | 167.9704 | −1.38036288 | 0 |
| ssc-miR-16 | 69.5383 | 70.7377 | 0.02467151 | 0.631443806 |
| ssc-miR-21 | 210.1005 | 161.7164 | −0.3776136 | 6.86157E-33 |
| ssc-miR-23a | 97.9943 | 47.074 | −1.05776739 | 4.83894E-92 |
| ssc-miR-24-3p | 191.7178 | 131.2916 | −0.54620967 | 7.0078E-58 |
| ssc-miR-27b-3p | 99.9904 | 76.1043 | −0.39381162 | 1.03171E-17 |
| ssc-miR-296-3p | 55.8442 | 15.804 | −1.8211177 | 2.4097E-119 |
| ssc-miR-29c | 18.0577 | 95.3311 | 2.40033279 | 6.6563E-282 |
| ssc-miR-30a-5p | 189.304 | 142.7009 | −0.40771046 | 3.98374E-34 |
| ssc-miR-30e-5p | 77.3834 | 72.1322 | −0.10138069 | 0.04124945 |
| ssc-miR-323 | 71.3952 | 6.6766 | −3.41864157 | 1.74916e-313 |
| ssc-miR-340 | 55.6585 | 133.2354 | 1.25930352 | 6.7342E-162 |
| ssc-miR-365-3p | 13.9727 | 30.6784 | 1.13461242 | 4.8597E-33 |
| ssc-miR-382 | 52.4091 | 5.8314 | −3.16790314 | 6.6392E-215 |
| ssc-miR-424-5p | 43.0321 | 10.9867 | −1.96965513 | 1.4251E-102 |
| ssc-miR-432-5p | 328.752 | 34.3124 | −3.26019773 | 0 |
| ssc-miR-451 | 78.1262 | 40.1439 | −0.96062566 | 3.72505E-63 |
| ssc-miR-486 | 289.9442 | 387.5785 | 0.41871326 | 4.66669E-71 |
| ssc-miR-503 | 192.3213 | 53.0322 | −1.85857805 | 0 |
| ssc-miR-885-3p | 29.2915 | 64.1879 | 1.13181929 | 5.32121E-67 |
| ssc-miR-98 | 88.0138 | 74.7521 | −0.23561564 | 7.70423E-07 |
| ssc-miR-99a | 97.298 | 45.1724 | −1.10696858 | 2.73637E-98 |
Expression profiles of miR-432 during myogenesis
To address the function of mouse miR-432, we firstly examined the expression pattern of miR-432 by qPCR analysis. MiR-432 was enriched in skeletal muscle compared with heart, liver, brain, lung and white adipose tissue (Fig. 2A). Further, we found a higher expression level in 2-week old mice than 2-month, which shown a same trend with pig (Fig. 2B). In addition, a significant upregulation was observed in early myoblast proliferation at 24 h (Fig. 2C). Interestingly, the level of miR-432 reached the highest level after myogenic differentiation for 4 days (Fig. 2D). These results indicated that miR-432 probably played a vital role in myogenesis.
Figure 2.
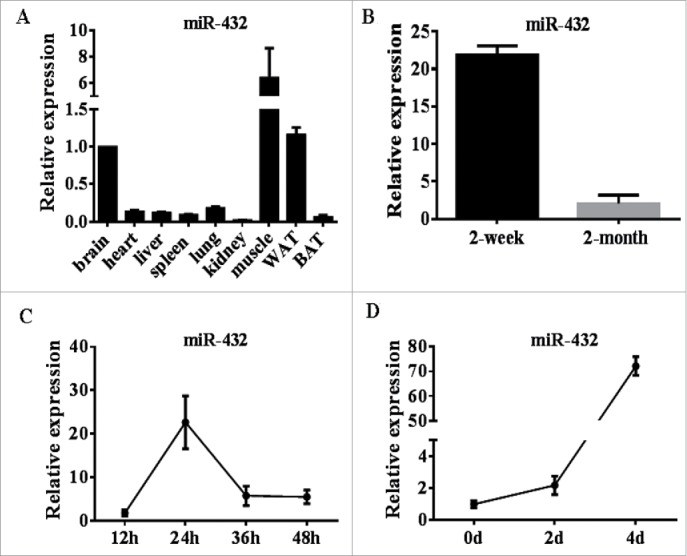
The profiles of miR-432 in mice different tissues and during C2C12 cell myogenesis. (A) The expression level of miR-432 in different tissues of mice. (B) The expression profile of miR-432 in skeletal muscle of 2-week-old and 8-week-old mice. (C) RT qPCR was performed to detect the expression of miR-432 in proliferating myoblasts. (D) RT qPCR analysis of miR-432 expression after inducing myoblast differentiation. U6 small nuclear RNA was used as an internal control. All results were representative of means ± SD of three independent experiments.
miR-432 inhibits myoblast proliferation
To determine the role of miR-432 in cell proliferation, C2C12 cells were transfected with miR-432 mimics or negative control (NC) at 50% density. As showed in Fig. 3A, the overexpression efficiency of miR-432 mimics was high enough to do subsequent experiment (Fig. 3A). Overexpression of miR-432 suppressed cell cycle-related genes (cyclin E, cdk2 and PCNA) expression, both in level of mRNA (Fig. 3B) and protein (Fig. 3C). Next, cell cycle analysis performed by flow cytometer exhibited that overexpression of miR-432 reduced the percentage of S-phage cells (P < 0.01; Fig. 3D), indicating that miR-432 inhibited proliferation processes by arresting myoblasts at G1-phage (Fig. 3D). Meanwhile, EdU assay showed that miR-432 mimics-treated group had less Edu labeled cells than NC (Fig. 3F, G). Additionally, miR-432 mimics notably decreased absorptivity at 490nm by cell counting (CCK8) assay, indicating that cell number was reduced in mimics-treated group compared with NC (Fig. 3H). Collectively, these data demonstrated that miR-432 mimics inhibited myoblast proliferation.
Figure 3.

MiR-432 inhibited myoblast proliferation. MiR-432 mimics or negative control (NC) were transfected into cells at 50% density at 50nM and cells were harvested on 24 h after transfection. (A) The overexpression efficiency of miR-432 after transfecting miR-432 mimics compared with negative control (NC). (B) Real-time qPCR was used to detect cell cycle genes, Cyclin E, cdk2 and PCNA after 24 h transfection. (C) Western blot analysis of cell cycle genes. (D) Cell cycle analysis were performed by flow cytometer after transfection for 24 h. (E) The statistics results of cell cycle analysis. (F) EdU assay was carried out after transfection for 24 h. Cells during DNA replication were stained by EdU (red) and cell nuclei were stained with Hoechst (blue). (G) The percentage of EdU positive cells / Hoechst positive cells was quantified. (H) Cell count was measured by cell count kit 8 (CCK8), results represented absorbance value at 490 nm after incubation with 10% CCK8 solution for 4 h. Data were representative of means ± SD of three independent experiments.*, P < 0.05;**, P < 0.01.
miR-432 inhibitor promoted myoblast proliferation
To further confirm the function of miR-432 on myoblast proliferation, we transfected myoblasts with miR-432 inhibitor. The results showed that miR-432 inhibitor increased the levels of cell cycle maker genes (cyclin E, PCNA and P27; Fig. 4A–C). Flow cytometry assay and EdU staining assay revealed that inhibition of miR-432 promoted S-phage cells markedly (Fig. 4D, E) and EdU labeled cells were more in miR-432 inhibitor treated cells than NC treated cells (Fig. 4F, G). Moreover, total number of cells increased by CCK8 assay (Fig. 4H). Collectively, myoblast proliferation was induced by downregulating cell cycle genes expression and decreasing DNA replication when silenced miR-432 expression.
Figure 4.

MiR-432 inhibitor promoted proliferation of myoblasts. (A) RT qPCR analysis of cell cycle related genes after transfection for 24h. (B) Western blot analysis of Cyclin D1, Cyclin E, P27. (C) Quantification of Western blot analysis of Cyclin D1, Cyclin E, P27. (D) Flow cytometer was used to analyze cell cycle. (E) Statistics of cells number in different stages. (F) Edu staining of myoblasts after transfection for 24 h. Cells during DNA replication were stained by EdU (red) and cell nuclei were stained with Hoechst (blue). (G) Quantification of the percentage of EdU positive cells/total cells. (H) Cell cycle kit 8 was used to estimate total cell number and the data displayed the absorbtivity at 490nm. Data were shown by mean ± SD of three independent experiments. *, P < 0.05;**, P < 0.01.
miR-432 inhibits myoblast differentiation
To explore the function of miR-432 on myogenic differentiation, myoblasts were transfected with NC or miR-432 mimics at 70% density followed by changing culture medium to induce differentiation when it reached confluence. The results showed that highly overexpression of miR-432 (Fig. 5A) dramatically suppressed mRNA expression of myogenic genes, including MyoG (Fig. 5B) and MyHC (Fig. 5C), which was consistent with protein level (Fig. 5D, E). Furthermore, immunofluorescent assay revealed that myoblasts treated with miR-432 mimics had fewer myotube (Fig. 5F) and lower fusion rate relative to cells that were transfected with Negative Control (Fig. 5G). Together, overexpression of miR-432 inhibited myoblast differentiation by suppressed myogenic genes expression.
Figure 5.
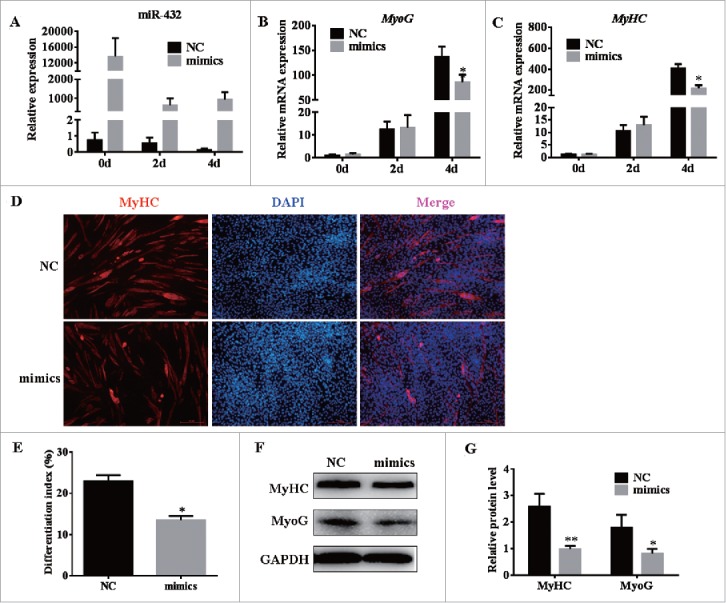
MiR-432 suppressed myoblast differentiation. MiR-432 mimics or negative control (NC) were transfected into cells at 70% density at 50nM. The total RNA on day 0, 2, 4 for RT qPCR and protein on day 4 for western blotting analysis. (A) The overexpression efficiency of miR-432 after transfecting miR-432 mimics compared with negative control (NC). (B, C) Real-time qPCR was used to detect cell myogenic genes, MyoG, MyHC (MYH1) after inducing. (D) Immunofluorescence of muscle myosin heavy chain (MyHC) in C2C12 cells on fourth day of differentiation. (E) The fusion index was counted by MyHC-positive cells to total nuclei (Hoechst-positive cells). (F) Western blot analysis of myogenic genes on fourth day of differentiation. (G) The quantify results of protein level. Data were representative of means ± SD of three independent experiments. *, P < 0.05; **, P < 0.01.
E2F3 and P55PIK are direct targets of miR-432
To reveal underlying mechanism of miR-432 on proliferation and myogenic differentiation, we predicted the target genes of miR-432 by TargetScan,38 miRBase,39 and RNAhybrid40 online software and found that E2F3 and P55PIK were the candidate target genes (Fig. 6A). The levels of miR-432 and E2F3, P55PIK displayed inconsistent trends during proliferating cells (Figs. 2C, 6B, C), but it showed adverse trends during myogenic differentiation (Figs. 2D, 6D, E). Also, we observed that mRNA expression of E2F3 (Fig. 6F) and P55PIK (Fig. 6G) reduced in a concentration-dependent manner, implying that miR-432 regulated E2F3 and P55PIK expression. To demonstrate whether miR-432 directly targets E2F3 and P55PIK, we cloned E2F3 and P55PIK 3′ UTRs of wild type (WT) and mutation at binding site into the Renilla luciferase coding sequence of psiCHECK-2 vector (Fig. 6A). As we expected, the relative luciferase activities of the psiCHECK-2-E2F3-3′ UTR reporter (P < 0.05) and psiCHECK-2-P55PIK-3′ UTR reporter (P < 0.05) were significantly inhibited when responded to miR-432 mimics. However, this change was not observed in mutated reporter vector (Fig. 6H, I). Therefore, E2F3 and P55PIK were direct target genes of miR-432.
Figure 6.
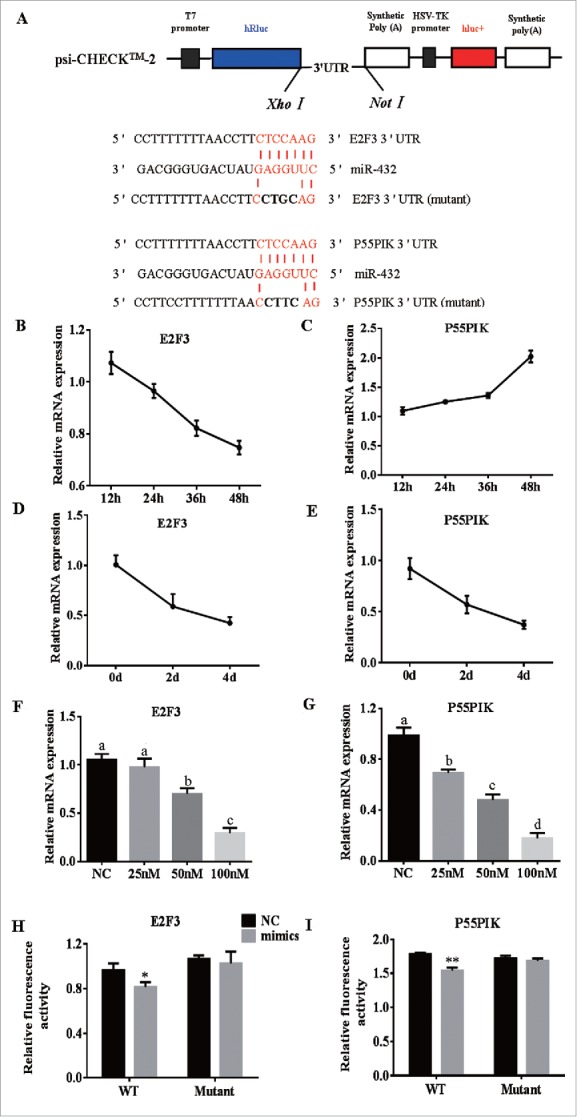
MiR-432 directly targets E2F3 and P55PIK. (A) The construction of the luciferase (Luc) expression vector fused to the 3′ UTR and predicted target sites between miR-432 and mouse E2F3 3′ UTR or P55PIK 3′ UTR. (B and C) The expression of E2F3 mRNA (B) and P55PIK mRNA (C) during myoblast proliferation. (D and E) The expression of E2F3 mRNA (D) and P55PIK mRNA (E) during C2C12 myoblasts differentiation. (F and G) The mRNA expression of E2F3 (F), P55PIK (G) when treated with different concentration of mimics. a, b, c, d: significant difference among group treated with NC, 25 nM, 50 nM and 100 nM mimics. (P < 0.05). (H and I) The results of Dual luciferase reporter assay of E2F3 (H), P55PIK (I). Predicted target sites between miR-432 and E2F3 3′UTR or P55PIK 3′UTR. psi-CHECK™−2 Vectors, containing the E2F3 3′UTR or the mutated E2F3 3′UTR were transfected into HEK293 cells either with NC or miR-432 mimics. Renilla luciferase activity was normalized to firefly luciferase. Each treatment was carried out in triplicate and repeated 3 times. Data were representative of means ± SD of three independent experiments. *, P < 0.05;**, P < 0.01.
MiR-432 regulates myogenic differentiation through the PI3K/AKT/mTOR signaling pathway
Given P55PIK being a regulatory subunit of PI3K, we speculated that miR-432 may control myogenesis through PI3K-mediated signaling pathway. As we expected, the protein levels of P55PIK and E2F3 were downregulated in miR-432 mimics-treated myoblasts during myogenesis (Fig. 7A–D). Moreover, we found that the ratios of p-AKT/AKT and p-mTOR/mTOR declined during myogenic differentiation (Fig. S3A, S3B), but not proliferation stage (Fig. 7E, F), indicating that miR-432 regulated myogenesis via blocking Akt/mTOR signaling pathway. Since insulin was classical upstream regulator of PI3K/Akt signaling, we explored how miR-432 responded to insulin. The inhibitory effect of miR-432 on myogenic differentiation was attenuated and even eliminated when treated with 10 nM and 100 nM insulin, respectively (Fig. 7G–I). Additionally, the level of miR-432 was not changed when treated with 100nM insulin (Fig. S2), manifesting that miR-432 was not as a downstream regulator of insulin. Taken together, our findings suggested that miR-432 was a negative regulator by targeting E2F3 and P55PIK via PI3K/AKT/mTOR signaling pathway to inhibit myogenic differentiation whereas it suppressed myoblast proliferation independently of PI3K/Akt/mTOR signaling pathway (Fig. 8).
Figure 7.
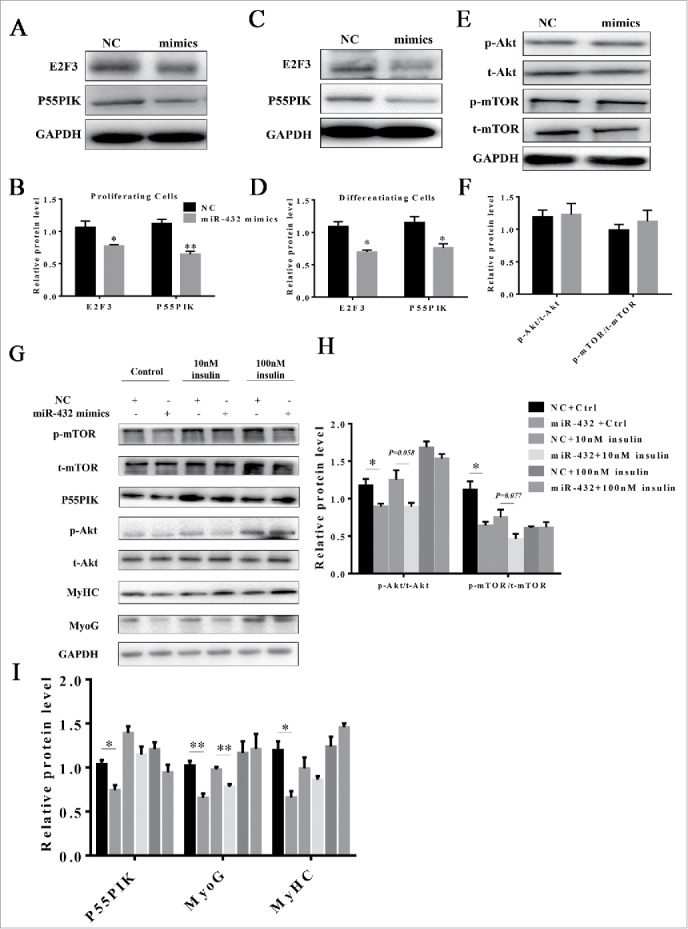
MiR-432 blocked myogenesis through PI3K/AKT signaling pathway. (A) Western blot analysis of protein change of E2F3 and P55PIK during proliferation. (B) Quantification of E2F3 and P55PIK protein expression in proliferating cells. (C) Protein changes of E2F3 and P55PIK during myoblast differentiation. (D) Quantification of E2F3 and P55PIK protein expression in differentiating cells. (E) Western blot analysis of signal molecules of PI3K/Akt/mTOR pathway during proliferation. (F) Ratios of p-Akt/t-Akt and p-mTOR/t-mTOR in proliferating cells. (G) Protein level of signal molecules in PI3K/Akt/mTOR pathway. After transfection with NC or miR-432 mimics, myoblasts were induced by myogenic differentiation medium for 3 days followed by incubating with control, 10nM insulin or 100nM insulin respectively for 24 h. Total protein was collected for western blot analysis. (H) The ratios of p-Akt/t-Akt and p-mTOR/t-mTOR protein changes in 7G. (I) Quantification of P55PIK, MyoG, and MyHC protein changes in 7G. Data were shown by mean ± SD of three independent experiments. *, P < 0.05;**, P < 0.01.
Figure 8.
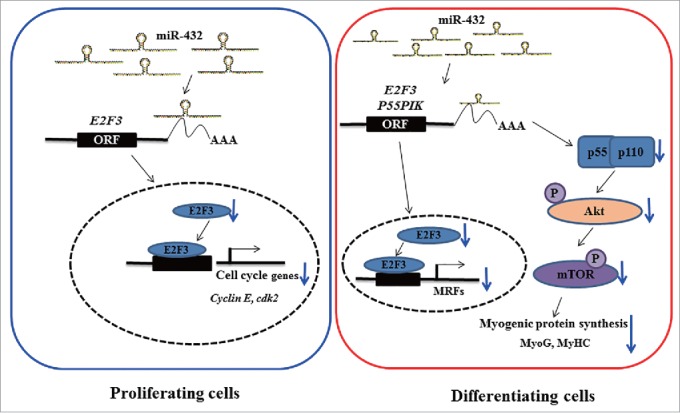
A model depicting role of miR-432 in regulating myogenesis. In proliferating cells (left), suppression of E2F3 mRNA by miR-432 resulted in transcription factor E2F3 decreasing in nucleus to dampen transcription of cell cycle genes and finally caused arrest in G1-phage. In differentiating cells (right), on the one hand, suppression of E2F3 by miR-432 inhibited transcription of MyoG to restrain myogenic differentiation; on the other hand, miR-432 contributed to phosphorylation of its downstream Akt and mTOR being suffocated to block myogenesis by targeted P55PIK.
Discussion
By profiling miRNA expression in porcine longissimus dorsi, we revealed 7-fold higher expression of miR-432 in weaned piglets compared to adult pigs and thus seek to explore the role and regulatory mechanism of miR-432. First, we evaluated miR-432 expression in 9 different tissue types and confirmed that it is highly expressed in skeletal muscle. Consistent with the observations in pigs, miR-432 also shows higher expression in the muscle of 2-week old mice compared to that of 2-month old mice, implying that miR-432 may regulate myogenesis. In addition, the ‘seed sequence’ of mouse miR-432-5p is conserved between mice and porcine, indicating that miR-432 may have important functions in regulating gene expression that is evolutionarily conservative.
We showed that miR-432 mimic transfection caused proliferating myoblasts to be markedly arrested at G1 phase with reduced number of S-phase cells. The mRNA and protein levels of E2F3 and P55PIK both declined after with miR-432 mimic treatment, although the expression patterns of these two target genes showed weak inverse-correlation with that of miR-432 during myoblast proliferation Dual-Luciferase reporter assay also demonstrated that miR-432 can directly target E2F3 and P55PIK. E2F3 had been well characterized with regard to mammalian cell growth.41 The downstream target genes of E2F3 participate in the initiation of DNA replication, thereby imparting a potent control of the entry into S-phase.42 In addition, some miRNAs have been reported to control cell cycle process by targeting E2F3. MiR-141 interacts with long non-coding RNA MEG3 and down-regulates E2F3 expression to inhibit gastric cancer proliferation.43 MiR-200 targets Sox2 and E2F3 while directly regulating miR-200 to form a feed-back circle to controls neural progenitor cell-cycle exit and differentiation.44 In our study, miR-432 is also shown to inhibit proliferation by targeting E2F3. P55PIK, a regulatory subunit of PI3K, was identified to promote cell growth and cell proliferation45,46 and interacted with proliferation cell nuclear antigen (PCNA)25 to stimulate DNA synthesis. Interestingly, we observed that the expression of P55PIK and PCNA declined both in mRNA level and protein level following miR-432 forced expression, implying that miR-432 may also regulate PCNA by unknown mechanisms. Moreover, we also used miR-432 inhibitor to further confirm the effect of miR-432 on myoblast proliferation. After miR-432 inhibitor treatment, target genes E2F3 and P55PIK were upregulated significantly and myoblast proliferation was improved. Consistent with our data, miR-432 has been demonstrated to suppress cell growth in several types of cancers: ovarian cancer, cervical cancer, hepatocellular carcinoma and pituitary GH adenomas.19,47,48 These studies, altogether point to an ubiquitous role of miR-432 in regulating cell proliferation.
MyoG is a master transcription factor for initiating terminal differentiation of myoblasts,49,50 and MyHC is also a marker gene for evaluating myoblast differentiation51 In our study, myoblast differentiation and fusing to form myotube were suppressed via miR-432 overexpression, manifested by the downregulation of MyoG and MyHC. Transgenic mice that express a constitutively active Akt, specifically in skeletal muscle, showed an increase in muscle mass owing to an increase in muscle fiber size, which suggested that PI3K/Akt/mTOR signaling pathway involved in myogenic progression.52,53 Moreover, miR-21 targets TGF-β to regulate porcine skeletal muscle development through PI3K/Akt/mTOR signaling.54 MiR-133 in myogenesis also functions through targeting insulin-like growth factor-1 receptor (IGF-1R) to down-regulate phosphorylation of Akt.55 Given the fact that PI3K/Akt/mTOR pathway promotes myoblast differentiation and P55PIK is a participant of this pathway, we reason that during terminal differentiation, miR-432 may still use P55PIK as a target gene and exert inhibitory effects on myoblast differentiation through this pathway. P55PIK acts as a regulatory subunit gamma of type IA phosphatidylinositol 3-kinase (PI3K) and can integrate with the 110-kDa catalytic subunit of PI3K to form stable heterodimer and activate downstream Akt signaling pathways. Actually, we found miR-432 is able to down-regulate the ratio of p-Akt/t-Akt and p-mTOR/t-mTOR via targeting P55PIK. We also found that insulin treatment could reverse the inhibitory effects of miR-432 on myoblast differentiation. Insulin is a potent natural stimulator of PI3K/Akt/mTOR pathway. In this experiment, the expression level of miR-432 was not affected by insulin, and this indicates a direct regulation on PI3K/Akt/mTOR pathway by miR-432, probably through targeting P55PIK. It is worthy to note that in our study, the ratio of p-Akt/t-Akt and p-mTOR/t-mTOR remained unchanged in proliferating cells after forced miR-432 expression, which is in contrast to the observation in differentiated cells. The reason why miR-432 inhibits PI3K/Akt/mTOR signaling pathway during differentiation but not in myoblast proliferation is still unclear, although miR-432 targets P55PIK in both conditions.
It was point out that we found 19 novel miRNAs by miRNA sequencing analysis. These novel miRNAs will be further explored in skeletal muscle growth and development in the future. Moreover, effect and regulatory mechanism of miR-432 need be also confirmed in porcine myoblast system and satellite cells.
In summary, we identified that miR-432 can target E2F3 and P55PIK in myoblasts. In proliferating condition, miR-432 can regulate cell cycle through repressing E2F3 and P55PIK. IN-terminal differentiation, miR-432 is able to block PI3K/Akt/mTOR signaling pathway, probably through down-regulating P55PIK. Although miR-432 also targets P55PIK in proliferating myoblasts, it seems PI3K/Akt/mTOR pathway is not functioning downstream of miR-432/P55PIK in proliferation condition. Taken together, our findings indicate that miR-432 is potent negative regulator of myoblast proliferation and differentiation through multiple target genes. A better understanding of miR-432 in the context myogenesis benefits both the controlling of meat quality in animal husbandry industry and human medical research.
Materials and methods
Preparation of RNA sequencing samples
Three 35-day-old weaning Rongchang piglets and three 287-day-old adult Rongchang pigs were used in this study. They were housed in the same circumstances, respectively. In preparation of sequencing, longissimus dorsi tissues, located between the third and fourth ribs to last, were taken from them. All pig experiments were carried out in accordance with the protocol approved by the Animal Ethics Committee of Northwest A&F University and the experimental protocol was performed in accordance with applicable guidelines and regulations. Samples were quick-freezed in liquid nitrogen immediately until RNA extraction. Total RNA was extracted using Trizol reagent (Invitrogen. Carlsbad, CA) according to the manufacturer's protocol and then pooled for Solexa sequencing. Before sequencing the RNA quality was determined in BGI, Shenzhen, China.
Cell culture
Mouse C2C12 cells (ATCC, Rockefeller, New York, NY, USA) and HEK293T (Human embryonic kidney 293T) cells were cultured in DMEM growth medium (GM) composed of high glucose Dulbecco's modified Eagle's medium DMEM with 10% fetal bovine serum (FBS, Gibco) and 100 IU/ml penicillin–streptomycin at 5% CO2 and 37 °C. Myoblasts were induced with differentiation medium (DM, DMEM supplemented with 2% horse serum) when cells reached at 90% density. Cells were collected at different time points. Culture medium was changed every other day.
Animals
The C57BL/6 male mice were purchased from the Fourth Military Medical University Animal Center (Xi'an, China). The tissues were taken from 2-week, 8-week old mice. The use of animals was in accordance with the recommendations of the Guide for the Care and Use of Laboratory Animals of China.
Transfection of miRNA mimic or inhibitor
Myoblasts were seeded in 12-well or 6-well plates, and miR-432 mimics or negative control (NC) (Ribobio, China) were transfected into cells at 50% density in 50nM using X-tremeGENE siRNA Transfection Reagent (Roche, USA) and Opti-MEM (Gibco, USA) culture medium according to the manufacturer's protocol and the culture medium was changed to fresh medium after 12 hours for studying proliferation of myoblasts. Cells were harvested on 24 h after transfection. When transfected with miR-432 inhibitor, the protocol was same as mimics, but the final concentration of miR-432 inhibitor was 100nM according to the introductions. Nevertheless, for myogenic differentiation, cells were transfected when density of myoblasts reached 70%. When cells grew to confluence after transfection, myogenic differentiation was initiated by switching to differentiation medium.
Luciferase reporter assays
The 3′ UTR of mouse E2F3 and P55PIK mRNA were amplified from myoblast cDNA. The forward primer of E2F3: 5′-ccgctcgag TCGCAGTGTTGTCCCTTCCTA −3′ and the reverse primer of E2F3: 5′-taagaatgcggccgc TAGGAAGGGACAACACTGCGA −3′, the forward primer of P55PIK: 5′-ccgctcgag CCTTTGCTGCCAACTGCTCAT −3′ and the reverse primer of P55PIK: 5′-taagaatgcggccgc GCAAGTCTGCCAACCATTCCA −3′ added with restriction sites of XhoI or NotI. Then link 3′ UTR of E2F3 and P55PIK mRNA into a psiCHECK2-reporter vector (Promega), downstream of the reporter gene (Renilla luciferase). HEK293T cells were seeded at 8000 cells per well in a 48-well. 250 ng of psiCHECK2–E2F3–3′ UTR or psiCHECK2–P55PIK–3′ UTR was cotransfected with 50 nM of either miRNA mimics or NC when the cells reached 70% density. Co-transfection was performed with X-tremeGENE HP DNA Transfection (Roche, USA) and Opti-MEM1 (Gibco, USA). After transfection for 48 h, the relative luciferase activities of Renilla compared with firefly were measured with a Dual Luciferase Reporter Assay System (Promega) according to the manufacturer's protocol.
Real-time quantitative PCR
To detect the expression of miRNA and genes associated with cell cycle and myogenic differentiation, the total RNA was extracted with Trizol reagent (TakaRa, Otsu, Japan). The concentration of total RNA was measured by the NanoDrop 2000 (Thermo, Waltham, MA, USA). Then we used reverse transcription kits (TakaRa, Otsu, Japan) to synthesis cDNA. For miRNA analysis, specific reverse transcription primers and procedures were used, whereas the normal process was performed for mRNA analysis. In real-time quantitative PCR, every reaction performed in triplicate using SYBR green kits on a Bio-Rad iQTM5 system (Bio-Rad, USA). The expressions of all genes were normalized to GAPDH, but U6 small RNA was internal reference when examined the level of miR-432. The primer sequences used for qPCR were shown in Table S1.
Western blotting analysis
Wash twice with PBS before adding RIPA (Applygen Technologies Inc., China) and protease inhibitor (complete mini-tablet, Roche, USA) to myoblasts under low temperature (4°C). Then we used cell scraper to separate cell lysate from bottom of culture plate as much as possible followed by centrifuging (12000xg) at 4°C for 10 minutes. Supernatant lysates protein concentration was determined by Thermo Scientific Pierce BCA protein assay kit (Thermo Fisher, USA) and add 1/4 volume of 5×loading buffer to supernate and 20 µg protein was electrophoresed on a 10% SDS-polyacrylamide gel and shifted to polyvinyldene difluoride (PVDF) membrane (CST, Boston, MA, USA), then the membrane was blocked with 5% defatted milk at 4°C for 2 hours, incubated with antibodies (1:1000) against Cyclin E (Santa Cruz, USA), Cyclin D1 (Santa Cruz, USA), P27 (Santa Cruz, USA), PCNA (CST, USA), MyHC (Abcam, USA), MyoG (Abcam, USA), E2F3 (Santa Cruz, USA), P55PIK (ProteinTech, China), p-Akt (CST, USA), t-Akt (CST, USA), p-mTOR (CST, USA), t-mTOR (CST, USA) and GAPDH (BOSTER, China) at 4°C overnight. After being washed by TBST (Tris Buffered Saline with Tween), the membranes were incubated with HRP goat anti-mouse IgG or goat anti-rabbits IgG secondary antibodies (BOSTER, China). The targeted proteins were detected using the Gel Doc XR System and analysis software Image Lab (Bio-Rad, USA) as per the instructions of the manufacturer.
EDU imaging assay
Cell-Light™ EdU Apollo®567 In Vitro Imaging Kit was purchased from RiboBio, China. Myoblasts at normal growth stage were incubated with 50µM EDU culture medium for 2h, which was prepared according to the introduction followed by fixation. Then the cells labeled with EDU were dyed in Apollo reaction solution. And cell nuclei were stained with Hoechst for 30 minutes. Afterwards, cells were observed by using a Nikon TE2000 microscope (Nikon, Tokyo, Japan) and the data was analyzed with Image J.
Flow cytometry
Myoblasts being the stable phase of cell growth, were seeded in 6- well culture plate at a density of 4×10⁵ cells per well. After 24 hours, cells were transfected with miR-432 mimic or inhibitor by X-tremeGENE HP siRNA Transfection Reagent (Roche, USA), and cells were washed three times with PBS and harvested at 24 h post-transfection. Cells were then fixed with 70% alcohol overnight at −20°C followed by being treated with 1 mg/mL RNaseA at 37 °C for 40 min, and stained with 50 mg/mL propidium iodide (PI) at 4 °C for 1 h. Samples were detected with a FACSCalibur flow cytometry (Becton Dickinson, Franklin Lakes, NJ, USA). The proliferative index (PtdIns) shows the ratio of mitotic cells from 20,000 cells examined.
Immunofluorescent Staining
Myoblasts cultured in differentiation medium were induced to form myotube for 4 days. Cells were fixed in 4% formaldehyde for 15 min at room temperature and permeabilized with 0.5% Triton X-100 for 15 min. Non-specific binding was minimized by incubating the cells in PBS containing 5% BSA for 1 h followed by washing three times with PBS. Cells were then incubated overnight at 4°C with a monoclonal anti-MyHC antibody (1:100) overnight, and washed with PBS (3×10 min) at room temperature. Subsequently, cells were incubated with Alexa Fluor 488-conjugated anti-mouse IgG (1:200) for 1 h at room temperature, washed with PBS (3×10 min). Finally, cell nuclear were stained with DAPI and Cells were viewed on a fluorescence microscope.
Cell counting kit 8 (CCK8) analysis
Myoblasts were subcultivated to 96-well plate in a number of 3×10³ cells. Myoblasts were transfected with miR-432 mimics or negative control (NC) with 3 repetitions. After treatment for 24 h we switched the cells to culture medium containing 10% CCK solution for 4 h at 37°C followed by measuring absorbance at 490 nm.
Bioinformatic analysis
The sequences of miRNAs were searched for at miRBase (http://www.mirbase.org/) and the 3′UTR sequences of E2F3 and P55PIK were downloaded from NCBI. Target genes of miRNA were predicted by TargetScan 6.2 Mouse (http://www.targetscan.org) and miRDB (http://www.mirdb.org/miRDB/).
Insulin treatment
Insulin was bought from Sigma and dissolved into storage solution. To study how miR-432 responds to insulin stress, insulin was added to differentiation medium, in which the final concentrations of insulin were 10nM or 100nM respectively. C2C12 cells were treated with 10nM or 100nM insulin for 24 h before harvesting cells for western blot analysis.
Statistical analyses
All charts were made up by GraphPad Prism and the error bar represented mean SD. Statistical significance of differences between the groups were assessed using Student's t test or one-way ANOVA. It was considered significant when P value less than 0.05. (*, P < 0.05; **, P < 0.01)
Supplementary Material
Disclosure of potential conflicts of interest
No potential conflicts of interest were disclosed.
Funding
This study was supported by National Natural Science Foundation of China (31572366), the National key basic research and development program (2015CB943102), the Natural Science Foundation of Shaanxi Province (2015JM3096) and the NWAFU fund (TGCX2015-30).
References
- 1.Massie B, Conway M, Yonge R, Frostick S, Ledingham J, Sleight P, Radda G, Rajagopalan B. Skeletal muscle metabolism in patients with congestive heart failure: relation to clinical severity and blood flow. Circulation 1987; 76:1009-19; PMID:3664989; https://doi.org/ 10.1161/01.CIR.76.5.1009 [DOI] [PubMed] [Google Scholar]
- 2.Zurlo F, Larson K, Bogardus C, Ravussin E. Skeletal muscle metabolism is a major determinant of resting energy expenditure. J Clin Invest 1990; 86:1423-27; PMID:2243122; http://dx.doi.org/ 10.1172/JCI114857 [DOI] [PMC free article] [PubMed] [Google Scholar]
- 3.Saltin B, Gollnick PD. Skeletal Muscle Adaptability: Significance for Metabolism and Performance. Comprehensive Physiology 2011; 555-631. [Google Scholar]
- 4.Buckingham M, Bajard L, Chang T, Daubas P, Hadchouel J, Meilhac S, Montarras D, Rocancourt D, Relaix F. The formation of skeletal muscle: from somite to limb. J Anat 2003; 202:59-68; PMID:12587921 [DOI] [PMC free article] [PubMed] [Google Scholar]
- 5.Buckingham M. Skeletal muscle formation in vertebrates. Curr Opin Genet Dev 2001; 11:440-48; PMID:11448631 [DOI] [PubMed] [Google Scholar]
- 6.Rudnicki MA, Schnegelsberg PN, Stead RH, Braun T, Arnold HH, Jaenisch R. MyoD or Myf-5 is required for the formation of skeletal muscle. Cell 1993; 75:1351-59; PMID:8269513 [DOI] [PubMed] [Google Scholar]
- 7.Yun K, Wold B. Skeletal muscle determination and differentiation: story of a core regulatory network and its context. Curr Opin Cell Biol 1996; 8:877-89; PMID:8939680; http://dx.doi.org/ 10.1016/S0955-0674(96)80091-3 [DOI] [PubMed] [Google Scholar]
- 8.Russell AP, Foletta VC, Snow RJ, Wadley GD. Skeletal muscle mitochondria: a major player in exercise, health and disease. Biochim Biophys Acta 2014; 1840:1276-84; PMID:24291686; http://dx.doi.org/ 10.1016/j.bbagen.2013.11.016 [DOI] [PubMed] [Google Scholar]
- 9.Tabebordbar M, Wang ET, Wagers AJ. Skeletal muscle degenerative diseases and strategies for therapeutic muscle repair. Annu Rev Pathol 2013; 8:441-75; PMID:23121053; http://dx.doi.org/ 10.1146/annurev-pathol-011811-132450 [DOI] [PubMed] [Google Scholar]
- 10.Ambros V. The functions of animal microRNAs. Nature 2004; 431:350-55; PMID:15372042; http://dx.doi.org/ 10.1038/nature02871 [DOI] [PubMed] [Google Scholar]
- 11.O'Rourke JR, Georges SA, Seay HR, Tapscott SJ, McManus MT, Goldhamer DJ, Swanson MS, Harfe BD. Essential role for Dicer during skeletal muscle development. Dev Biol 2007; 311:359-68; PMID:17936265; http://dx.doi.org/ 10.1016/j.ydbio.2007.08.032 [DOI] [PMC free article] [PubMed] [Google Scholar]
- 12.Feng Y, Niu LL, Wei W, Zhang WY, Li XY, Cao JH, Zhao SH. A feedback circuit between miR-133 and the ERK1/2 pathway involving an exquisite mechanism for regulating myoblast proliferation and differentiation. Cell Death Dis 2013; 4:e934; PMID:24287695; http://dx.doi.org/ 10.1038/cddis.2013.462 [DOI] [PMC free article] [PubMed] [Google Scholar]
- 13.Zhang D, Li X, Chen C, Li Y, Zhao L, Jing Y, Liu W, Wang X, Zhang Y, Xia H, Chang Y, Gao X, Yan J et al. Ying H. Attenuation of p38-mediated miR-1/133 expression facilitates myoblast proliferation during the early stage of muscle regeneration. PLoS One 2012; 7:e41478; PMID:22911796; http://dx.doi.org/ 10.1371/journal.pone.0041478 [DOI] [PMC free article] [PubMed] [Google Scholar]
- 14.Dey BK, Gagan J, Dutta A. miR-206 and −486 induce myoblast differentiation by downregulating Pax7. Mol Cell Biol 2011; 31:203-14; PMID:21041476; http://dx.doi.org/ 10.1128/MCB.01009-10 [DOI] [PMC free article] [PubMed] [Google Scholar]
- 15.Goljanek-Whysall K, Pais H, Rathjen T, Sweetman D, Dalmay T, Munsterberg A. Regulation of multiple target genes by miR-1 and miR-206 is pivotal for C2C12 myoblast differentiation. J Cell Sci 2012; 125:3590-600; PMID:22595520; http://dx.doi.org/ 10.1242/jcs.101758 [DOI] [PubMed] [Google Scholar]
- 16.Mi L, Li Y, Zhang Q, Zhao C, Peng Y, Yang G, Zheng X. MicroRNA-139-5p regulates C2C12 cell myogenesis through blocking Wnt/beta-catenin signaling pathway. Biochem Cell Biol 2015; 93:8-15; PMID:25529604; http://dx.doi.org/ 10.1139/bcb-2014-0079 [DOI] [PubMed] [Google Scholar]
- 17.Wei W, He HB, Zhang WY, Zhang HX, Bai JB, Liu HZ, Cao JH, Chang KC, Li XY, Zhao SH. miR-29 targets Akt3 to reduce proliferation and facilitate differentiation of myoblasts in skeletal muscle development. Cell Death Dis 2013; 4:e668; PMID:23764849; http://dx.doi.org/ 10.1038/cddis.2013.184. [DOI] [PMC free article] [PubMed] [Google Scholar]
- 18.Liu T, Zhong S, Rao F, Xue Y, Qi Z, Wu S. Catheter ablation restores decreased plasma miR-409-3p and miR-432 in atrial fibrillation patients. Europace 2016; 18:92-99; PMID:25782451; http://dx.doi.org/ 10.1093/europace/euu366 [DOI] [PubMed] [Google Scholar]
- 19.Jiang N, Chen WJ, Zhang JW, Xu C, Zeng XC, Zhang T, Li Y, Wang GY. Downregulation of miR-432 activates Wnt/beta-catenin signaling and promotes human hepatocellular carcinoma proliferation. Oncotarget 2015; 6:7866-79; PMID:25797263; http://dx.doi.org/ 10.18632/oncotarget.3492 [DOI] [PMC free article] [PubMed] [Google Scholar]
- 20.Das S, Bhattacharyya NP. Heat shock factor 1 regulates hsa-miR-432 expression in human cervical cancer cell line. Biochem Biophys Res Commun 2014; 453:461-66; PMID:25280995; http://dx.doi.org/ 10.1016/j.bbrc.2014.09.100 [DOI] [PubMed] [Google Scholar]
- 21.Rady B, Chen Y, Vaca P, Wang Q, Wang Y, Salmon P, Oberholzer J. Overexpression of E2F3 promotes proliferation of functional human beta cells without induction of apoptosis. Cell Cycle 2013; 12:2691-702; PMID:23907129; http://dx.doi.org/ 10.4161/cc.25834 [DOI] [PMC free article] [PubMed] [Google Scholar]
- 22.Asp P, Acosta-Alvear D, Tsikitis M, van Oevelen C, Dynlacht BD. E2f3b plays an essential role in myogenic differentiation through isoform-specific gene regulation. Gen Dev 2009; 23:37-53; PMID:19136625; http://dx.doi.org/8702591 10.1101/gad.1727309 [DOI] [PMC free article] [PubMed] [Google Scholar]
- 23.Kaliman P, Vinals F, Testar X, Palacin M, Zorzano A. Phosphatidylinositol 3-kinase inhibitors block differentiation of skeletal muscle cells. J Biol Chem 1996; 271:19146-51; PMID:8702591; http://dx.doi.org/ 10.1074/jbc.271.32.19146 [DOI] [PubMed] [Google Scholar]
- 24.Leevers SJ, Vanhaesebroeck B, Waterfield MD. Signalling through phosphoinositide 3-kinases: the lipids take centre stage. Curr Opin Cell Biol 1999; 11:219-25; PMID:10209156; http://dx.doi.org/ 10.1016/S0955-0674(99)80029-5 [DOI] [PubMed] [Google Scholar]
- 25.Wang G, Cao X, Lai S, Luo X, Feng Y, Xia X, Yen PM, Gong J, Hu J. PI3K stimulates DNA synthesis and cell-cycle progression via its p55PIK regulatory subunit interaction with PCNA. Mol Cancer Ther 2013; 12:2100-09; PMID:23939377; http://dx.doi.org/ 10.1158/1535-7163.MCT-12-0920 [DOI] [PubMed] [Google Scholar]
- 26.Pons S, Asano T, Glasheen E, Miralpeix M, Zhang Y, Fisher TL, Myers MG, Sun XJ, White MF. The structure and function of p55PIK reveal a new regulatory subunit for phosphatidylinositol 3-kinase. Mol Cell Biol 1995; 15:4453-65; PMID:7542745 19074847 [DOI] [PMC free article] [PubMed] [Google Scholar]
- 27.Hu J, Xia X, Cheng A, Wang G, Luo X, Reed MF, Fojo T, Oetting A, Gong J, Yen PM. A peptide inhibitor derived from p55PIK phosphatidylinositol 3-kinase regulatory subunit: a novel cancer therapy. Mol Cancer Ther 2008; 7:3719-28; PMID:19074847; http://dx.doi.org/ 10.1158/1535-7163 MCT-08-0499 [DOI] [PubMed] [Google Scholar]
- 28.Wang G, Deng Y, Cao X, Lai S, Tong Y, Luo X, Feng Y, Xia X, Gong J, Hu J. Blocking p55PIK signaling inhibits proliferation and induces differentiation of leukemia cells. Cell Death Differ 2012; 19:1870-79; PMID:22722333; http://dx.doi.org/ 10.1038/cdd.2012.70 [DOI] [PMC free article] [PubMed] [Google Scholar]
- 29.Sun XJ, Zhao M, Yuan XH, Yu Q, Zheng LM, Fang MJ, Huang CZ. [Inhibitory effect of N-terminal of p55PIK–regulatory subunit of phosphoinositide-3 kinase–on proliferation of gastric cancer cell line MGC803 and its mechanism]. Ai Zheng 2006; 25:264-68; PMID:16536976 [PubMed] [Google Scholar]
- 30.Zhou Y, Li F, Tian X, Wang B, Ding M, Pang H. Changes in phosphatidylinositol 3-kinase 55 kDa gamma expression and subcellular localization may be caspase 6 dependent in paraquat-induced SH-SY5Y apoptosis. Hum Exp Toxicol 2014; 33:761-71; PMID:24130211; http://dx.doi.org/16916907 10.1177/0960327113499044 [DOI] [PubMed] [Google Scholar]
- 31.Leger B, Cartoni R, Praz M, Lamon S, Deriaz O, Crettenand A, Gobelet C, Rohmer P, Konzelmann M, Luthi F et al. Russell AP. Akt signalling through GSK-3beta, mTOR and Foxo1 is involved in human skeletal muscle hypertrophy and atrophy. J Physiol 2006; 576:923-33; PMID:16916907; http://dx.doi.org/ 10.1113/jphysiol.2006.116715 [DOI] [PMC free article] [PubMed] [Google Scholar]
- 32.Pallafacchina G, Calabria E, Serrano AL, Kalhovde JM, Schiaffino S. A protein kinase B-dependent and rapamycin-sensitive pathway controls skeletal muscle growth but not fiber type specification. Proc Natl Acad Sci USA 2002; 99:9213-18; PMID:12084817; http://dx.doi.org/ 10.1073/pnas.142166599 [DOI] [PMC free article] [PubMed] [Google Scholar]
- 33.Bolster DR, Crozier SJ, Kimball SR, Jefferson LS. AMP-activated protein kinase suppresses protein synthesis in rat skeletal muscle through downregulating mammalian target of rapamycin (mTOR) signaling. J Biol Chem 2002; 277:23977-80; PMID:11997383; http://dx.doi.org/ 10.1074/jbc.C200171200 [DOI] [PubMed] [Google Scholar]
- 34.Vogt PK. PI3-kinase, mTOR, protein synthesis and cancer. Trends Mol Med 2001; 7:482-84; PMID:11689313; http://dx.doi.org/ 10.1016/S1471-4914(01)02161-X [DOI] [PubMed] [Google Scholar]
- 35.Altarejos JY, Montminy M. CREB and the CRTC co-activators: sensors for hormonal and metabolic signals. Nat Rev Mol Cell Biol 2011; 12:141-51; PMID:21346730; http://dx.doi.org/ 10.1038/nrm3072 [DOI] [PMC free article] [PubMed] [Google Scholar]
- 36.Fritsche L, Weigert C, Haring HU, Lehmann R. How insulin receptor substrate proteins regulate the metabolic capacity of the liver–implications for health and disease. Curr Med Chem 2008; 15:1316-29; PMID:18537611 [DOI] [PubMed] [Google Scholar]
- 37.Cheng Z, Tseng Y, White MF. Insulin signaling meets mitochondria in metabolism. Trends Endocrinol Metab 2010; 21:589-98; PMID:20638297; http://dx.doi.org/ 10.1016/j.tem.2010.06.005 [DOI] [PMC free article] [PubMed] [Google Scholar]
- 38.Agarwal V, Bell GW, Nam JW, Bartel DP. Predicting effective microRNA target sites in mammalian mRNAs. Elife 2015; 4:1-38; PMID:26267216; http://dx.doi.org/ 10.7554/eLife.05005. [DOI] [PMC free article] [PubMed] [Google Scholar]
- 39.Kozomara A, Griffiths-Jones S. miRBase: annotating high confidence microRNAs using deep sequencing data. Nucleic Acids Res 2014; 42:D68-73; PMID:24275495; http://dx.doi.org/ 10.1093/nar/gkt1181 [DOI] [PMC free article] [PubMed] [Google Scholar]
- 40.REHMSMEIER M. Fast and effective prediction of microRNA/target duplexes. RNA 2004; 10:1507-17; PMID:15383676; http://dx.doi.org/17452454 10.1261/rna.5248604 [DOI] [PMC free article] [PubMed] [Google Scholar]
- 41.Leone G, Degregori J, Yan Z, Jakoi L, Ishida S. E2F3 activity is regulated during the cell cycle and is required for the induction of S phase. Genes & Development 1998; 12:2120-30; PMID:967905717452454 [DOI] [PMC free article] [PubMed] [Google Scholar]
- 42.McClellan KA, Ruzhynsky VA, Douda DN, Vanderluit JL, Ferguson KL, Chen D, Bremner R, Park DS, Leone G, Slack RS. Unique requirement for Rb/E2F3 in neuronal migration: evidence for cell cycle-independent functions. Mol Cell Biol 2007; 27:4825-43; PMID:17452454; http://dx.doi.org/ 10.1128/MCB.02100-06 [DOI] [PMC free article] [PubMed] [Google Scholar]
- 43.Zhou X, Ji G, Ke X, Gu H, Jin W, Zhang G. MiR-141 Inhibits Gastric Cancer Proliferation by Interacting with Long Noncoding RNA MEG3 and Down-Regulating E2F3 Expression. Dig Dis Sci 2015; 60:3271-82; PMID:26233544; http://dx.doi.org/ 10.1007/s10620-015-3782-x [DOI] [PubMed] [Google Scholar]
- 44.Peng C, Li N, Ng YK, Zhang J, Meier F, Theis FJ, Merkenschlager M, Chen W, Wurst W, Prakash N. A unilateral negative feedback loop between miR-200 microRNAs and Sox2/E2F3 controls neural progenitor cell-cycle exit and differentiation. J Neurosci 2012; 32:13292-308; PMID:22993445; http://dx.doi.org/ 10.1523/JNEUROSCI.2124-12.2012 [DOI] [PMC free article] [PubMed] [Google Scholar]
- 45.Zhou J, Chen GB, Tang YC, Sinha RA, Wu Y, Yap CS, Wang G, Hu J, Xia X, Tan P. Genetic and bioinformatic analyses of the expression and function of PI3K regulatory subunit PIK3R3 in an Asian patient gastric cancer library. Bmc Medical Genomics 2012; 5:1-08; PMID:22876838; http://dx.doi.org/24591819 10.1186/1755-8794-5-34 [DOI] [PMC free article] [PubMed] [Google Scholar]
- 46.Zhang L, Huang J, Yang N, Greshock J, Liang S, Hasegawa K, Giannakakis A, Poulos N, O'Brien-Jenkins A, Katsaros D, Butzow R, Weber BL et al. Coukos G. Integrative Genomic Analysis of Phosphatidylinositol 3′-Kinase Family Identifies PIK3R3 as a Potential Therapeutic Target in Epithelial Ovarian Cancer. Clinical Cancer Research 2007; 13:5314-21; PMID:17875760; http://dx.doi.org/24591819 10.1158/1078-0432.CCR-06-2660 [DOI] [PubMed] [Google Scholar]
- 47.Kim YW, Kim EY, Jeon D, Liu JL, Kim HS, Choi JW, Ahn WS. Differential microRNA expression signatures and cell type-specific association with Taxol resistance in ovarian cancer cells. Drug Des Devel Ther 2014; 8:293-314; PMID:24591819; http://dx.doi.org/ 10.2147/DDDT.S51969 [DOI] [PMC free article] [PubMed] [Google Scholar]
- 48.Chen L, Kong G, Zhang C, Dong H, Yang C. MicroRNA-432 functions as a tumor suppressor gene through targeting E2F3 and AXL in lung adenocarcinoma. Oncotarget 2016; 12:20041-53; PMID:26942465; http://dx.doi.org/8791524 10.18632/oncotarget.7884 [DOI] [PMC free article] [PubMed] [Google Scholar]
- 49.Molkentin JD, Olson EN. Defining the regulatory networks for muscle development. Curr Opin Genet Dev 1996; 6:445-53; PMID:8791524; http://dx.doi.org/ 10.1016/S0959-437X(96)80066-9 [DOI] [PubMed] [Google Scholar]
- 50.Pownall ME, Gustafsson MK, Emerson CJ. Myogenic regulatory factors and the specification of muscle progenitors in vertebrate embryos. Annu Rev Cell Dev Biol 2002; 18:747-83; PMID:12142270; http://dx.doi.org/ 10.1146/annurev.Cellbio.18.012502.105758 [DOI] [PubMed] [Google Scholar]
- 51.Hibberd MG, Trentham DR. Relationships between chemical and mechanical events during muscular contraction. Annu Rev Biophys Biophys Chem 1986; 15:119-61; PMID:2941026; http://dx.doi.org/ 10.1146/annurev.bb.15.060186.001003 [DOI] [PubMed] [Google Scholar]
- 52.McKinnell IW, Rudnicki MA. Molecular mechanisms of muscle atrophy. Cell 2004; 119:907-10; PMID:15620349; http://dx.doi.org/ 10.1016/j.cell.2004.12.007 [DOI] [PubMed] [Google Scholar]
- 53.Bassel-Duby R, Olson EN. Signaling pathways in skeletal muscle remodeling. Annu Rev Biochem 2006; 75:19-37; PMID:16756483; http://dx.doi.org/ 10.1146/annurev.biochem.75.103004.142622 [DOI] [PubMed] [Google Scholar]
- 54.Bai L, Liang R, Yang Y, Hou X, Wang Z, Zhu S, Wang C, Tang Z, Li K. MicroRNA-21 Regulates PI3K/Akt/mTOR Signaling by Targeting TGF betaI during Skeletal Muscle Development in Pigs. PLoS One 2015; 10:e119396; PMID:25950587; http://dx.doi.org/ 10.1371/journal.pone.0119396 [DOI] [PMC free article] [PubMed] [Google Scholar]
- 55.Huang MB, Xu H, Xie SJ, Zhou H, Qu LH. Insulin-like growth factor-1 receptor is regulated by microRNA-133 during skeletal myogenesis. PLoS One 2011; 6:e29173; PMID:22195016; http://dx.doi.org/ 10.1371/journal.pone.0029173 [DOI] [PMC free article] [PubMed] [Google Scholar]
Associated Data
This section collects any data citations, data availability statements, or supplementary materials included in this article.