Abstract
Objective
To examine associations between tongue adiposity with upper airway measures, whole-body adiposity and gender. We hypothesized that increased tongue adiposity is higher in males and positively associated with abnormal upper airway measures and whole-body adiposity.
Methods
We studied subjects who underwent whole-body positron emission tomography/computed tomography to obtain tongue attenuation (TA) values and cross-sectional area, pharyngeal length (PL) and mandibular-hyoid distance (MPH), as well as abdominal circumference, abdominal subcutaneous and visceral (VAT) adipose tissue areas, neck circumference (NC) and neck adipose tissue area. Metabolic syndrome was determined from available clinical and laboratory data.
Results
We identified 206 patients (104 females, 102 males) with mean age 56±17y and mean body mass index (BMI) 28±6kg/m2 (range 16–47kg/m2). Males had lower TA values (P=0.0002) and higher upper airway measures (P< 0.0001) independent of age and BMI (P<0.001). In all subjects, TA was negatively associated with upper airway measures (P<0.001). TA was negatively associated with body composition parameters (all P<0.0001), most notably with VAT (r=−0.53) and NC (r=−0.47). TA values were lower in subjects with metabolic syndrome (P<0.0001).
Conclusion
Increased tongue adiposity is influenced by gender and is associated with abnormal upper airway patency and body composition parameters.
Keywords: tongue fat, obesity, metabolic syndrome, body composition
1. INTRODUCTION
Obesity and male gender are significant risk factors for obstructive sleep apnea (OSA) [1,2], however the mechanisms involved are not completely understood. Prior studies have shown obesity may lead to upper airway soft tissue enlargement by fat infiltration of the tongue, soft palate and lateral pharyngeal walls [3–5]. The tongue plays an important role in upper airway patency and increased tongue size and adiposity has been associated with higher risk for OSA [4,6] (Figure 1). Importantly, overweight and obese men have significantly higher intermuscular adipose tissue depots in the neck, as well as higher neck circumference [7]. Taken together, these factors may play important roles in a differential risk for OSA between genders.
Figure 1.
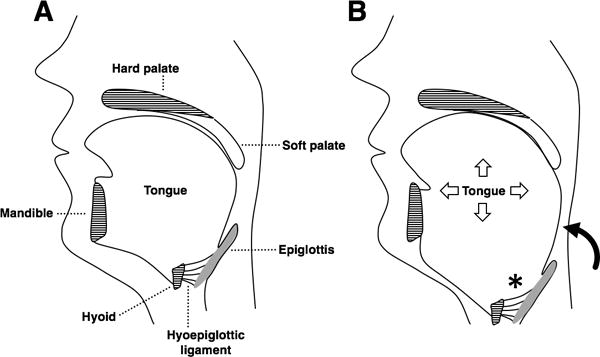
(A) The pharynx extends from the soft palate to the base of the epiglottis. The hyoid bone sits at the tongue base and is anchored by muscles and ligaments but does not articulate with other bones. (B) In obesity, tongue enlargement due to fat infiltration narrows the upper airway and displaces the hyoid caudally. The epiglottis follows the hyoid due to their connection via the hyoepiglottic ligament. Caudal displacement of the hyoid and epiglottis (*) leads to an increase in pharyngeal length (curved arrow). A longer pharynx is more collapsible, which predisposes to obstructive sleep apnea.
Abnormal body fat composition parameters such as body mass index (BMI), neck and waist circumference have shown positive associations with upper airway collapsibility measured using the passive pharyngeal critical closing pressure (Pcrit) technique [6]. Further, Pcrit was associated to airway parameters affecting hyoid position such as mandibular plane to hyoid distance (MPH), tongue length, tongue volume, and pharyngeal length, which are affected by tongue adiposity and size [6]. Preliminary evidence suggests that tongue adiposity may parallel ectopic fat accumulation elsewhere, with positive associations between abdominal subcutaneous (SAT) and visceral (VAT) adipose tissue and tongue fat being present among obese subjects [4]. Although evidence suggests links of (a) tongue adiposity with upper airway patency, and (b) tongue adiposity with whole-body adiposity, prior studies have not addressed these findings in a unified cohort of both genders with varied BMI and detailed whole-body composition assessments, including abdominal and neck fat content.
The purpose of this study was to characterize tongue attenuation values as a measure of tongue fat content, upper airway measures and whole-body adiposity using computed tomography (CT) in a cohort with a broad BMI range of both genders. We examined associations between tongue attenuation values, upper airway measures and body composition parameters, and investigated differences between genders and BMI categories. We hypothesized that increased tongue attenuation values reveal higher tongue fat content in males and are positively associated with abnormal upper airway measures and whole-body adiposity.
2. MATERIALS AND METHODS
This study was approved by the Institutional Review Board of Partners Health Care Inc. and complied with Health Insurance Portability and Accountability Act guidelines, with exemption status for individual informed consent. We performed a retrospective search for consecutive whole-body 18F-fluorodeoxy-glucose (FDG) positron emission tomography and computed tomography (PET/CT) studies obtained in adults (≥18 years-old) at our institution. Inclusion criteria comprised (a) fasting glucose measured immediately before PET/CT, (b) FDG-PET/CT performed for benign etiologies or no malignancy at the time of imaging, (c) no FDG-avid lesions to suggest malignancy, and (d) availability of clinical/laboratory data to determine presence of metabolic syndrome. Use of antihypertensive, type 2 diabetes medications, and lipid-lowering agents was recorded. Subjects with a history of neck cancer, radiation therapy, and/or surgery were excluded. Blood pressure and serum lipids obtained beyond 12 months relative to imaging date were not collected. Subjects were divided into 3 BMI categories as defined by the World Health Organization [lean, BMI (in kg/m2) <25; overweight, BMI 25 to 30; and obese, BMI≥30].
Clinical characteristics and data regarding sub-compartmental neck fat content and its link to cardiometabolic risk factors (e.g., abdominal fat areas, presence of metabolic syndrome) were previously reported in a larger cohort [7], which contained the subset of patients presented in this study; however, no data on tongue fat content and upper airway measures have been described in any of the subjects.
2.1 Whole-body CT technique
The whole-body attenuation correction non-contrast CT portion of PET/CT study was used. All studies were performed on an integrated scanner (Siemens or GE), with a 16- or 64-slice CT and a full-ring HI-REZ lutetium oxyorthosilicate PET. Examinations were performed after a 6-hour fast, and blood glucose levels were measured upon arrival. CT images were obtained at mid-expiration without intravenous contrast using slice thickness, 5 mm; table feed per rotation, 18 mm; time per table rotation, 0.5 s; tube voltage, 120 peak kilovoltage; tube current, 11 mA; and field of view, 50 cm.
2.2 Tongue adiposity and upper airway measures
Tongue attenuation values (TA) were measured in Hounsfield units (HU) as a marker for tongue fat content, with lower HU values indicating higher fat content [8,9]. On axial images at the level of the epiglottis, a 3 cm2 region of interest (ROI) was placed centrally on the tongue cross-section using OsiriX software, version 5.8 (http://www.osirix-viewer.com/index.html). For comparison, we selected the right masseter muscle as a control and measured its attenuation values using a 1 cm2 ROI. We also obtained midline sagittal reconstructions to identify the following landmarks: hyoid bone, mandibular plane and base of epiglottis, as described previously [6,10,11]. The mandibular plane to hyoid distance (MPH) was determined as the distance between the inferior margins of the mandible to the superior margin of hyoid on the sagittal plane. Pharyngeal length was obtained by measuring the distance between horizontal lines passing at the level of hard palate and base of epiglottis. Tongue cross-sectional area (CSA) was obtained by manual tracing of tongue contours on sagittal plane (Figure 2).
Figure 2.
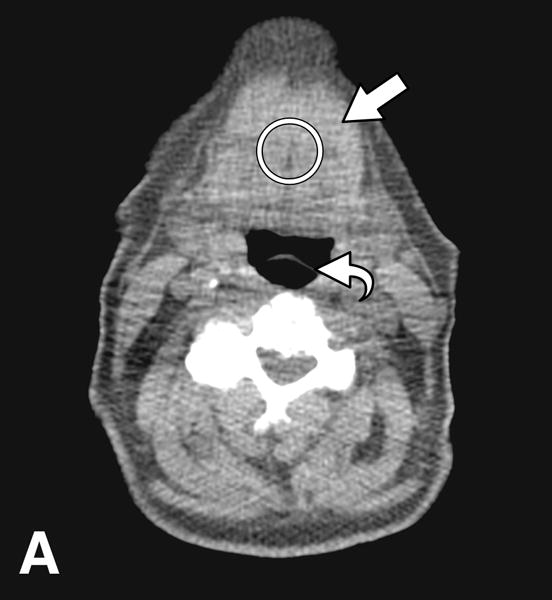
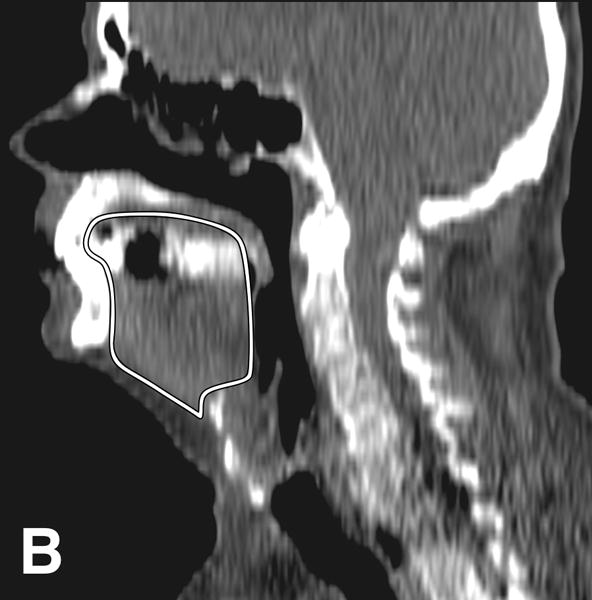
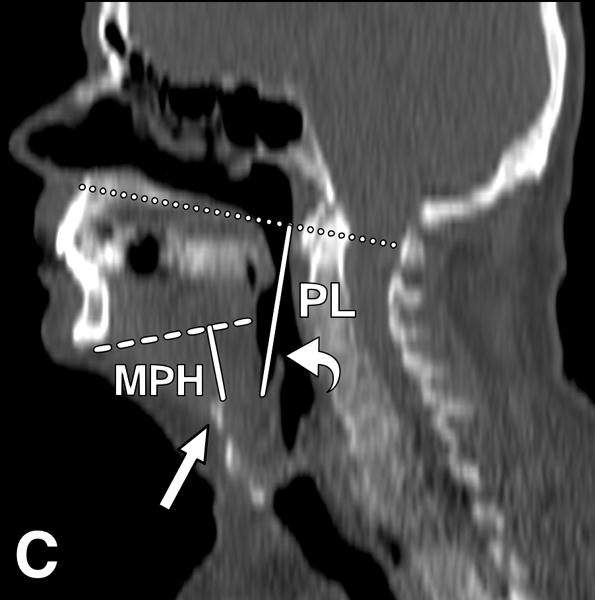
CT images from an obese male subject aged 74 years, with BMI 30 kg/m2, TA: 15.4 HU, tongue cross sectional area (CSA) 35.8 cm2, mandibular plane to hyoid distance (MPH) 2.9 cm, and pharyngeal length (PL): 7.2 cm. (A) Measurement of tongue attenuation values by placing a region of interest (circle) in the central portion of the tongue (arrow) on an axial slice obtained at the level of the epiglottis (curved arrow). (B) Sagittal CT image reconstruction through the midline showing tracing (white line) of tongue cross sectional area. (C) Sagittal CT image reconstruction through the midline demonstrating hard palate plane (dotted line) and epiglottis (curved arrow) providing PL, and the mandibular plane (dashed line) and hyoid bone (arrow) yielding MPH measures.
2.3 Body composition measures
Neck circumference (NC) and total neck adipose tissue (NAT) area were measured on axial CT images at the level of C5 vertebral body [7]. An image at the level of L4 from the same imaging dataset yielded abdominal circumference, VAT and SAT areas by setting fat attenuation thresholds at −50 to −250 Hounsfield units (HU) using TeraRecon Inc. software.
2.4 Cardiometabolic risk factor data
Presence of metabolic syndrome was defined using National Cholesterol Education Program criteria (NCEP Adult Treatment Panel III) [12], and was considered present if 3 or more parameters were found: abdominal circumference >88 cm in women and >102 cm in men; fasting triglycerides ≥150 mg/dL; fasting HDL cholesterol <50 mg/dL in women and <40 mg/dL in men; blood pressure ≥130/≥85 mm Hg; and fasting glucose ≥110 mg/dL. Systolic (SBP) and diastolic blood pressure (DBP), triglycerides, total, LDL, and HDL cholesterol were collected when available within 12 months of imaging. Fasting glucose obtained before PET/CT scan was recorded.
2.5 Statistical analyses
Statistical analysis was performed using JMP software (version 11, SAS Institute, Cary, NC, USA). Data are presented as mean ± standard deviation (SD). Multiple comparisons of parameters across BMI categories were performed using the Tukey-Kramer method. T-test was performed to detect differences between genders regarding tongue and upper airway parameters. Nonparametric linear regression analyses were performed to determine relationships between all parameters and Spearman’s rho values are reported. Analyses were adjusted for age and gender using multivariate standard least squares regression modeling. P<0.05 indicated statistical significance.
3. RESULTS
3.1 Clinical characteristics of study subjects
A total of 206 subjects [104 females, 102 males; overall mean (±SD) age of 56±17 y; overall mean BMI of 28±6.0 kg/m2, range 16–47 kg/m2] fulfilled the inclusion criteria outlined above. Included subjects underwent PET/CT for benign etiologies (n=61) or for follow-up of successfully treated malignancies (n=145) and had no evidence of active disease at imaging or FDG-avid areas to suggest malignancy. The mean interval between imaging and last treatment was 17 (range 1–120) months.
Mean intervals between PET/CT to blood pressure and serum lipids were 1.7 (0–11) months and 4.3 (0–12) months, respectively. Mean medication use was 39.8 (0–216) months (n=77) for anti-hypertensives, 52.4 (0–165) months (n=24) for type 2 diabetes medications, and 37.3 (0–135) months (n=59) for lipid-lowering agents. One-hundred and three patients (50%) had metabolic syndrome, of those 50 were females and 53 were males.
3.2 Tongue attenuation across genders and BMI groups
The overall mean TA was 31.1±15.6 HU. As outlined in Table 1, male subjects had significantly lower TA values compared to females (P=0.0002), which was independent of age and BMI (P<0.001). We also found gender differences in body composition parameters, with males having lower SAT (P=0.02) but higher VAT and NC compared to females (P<0.007), which was independent of age and BMI. In females, TA was progressively lower in overweight and obese compared to lean subjects (P=0.002 and P<0.0001, respectively), indicating progressively higher fatty infiltration with increased BMI. In males, this phenomenon was also seen, however significance was present when comparing lean versus obese subjects (P=0.03). Lean males had significantly lower TA values than lean females (P=0.0004), with this comparison approaching significance in overweight males versus females (P=0.06). The remaining comparisons between BMI groups and genders were not statistically significant (Figure 3). Of note, the masseter muscle showed no significant difference in HU when comparing females to males.
Table 1.
Study sample characteristics.
| Female (n=104) |
Male (n=102) |
P-value | |
|---|---|---|---|
| Age (y) | 57±16 | 55±18 | 0.45 |
| BMI (kg/m2) | 27.4±6.5 | 28.3±5.3 | 0.28 |
| Tongue attenuation (HU) | 35.1±17.6 | 27.0±12.2 | 0.0002* |
| Tongue CSA (cm2) | 24.7±3.5 | 29.6±4.5 | <.0001* |
| MPH (cm) | 1.2±0.6 | 1.7±0.8 | <.0001* |
| Pharyngeal length (cm) | 5.1±0.9 | 6.1±1.0 | <.0001* |
| Masseter attenuation (HU) | 55.0±10.4 | 55.1±10.6 | 0.92 |
| Abdominal circumference (cm) | 94.1±15.1 | 97.0±13.9 | 0.16 |
| Subcutaneous AT (cm2) | 270.8±140.7 | 227.7±114.2 | 0.02* |
| Visceral AT (cm2) | 109.9±75.8 | 140.2±82.4 | 0.007* |
| Neck circumference (cm) | 39.0±6.9 | 44.1±5.6 | <.0001* |
| Neck AT (cm2) | 33.6±27.4 | 32.8±22.7 | 0.80 |
P-values for comparison by t-test between female and male subjects.
P<.001 after multivariate adjustment for age and BMI.
Values are means±SD.
MPH, mandibular plane to hyoid bone distance; CSA, tongue cross-sectional area; AT, adipose tissue.
Figure 3.
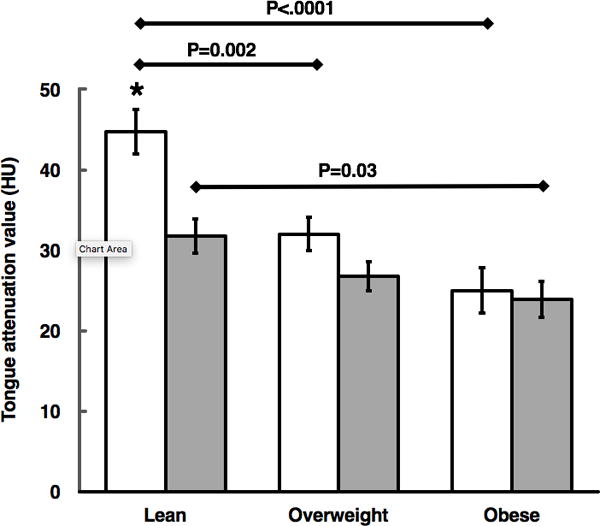
Mean differences in tongue adiposity per gender across BMI groups of lean, overweight, and obese subjects (females: white bars, males: gray bars). P values are for within-gender comparison across BMI categories using the Tukey-Kramer method. * denotes P=0.0004 for comparison between lean female versus male subjects by t test. Error bars denote ±standard error of mean.
3.3 Associations between tongue attenuation, upper airway and body composition
Males had significantly higher upper airway measures than females (P<0.0001) independent of age and BMI (P<0.001), suggesting higher upper airway soft tissue burden and narrower airways in males versus females. Overall, TA was negatively associated with upper airway measures (P<0.001), which persisted for MPH (P=0.0004) and pharyngeal length (P=0.006) after multivariate adjustment for age and gender (Table 2). In all subjects, TA was negatively associated with body composition parameters (all P<0.0001), with the strongest associations being with VAT (Spearman rho=−0.53) and NC (Spearman rho=−0.47). Associations between TA and body composition parameters were independent of age and gender (P<0.0001). TA values were lower in patients with metabolic syndrome (26.3±13.9 HU) compared to patients without metabolic syndrome (35.9±15.8 HU) (P<0.0001), which persisted after adjustment for age and gender (P=0.0009). Masseter attenuation values were significantly higher compared to TA (55.0±10.5 versus 31.1±15.6 HU, P<0.0001), suggesting higher fat content in the tongue. Attenuation values of the masseter were significantly associated with TA (r=0.29, P<0.0001) and body composition parameters (P<0.01).
Table 2.
Associations between tongue attenuation values with upper airway measures and body composition parameters in all subjects.
| Spearman’s rho | P-value | |
|---|---|---|
| Upper airway measures | ||
| Tongue CSA | −0.23 | 0.0009 |
| MPH | −0.41 | <.0001** |
| Pharyngeal length | −0.35 | <.0001* |
| Body composition parameters | ||
| BMI | −0.43 | <.0001† |
| Abdominal circumference | −0.44 | <.0001† |
| Subcutaneous AT | −0.27 | <.0001† |
| Visceral AT | −0.53 | <.0001† |
| Neck circumference | −0.47 | <.0001† |
| Neck AT | −0.43 | <.0001† |
P<0.01,
P<0.001,
P<0.0001 after multivariate adjustment for age and gender.
4. DISCUSSION
Our findings using CT attenuation values as a marker for tongue fat content are three-fold: (1) tongue fat content is higher in male subjects; (2) increased tongue fat content is associated with abnormal upper airway measures; (3) tongue fat accumulation parallels whole-body adiposity, with stronger relationships to parameters linked to increased cardiometabolic risk and is higher in subjects with metabolic syndrome.
The tongue is the most important pharyngeal dilator muscle with distinctive fiber composition that contributes to upper airway size, patency and shape [13,14]. Brennick et at. [5] showed in an animal model that increased intramuscular fat alters tongue morphology and reduces its contractile force [5]. Fat deposition also can lead to enlargement of the tongue, caudally displacing the hyoid bone and epiglottis, which are connected by the hypoepiglottic ligament [6] (Figure 1). Caudal displacement of the epiglottis causes increase of pharyngeal length, which is associated with increased pharyngeal critical closing pressure (Pcrit) and OSA severity [6]. In the present study, upper airway measures were significantly associated with TA and body composition, and were influenced by gender. Our findings are in line with previous observations showing that obesity may lead to an increase in tongue volume, inferior displacement of the hyoid and an increase in pharyngeal length, all of which contribute to increased upper airway collapsibility [6,15]. Interestingly, we also found that males had larger tongue CSA and pharyngeal length as compared to females. Tongue cross-sectional area and pharyngeal length have been previously shown to be larger among men as compared to women [16,17]. Therefore, obesity and male gender share similar mechanisms that increase the propensity of upper airway collapse by promoting tongue enlargement and pharyngeal lengthening (Figure 3). Although we did not have information regarding the presence of sleep disordered breathing or OSA in our cohort, our findings help support recent evidence linking tongue adiposity to OSA and its relationship to obesity [4,18]. Importantly, there is evidence that weight loss may improve upper airway patency. In a study of moderately obese subjects with moderate-to-severe OSA undergoing a 24-week sibutramine-assisted weight loss intervention, Sutherland et al. [19] demonstrated that approximately 8 kg of weight loss led to significant improvement of airway volume, with a cranial and posterior shift of the hyoid bone.
Abnormal body composition parameters are well-known predictors of cardiometabolic risk [20], with excessive VAT and SAT observed in abdominal obesity being linked to higher incidence of atherosclerosis, hepatic steatosis and diabetes [21]. CT and MRI have significantly advanced the non-invasive assessment of body composition, allowing accurate assessment of VAT, SAT and NAT [7,22,23]. Further, CT techniques have been used as robust estimators of muscle fat content in multiple anatomic locations, including thigh and psoas muscles [24,25]. In a prior study, Butler et al. [26] showed in a study of healthy older adults that CT TA was a feasible technique to determine tongue adiposity, however found no significant difference between genders probably due the small sample size. On the other hand, another study in which most participants had OSA, higher tongue adiposity was seen in females [27]. In our study, despite no significant difference in age or BMI between females and males, we found males had overall lower TA (i.e., higher fat content) compared to females. In sub-analyses of BMI categories, lower TA found in males was more pronounced in lean subjects, while in obese subjects, gender played no role in TA. The contrast between our results and prior studies may be linked to differences in population ages, clinical characteristics and cohort size. Nonetheless, given the broad range of BMI and body composition parameters in our subjects, we believe the results from our study may generalizable and serve as basis for future studies exploring differential tongue adiposity across genders and body composition.
Previous studies have shown that increased tongue fat deposition is more common in males, with different fat distribution patterns potentially having different implications in the development of OSA [28]. In keeping with these data we found that male subjects had lower TA compared to female subjects adjusted for age and BMI despite similar neck adipose tissue. Whittle et al. [29] showed that in age and BMI-matched patients, men had larger neck circumference than women but similar neck fat tissue volume. A similar finding was seen in a study by Torriani et al. [7], however men had significantly higher inter- and intra-muscular neck fat compared to women. In this regard, the preferentially lower TA seen in males in the current study may also reflect a gender-based predisposition for ectopic fat deposition in skeletal muscle. As expected, we found decreased TA values in subjects with metabolic syndrome. This phenomenon has also been seen in skeletal muscle as described by Lo et at. [30], in which muscle attenuation values obtained by CT scan of the thigh were lower in patients with metabolic syndrome than in healthy controls. We could infer that cytokines and hormones produced by adipose tissue in obesity and metabolic syndrome may also play an important role in tongue fat deposition.
Weight gain may increase the size of soft-tissue structures by a variety of mechanisms, including muscle cell hyperplasia or hypertrophy or extracellular fat deposition [23]. Importantly, this process may be associated with inflammatory cell infiltration into the upper airway soft tissues [5]. Previous studies have explored the association of obesity and tongue fat deposition. A prior study of obese patients with and without OSA [4,31] showed that those with OSA had greater tongue volume and fat deposition than those without OSA, adjusted for BMI, age, gender and race. In a human autopsy study, the tongue had a remarkably high percentage of fat, especially at its base, which was associated with BMI and tongue volume [32]. In addition, there is evidence of increased tongue fat infiltration in obese versus lean murine models, being greater in proportion to the general increase in fat at other skeletal muscle sites [5,33]. In this regard, a prior study examining the tongue and masseter by MR imaging found that the masseter muscle had a low percentage of fat and that tongue adiposity followed increased VAT, potentially being a unique ectopic fat depot in the face [4]. In keeping with this finding, our study showed the tongue had significantly lower attenuation values compared to the masseter. Nevertheless, the masseter attenuation values were positively associated with increased tongue and body adiposity, reflecting an expected generalized fat accumulation in skeletal muscles [9,34].
Our study has limitations due to its retrospective cross-sectional design using subjects with successfully treated malignancies or benign etiologies. Nevertheless, our database used full-body PET/CT imaging with a mean of 17 months from last treatment and measurements only from subjects with no active disease. Apnea-hypopnea index scores were not available for subjects in our cohort, limiting interpretation of our results in regards to the relationship of our tongue and whole-body adiposity measures to OSA or sleep disordered breathing. Finally, the cross-sectional nature of our study limits assessment of potential effects from weight loss interventions that could modulate tongue adiposity. Recent evidence suggests that weight loss can positively affect upper airway patency [19] underscoring the need for future longitudinal studies examining the role of tongue adiposity in OSA. Altogether, our findings support emerging evidence in the literature that tongue adiposity increases with whole-body adiposity and the link between obesity and OSA.
5. CONCLUSION
In summary, our study showed that tongue fat deposition as measured by CT attenuation values is associated to abnormal upper airway measures using whole-body cross-sectional imaging. Also these data were associated with abnormal measures of body composition and were significantly influenced by gender.
Acknowledgments
Funding: Supported in part by NIH/NIDDK P30DK040561, Nutrition and Obesity Research Center at Harvard.
Abbreviations
- TA
tongue attenuation
- PL
pharyngeal length
- MPH
mandibular-hyoid distance
- VAT
visceral adipose tissue area
- SAT
subcutaneous adipose tissue area
- NC
neck circumference
- NAT
neck adipose tissue area
- BMI
body mass index
Footnotes
Disclosure: All authors have no conflicts of interest.
Author contributions: IRBG, PG, MAB and MT conceived and carried out the study. IRBG, ELMS, AE and MT conceived the experiments and analyzed data. All authors were involved in writing the paper and had final approval of the submitted and published versions.
References
- 1.Young T, Peppard PE, Gottlieb DJ. Epidemiology of obstructive sleep apnea: a population health perspective. Am J Respir Crit Care Med. 2002;165:1217–39. doi: 10.1164/rccm.2109080. [DOI] [PubMed] [Google Scholar]
- 2.Heinzer R, Vat S, Marques-Vidal P, Marti-Soler H, Andries D, Tobback N, et al. Prevalence of sleep-disordered breathing in the general population: the HypnoLaus study. Lancet Respir Med. 2015;3:310–8. doi: 10.1016/S2213-2600(15)00043-0. [DOI] [PMC free article] [PubMed] [Google Scholar]
- 3.Schwab RJ, Gupta KB, Gefter WB, Metzger LJ, Hoffman EA, Pack AI. Upper airway and soft tissue anatomy in normal subjects and patients with sleep-disordered breathing. Significance of the lateral pharyngeal walls. Am J Respir Crit Care Med. 1995;152:1673–89. doi: 10.1164/ajrccm.152.5.7582313. [DOI] [PubMed] [Google Scholar]
- 4.Kim AM, Keenan BT, Jackson N, Chan EL, Staley B, Poptani H, et al. Tongue fat and its relationship to obstructive sleep apnea. Sleep. 2014;37:1639–48. doi: 10.5665/sleep.4072. [DOI] [PMC free article] [PubMed] [Google Scholar]
- 5.Brennick MJ, Delikatny J, Pack AI, Pickup S, Shinde S, Zhu JX, et al. Tongue fat infiltration in obese versus lean Zucker rats. Sleep. 2014;37:1095–102. 1102a–1102c. doi: 10.5665/sleep.3768. [DOI] [PMC free article] [PubMed] [Google Scholar]
- 6.Genta PR, Schorr F, Eckert DJ, Gebrim E, Kayamori F, Moriya HT, et al. Upper airway collapsibility is associated with obesity and hyoid position. Sleep. 2014;37:1673–8. doi: 10.5665/sleep.4078. [DOI] [PMC free article] [PubMed] [Google Scholar]
- 7.Torriani M, Gill CM, Daley S, Oliveira AL, Azevedo DC, Bredella MA. Compartmental neck fat accumulation and its relation to cardiovascular risk and metabolic syndrome. Am J Clin Nutr. 2014;100:1244–51. doi: 10.3945/ajcn.114.088450. [DOI] [PMC free article] [PubMed] [Google Scholar]
- 8.Goodpaster BH, He J, Watkins S, Kelley DE. Skeletal Muscle Lipid Content and Insulin Resistance: Evidence for a Paradox in Endurance-Trained Athletes. J Clin Endocrinol Metab. 2001;86:5755–61. doi: 10.1210/jcem.86.12.8075. [DOI] [PubMed] [Google Scholar]
- 9.Goodpaster BH, Thaete FL, Kelley DE. Thigh adipose tissue distribution is associated with insulin resistance in obesity and in type 2 diabetes mellitus. Am J Clin Nutr. 2000;71:885–92. doi: 10.1093/ajcn/71.4.885. [DOI] [PubMed] [Google Scholar]
- 10.Humbert IA, Reeder SB, Porcaro EJ, Kays SA, Brittain JH, Robbins J. Simultaneous estimation of tongue volume and fat fraction using IDEAL-FSE. J Magn Reson Imaging. 2008;28:504–8. doi: 10.1002/jmri.21431. [DOI] [PMC free article] [PubMed] [Google Scholar]
- 11.Schorr F, Kayamori F, Hirata RP, Danzi-Soares NJ, Gebrim EM, Moriya HT, et al. Different Craniofacial Characteristics Predict Upper Airway Collapsibility in Japanese-Brazilian and White Men. Chest. 2016;149:737–46. doi: 10.1378/chest.15-0638. [DOI] [PMC free article] [PubMed] [Google Scholar]
- 12.Third Report of the National Cholesterol Education Program (NCEP) Expert Panel on Detection, Evaluation, and Treatment of High Blood Cholesterol in Adults (Adult Treatment Panel III) final report. Circulation. 2002;106:3143–421. [PubMed] [Google Scholar]
- 13.Stål P, Marklund S, Thornell L-E, De Paul R, Eriksson P-O. Fibre composition of human intrinsic tongue muscles. Cells Tissues Organs. 2003;173:147–61. doi: 10.1159/000069470. [DOI] [PubMed] [Google Scholar]
- 14.Saboisky JP, Butler JE, Fogel RB, Taylor JL, Trinder JA, White DP, et al. Tonic and phasic respiratory drives to human genioglossus motoneurons during breathing. J Neurophysiol. 2006;95:2213–21. doi: 10.1152/jn.00940.2005. [DOI] [PubMed] [Google Scholar]
- 15.Chi L, Comyn F-L, Mitra N, Reilly MP, Wan F, Maislin G, et al. Identification of craniofacial risk factors for obstructive sleep apnoea using three-dimensional MRI. Eur Respir J. 2011;38:348–58. doi: 10.1183/09031936.00119210. [DOI] [PMC free article] [PubMed] [Google Scholar]
- 16.Malhotra A, Huang Y, Fogel RB, Pillar G, Edwards JK, Kikinis R, et al. The male predisposition to pharyngeal collapse: importance of airway length. Am J Respir Crit Care Med. 2002;166:1388–95. doi: 10.1164/rccm.2112072. [DOI] [PubMed] [Google Scholar]
- 17.Liégeois F, Albert A, Limme M. Comparison between tongue volume from magnetic resonance images and tongue area from profile cephalograms. Eur J Orthod. 2010;32:381–6. doi: 10.1093/ejo/cjp105. [DOI] [PubMed] [Google Scholar]
- 18.Isono S. Obesity and obstructive sleep apnoea: mechanisms for increased collapsibility of the passive pharyngeal airway. Respirol Carlton Vic. 2012;17:32–42. doi: 10.1111/j.1440-1843.2011.02093.x. [DOI] [PubMed] [Google Scholar]
- 19.Sutherland K, Lee RWW, Phillips CL, Dungan G, Yee BJ, Magnussen JS, et al. Effect of weight loss on upper airway size and facial fat in men with obstructive sleep apnoea. Thorax. 2011;66:797–803. doi: 10.1136/thx.2010.151613. [DOI] [PubMed] [Google Scholar]
- 20.Britton KA, Massaro JM, Murabito JM, Kreger BE, Hoffmann U, Fox CS. Body fat distribution, incident cardiovascular disease, cancer, and all-cause mortality. J Am Coll Cardiol. 2013;62:921–5. doi: 10.1016/j.jacc.2013.06.027. [DOI] [PMC free article] [PubMed] [Google Scholar]
- 21.Faria G, Goncalves A, Cunha R, Guimaraes JT, Calhau C, Preto J, et al. Beyond central adiposity: liver fat and visceral fat area are associated with metabolic syndrome in morbidly obese patients. Int J Surg Lond Engl. 2015;14:75–9. doi: 10.1016/j.ijsu.2014.12.028. [DOI] [PubMed] [Google Scholar]
- 22.Goodpaster BHH, Krishnaswami S, Harris TBB, Katsiaras A, Kritchevsky SBB, Simonsick EMM, et al. Obesity, regional body fat distribution, and the metabolic syndrome in older men and women. Arch Intern Med. 2005;165:777–83. doi: 10.1001/archinte.165.7.777. [DOI] [PubMed] [Google Scholar]
- 23.Neeland IJ, Ayers CR, Rohatgi AK, Turer AT, Berry JD, Das SR, et al. Associations of visceral and abdominal subcutaneous adipose tissue with markers of cardiac and metabolic risk in obese adults. Obes Silver Spring. 2013;21:E439–47. doi: 10.1002/oby.20135. [DOI] [PMC free article] [PubMed] [Google Scholar]
- 24.Goodpaster BHH, Thaete FLL, Kelley DEE. Thigh adipose tissue distribution is associated with insulin resistance in obesity and in type 2 diabetes mellitus. Am J Clin Nutr. 2000;71:885–92. doi: 10.1093/ajcn/71.4.885. [DOI] [PubMed] [Google Scholar]
- 25.Torriani M, Hadigan C, Jensen ME, Grinspoon S. Psoas muscle attenuation measurement with computed tomography indicates intramuscular fat accumulation in patients with the HIV-lipodystrophy syndrome. J Appl Physiol. 2003;95:1005–10. doi: 10.1152/japplphysiol.00366.2003. [DOI] [PubMed] [Google Scholar]
- 26.Butler SG, Lintzenich CR, Leng X, Stuart A, Feng X, Carr JJ, et al. Tongue adiposity and strength in healthy older adults. Laryngoscope. 2012;122:1600–4. doi: 10.1002/lary.23290. [DOI] [PMC free article] [PubMed] [Google Scholar]
- 27.Barkdull GC, Kohl Ca, Patel M, Davidson TM. Computed tomography imaging of patients with obstructive sleep apnea. The Laryngoscope. 2008;118:1486–92. doi: 10.1097/MLG.0b013e3181782706. [DOI] [PubMed] [Google Scholar]
- 28.Lin CM, Davidson TM, Ancoli-Israel S. Gender differences in obstructive sleep apnea and treatment implications. Sleep Med Rev. 2008;12:481–96. doi: 10.1016/j.smrv.2007.11.003. [DOI] [PMC free article] [PubMed] [Google Scholar]
- 29.Whittle AT, Marshall I, Mortimore IL, Wraith PK, Sellar RJ, Douglas NJ. Neck soft tissue and fat distribution: comparison between normal men and women by magnetic resonance imaging. Thorax. 1999;54:323–8. doi: 10.1136/thx.54.4.323. [DOI] [PMC free article] [PubMed] [Google Scholar]
- 30.Lo J, Bernstein LEE, Canavan B, Torriani M, Jackson MBB, Ahima RSS, et al. Effects of TNF-alpha neutralization on adipocytokines and skeletal muscle adiposity in the metabolic syndrome. Am J Physiol Endocrinol Metab. 2007;293:E102–9. doi: 10.1152/ajpendo.00089.2007. [DOI] [PMC free article] [PubMed] [Google Scholar]
- 31.Kim AM, Keenan BT, Jackson N, Chan EL, Staley B, Torigian DA, et al. Metabolic activity of the tongue in obstructive sleep apnea. A novel application of FDG positron emission tomography imaging. Am J Respir Crit Care Med. 2014;189:1416–25. doi: 10.1164/rccm.201310-1753OC. [DOI] [PMC free article] [PubMed] [Google Scholar]
- 32.Nashi N, Kang S, Barkdull GC, Lucas J, Davidson TM. Lingual fat at autopsy. Laryngoscope. 2007;117:1467–73. doi: 10.1097/MLG.0b013e318068b566. [DOI] [PubMed] [Google Scholar]
- 33.Brennick MJ, Pack AI, Ko K, Kim E, Pickup S, Maislin G, et al. Altered upper airway and soft tissue structures in the New Zealand Obese mouse. Am J Respir Crit Care Med. 2009;179:158–69. doi: 10.1164/rccm.200809-1435OC. [DOI] [PMC free article] [PubMed] [Google Scholar]
- 34.Goodpaster BH, Theriault R, Watkins SC, Kelley DE. Intramuscular lipid content is increased in obesity and decreased by weight loss. Metabolism. 2000;49:467–72. doi: 10.1016/s0026-0495(00)80010-4. [DOI] [PubMed] [Google Scholar]


