Published ahead of print January 19, 2017.
Abstract
BACKGROUND:
It has been suggested that longer-term postsurgical outcome may be adversely affected by less than severe hypotension under anesthesia. However, evidence-based guidelines are unavailable. The present study was designed to develop a method for identifying patients at increased risk of death within 30 days in association with the severity and duration of intraoperative hypotension.
METHODS:
Intraoperative mean arterial blood pressure recordings of 152,445 adult patients undergoing noncardiac surgery were analyzed for periods of time accumulated below each one of the 31 thresholds between 75 and 45 mm Hg (hypotensive exposure times). In a development cohort of 35,904 patients, the associations were sought between each of these 31 cumulative hypotensive exposure times and 30-day postsurgical mortality. On the basis of covariable-adjusted percentage increases in the odds of mortality per minute elapsed of hypotensive exposure time, certain sets of exposure time limits were calculated that portended certain percentage increases in the odds of mortality. A novel risk-scoring method was conceived by counting the number of exposure time limits that had been exceeded within each respective set, one of them being called the SLUScore. The validity of this new method in identifying patients at increased risk was tested in a multicenter validation cohort consisting of 116,541 patients from Cleveland Clinic, Vanderbilt and Saint Louis Universities. Data were expressed as 95% confidence interval, P < .05 considered significant.
RESULTS:
Progressively greater hypotensive exposures were associated with greater 30-day mortality. In the development cohort, covariable-adjusted (age, Charlson score, case duration, history of hypertension) exposure limits were identified for time accumulated below each of the thresholds that portended certain identical (5%–50%) percentage expected increases in the odds of mortality. These exposure time limit sets were shorter in patients with a history of hypertension. A novel risk score, the SLUScore (range 0–31), was conceived as the number of exposure limits exceeded for one of these sets (20% set). A SLUScore > 0 (average 13.8) was found in 40% of patients who had twice the mortality, adjusted odds increasing by 5% per limit exceeded. When tested in the validation cohort, a SLUScore > 0 (average 14.1) identified 35% of patients who had twice the mortality, each incremental limit exceeded portending a 5% compounding increase in adjusted odds of mortality, independent of age and Charlson score (C = 0.73, 0.72–0.74, P < .05).
CONCLUSIONS:
The SLUScore represents a novel method for identifying nearly 1 in every 3 patients experiencing greater 30-day mortality portended by more severe intraoperative hypotensive exposures.
Besides maintaining normal oxygen saturation, adequate blood pressure control is one of the major concerns of anesthesia providers caring for patients undergoing surgical procedures. Although it is commonly accepted that severe hypotension is poorly tolerated, there is mounting evidence that longer-term outcomes may be affected by extended periods of less severe hypotension in patients surviving the immediate perioperative period.1–12 However, relatively little is known about what blood pressure may be acceptable with the goal of getting patients not only through the surgery alive (without major intraoperative complications), but also minimizing any longer-term adverse outcome. Efforts to date have been largely concerned with trying to identify some distinct blood pressure threshold deemed to be critically low, consistent with the design limitation of conventional blood pressure monitors, which typically lack the ability to alert to anything but the most recent reading falling below a certain threshold, or the time spent below some particular threshold. In either case, patients are being categorized in an essentially binary fashion with regard to risk such that any potential intervention is either deemed unnecessary or basically too late by the time the criterion indicating significant hypotension is met. Therefore, it would be desirable to find a method that might allow risk to be quantified in a progressive rather than binary fashion.
In this regard, modern electronic anesthesia information management systems (AIMS) offer the potential of more sophisticated clinical decision support (DSS) functionality by being able to take into consideration more comprehensive information, including pertinent preexisting conditions (such as a history of hypertension), as well as both the severity and the duration of patients’ deviation from certain vital sign ranges over the course of an entire case. Ideally, one of the desirable features of such systems could be “smart” alarms designed to detect and, preferentially, notify providers to certain levels of progressive risk for adverse outcome attributable to such deviations that may be amenable, to some extent, to their mitigation.
With this goal in mind, the hypothesis was tested that postoperative outcome may be associated with not only the severity of hypotension, but also the duration of hypotensive periods of time accumulated below a range of mean arterial blood pressure (MAP) thresholds that are commonly encountered during anesthesia. The specific goals were not to derive a predictive model for 30-day mortality; that is, to try to predict which patients will die. Rather, the goal was to create a method that would allow certain fractions of patients to be identified who may be at some increased risk portended by hypotensive exposures.
Toward that end, the specific objectives of the present study were 4-fold: (1) to assess the prevalence of intraoperative hypotensive exposures; (2) to determine the association of intraoperative hypotensive exposures with 30-day postsurgical mortality after adjustment for those main confounding factors that are principally unalterable at the time of surgery (primarily patient age and comorbidity, but not necessarily surgical procedures that could conceivably be modified in the future in such a way that these might incur less risk and also potentially less hypotension if that should be deemed harmful and contributing to the overall risk); (3) to create a (logarithmic) ratio scale quantifying such (partially) adjusted risk associated with hypotensive exposures; (4) to accomplish the above while solely depending on routinely captured clinical information, with all its associated limitations including those of International Classification of Diseases, Ninth Revision (ICD-9) coding and the fact that vital signs may not be acquired more often than every 5 minutes consistent with the applicable monitoring standard. This was done to make any potential findings as easy as possible for other investigators to replicate without requiring any special equipment or technology other than the availability of a generic electronic medical record (EMR) and off-the-shelf AIMS.
METHODS
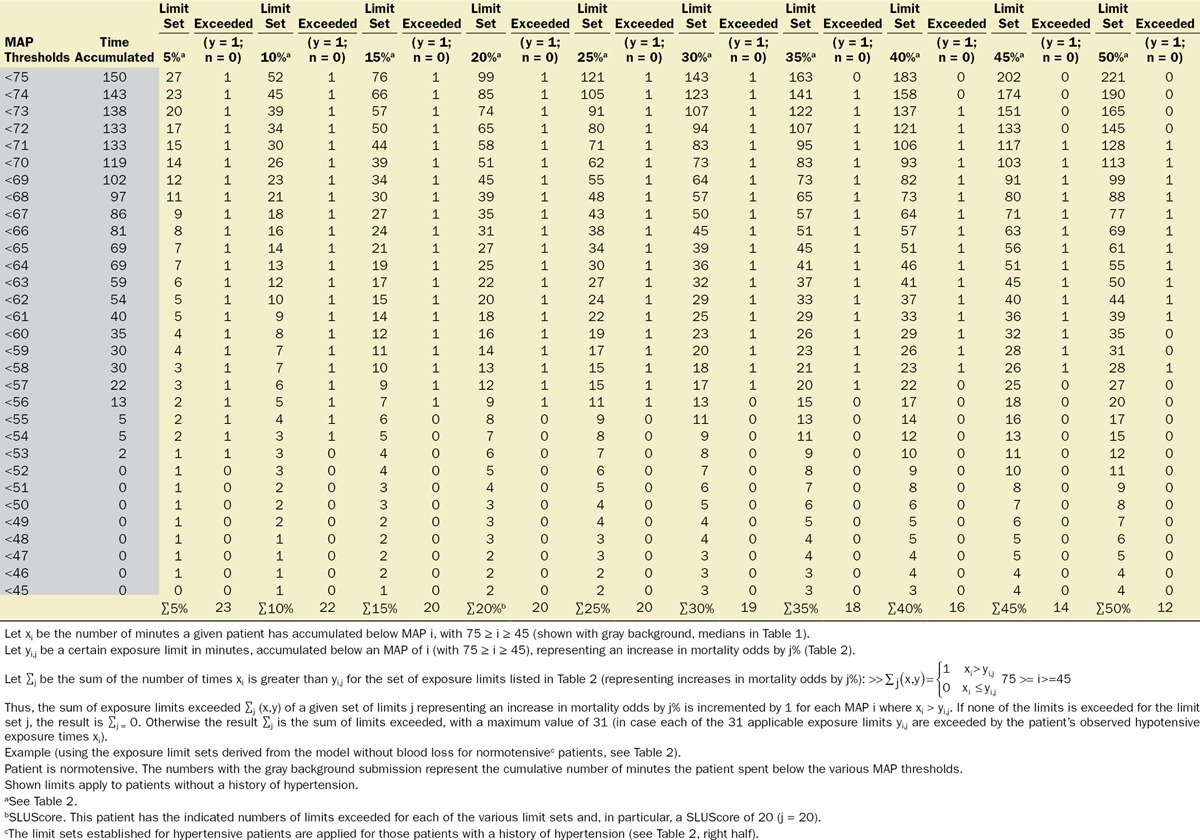
With approval from their respective institutional review boards, the Cleveland Clinic Anesthesia Information Management System, the Vanderbilt Medical Center, and the Saint Louis University Medical Center anesthesia databases were queried for the intraoperative records of adult patients undergoing noncardiac procedures. Extracted information included patient demographics (age, sex); Charlson comorbidity score, derived from the patients’ list of preexisting diagnoses (problem list ICD-9 codes)13; type of anesthetic; case duration; cumulative amount of documented blood loss; minute-to-minute MAP values; and all-cause mortality within 30 days of surgery, derived from the US Social Security Death Index Master File. As indicated above, while likely a rather strong confounding variable (for overall risk, as well as for the occurrence and severity of hypotension, see Discussion), procedural codes were not included nor was their actuarial risk adjusted for in the model for several reasons, including (1) that it would be difficult to do so given the wide variety of types of procedures and small numbers of sufficiently homogeneous procedures (see Discussion); (2) to not inadvertently adjust for some, as yet unidentified components of actuarial risk of these procedures which, once identified, might allow these risk portions to be potentially reduced in the future, such as, for instance, by becoming less invasive and incurring less extensive hypotensive exposures that might possibly account for some portion of the total risk historically associated with certain procedures. This conundrum was discussed recently in connection with the “triple low” concept.7 Thus, “adjustment” will be meant to indicate the limited adjustment of the various models for only explicitly stated confounding variables, not the types of procedure or their actuarial risk. The diagnosis of preoperative hypertension was considered and determined according to the presence of any one of several ICD-9 codes (401.xx; 402.xx; 403.xx; 404.xx; or 405.xx). For each minute of every case, patients’ effective MAP was deemed to have been the largest of the most recent automatically acquired noninvasive MAP value (obtained within the immediately preceding 5-minute period) or the most recent invasive MAP value acquired contemporaneously (continuously recorded at 1-minute intervals), rejecting values of less than 30 mm Hg as presumed artifacts. For every patient, the cumulative periods of time were calculated for which the effective MAP was below each one of the array of 31 hypotensive thresholds ranging from 75 to 45 mm Hg, using SQL Management Server 2008 and EXCEL 2010 with VBA (Microsoft Corporation, Redmond, WA).14 An example of the cumulative hypotensive exposure times found in 1 patient is shown in Table 3 (on the left, with the gray background). Multivariable logistic regression analyses were performed using Unistat 6.0 software (London, UK) to determine the association with mortality. Confidence intervals of interacting variables were calculated from the applicable covariance matrices. Data were expressed as median and quartiles or as mean and 95% confidence intervals (CIs). P values less than .05 were considered indicating statistical significance.
Table 3.
Method Used to Calculate the Number of Exposure Limits Exceeded (Including the SLUScore)
Development Cohort
Multivariable logistic regression was employed to ascertain within a development subset of patient records (35,904 patients, undergoing surgery on Cleveland Clinic’s main campus between January 1, 2009, and September 30, 2010) any factors associated with increased 30-day mortality, including the respective amounts of time spent below each one of the 31 MAP thresholds between 75 and 45 mm Hg. A separate regression model was constructed for the respective times accumulated below each one of these 31 MAP thresholds. As a result, for each MAP threshold, the percentage increase in the odds of 30-day mortality was determined per minute of time accumulated. From these values, the numbers of minutes were calculated, for each of the MAP thresholds, to be expected as having to accumulate, below that threshold, to portend certain identical percentage increases in the odds of 30-day mortality in the range between 5% and 50%. Within each of the resulting “smart exposure limit sets” of exposure times portending the same expected percentage increases in mortality odds, the following information was obtained: (1) fraction of patients exceeding one or more of these exposure limits; (2) number of exposure limits exceeded; (3) observed mortality of patients exceeding none of the limits; (4) observed mortality of patients exceeding one or more of these limits; (5) the adjusted increase in the odds of mortality per exposure time limit that had been exceeded. The exact algorithm of how to determine the number of exposure time limits exceeded for each of the “smart exposure limit sets” is described in detail in Table 3. The number of exposure limits exceeded of one of these “smart exposure limit sets,” the 20% limit set, was eventually selected to represent the SLUScore, a novel risk score portending an approximate 5% expected compounding progression of the odds of 30-day mortality per increment (each additional exposure time limit exceeded). This selection was based on the slightly highest C-score of the regression model for this particular set of limits.
Validation Cohort
The validity of SLUScore in identifying fractions of patients at an increased risk of adverse outcomes was assessed in a validation cohort of another 116,541 patient records from 3 different care settings (40,065 patients from Cleveland Clinic main campus, operated on between October 2010 and May 2012; 26,676 patients from Vanderbilt Medical Center, operated on between January and December 2011; and 49,800 patients from Saint Louis University Medical Center, operated on between October 2007 and October 2013), by comparing these patients’ cumulative intraoperative hypotensive exposure times against the various “smart exposure limit sets” and calculating the numbers of exposure limits exceeded, including the SLUScore, by using the algorithm described in Table 3. Within each “exposure limit set,” the following information was reported: (1) fraction of patients exceeding any one or more of these exposure limits; (2) number of exposure limits exceeded; (3) observed mortality of patients exceeding none of the limits; (4) observed mortality of patients exceeding one or more of these limits; (5) the covariable-adjusted increase in the odds of mortality per exposure time limit exceeded.
RESULTS
Development of the SLUScore (Development Cohort)
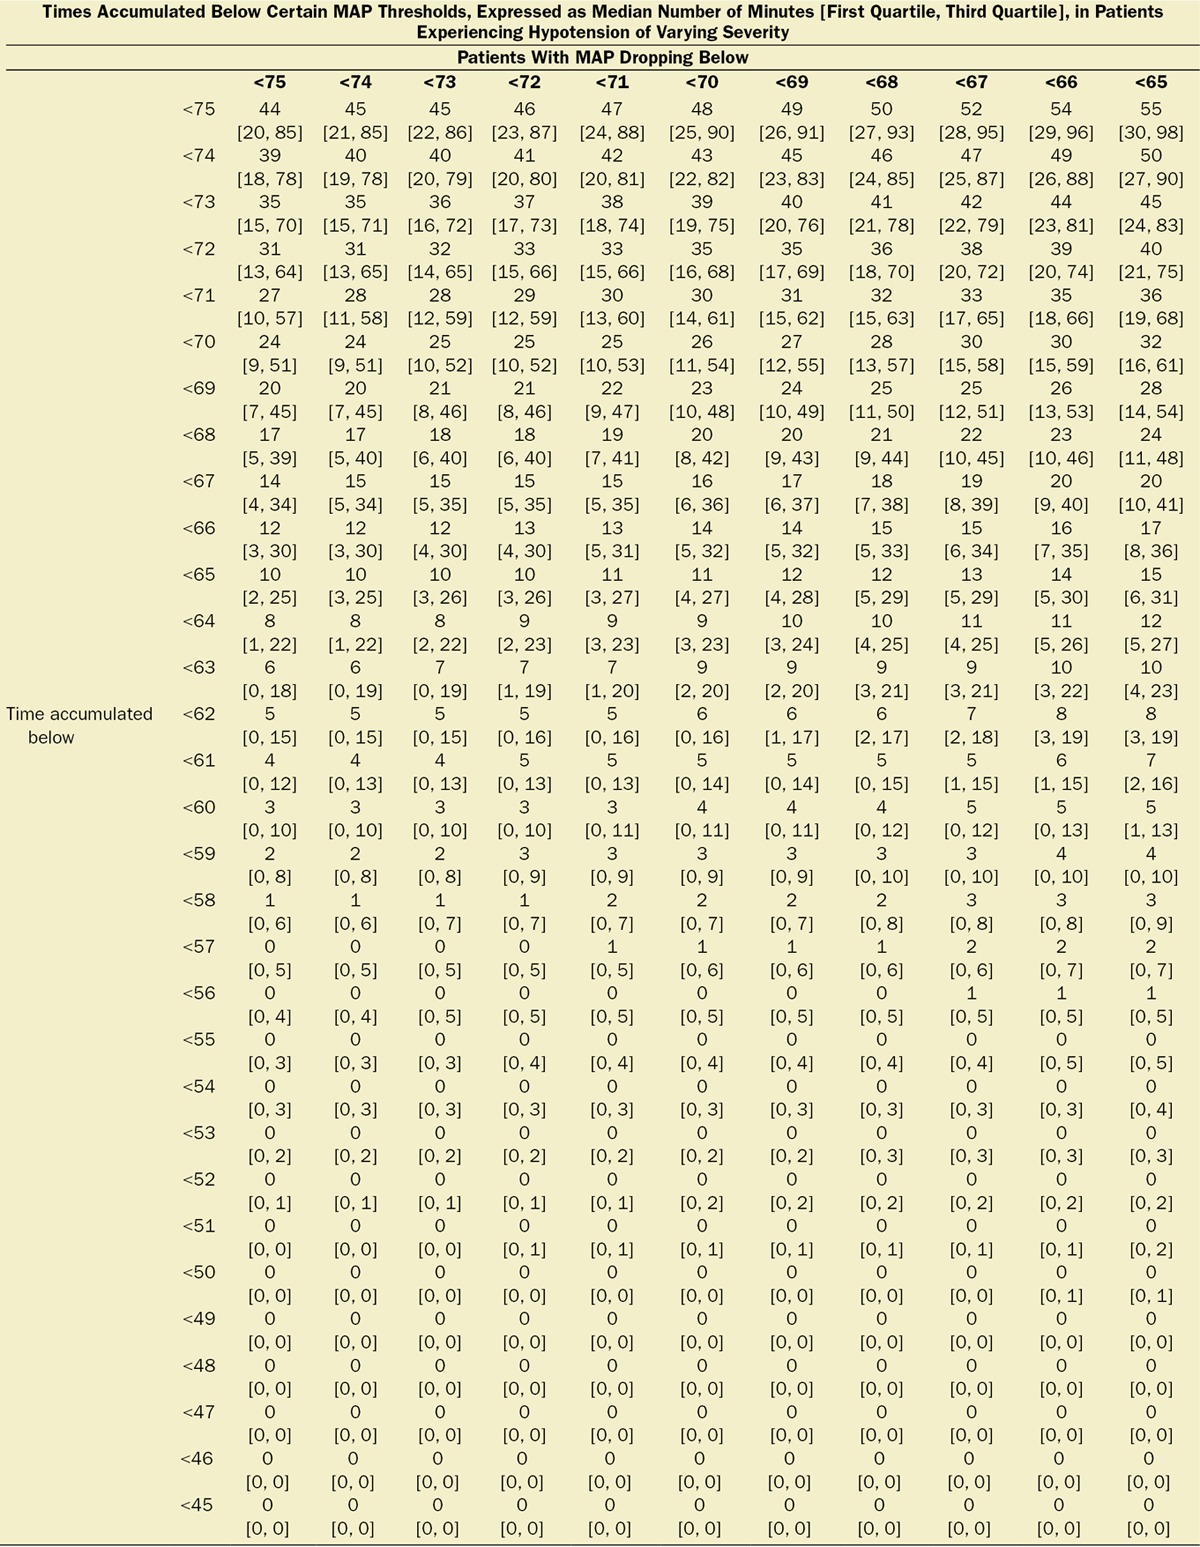
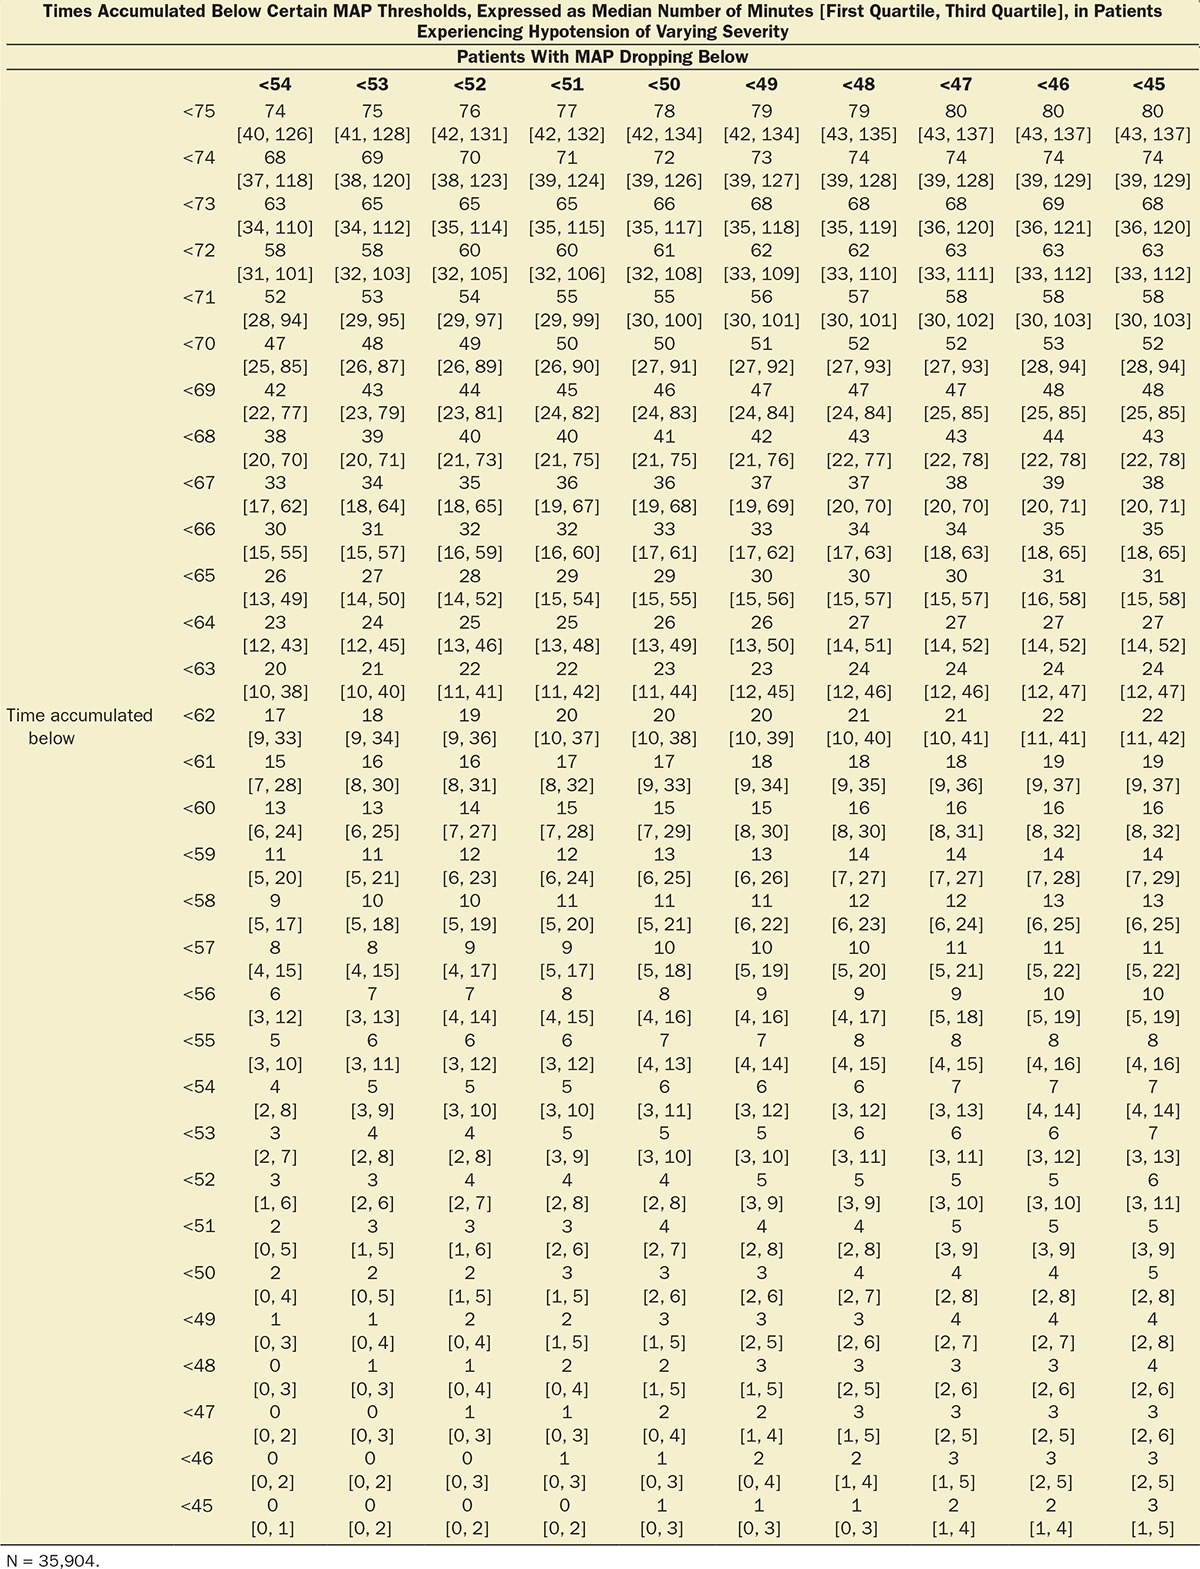
Of a total of 44,968 cases originally retrieved from Cleveland Clinic’s main campus, complete sets of data were obtained for 35,904 cases of patients who survived the intraoperative period and experienced an overall all-cause 30-day mortality of 1.8%. The median case duration was 179 (118–259) minutes, with anesthetic techniques consisting of inhalational anesthesia (82.9%), intravenous anesthesia (7.2%), spinal (4.9%), epidural (0.9%), peripheral nerve block (0.3%), and monitored anesthesia care (3.9%). Intraoperative hypotension was common, with MAP dropping below 75 mm Hg in 92% of cases and below 45 mm Hg in 10% of cases (Figure 1). Worsening hypotension (any amount of time spent below progressively lower MAP thresholds) was reflected in larger cumulative amounts of time spent below each of the 31 thresholds across the entire array of MAP thresholds (Figure 1; Table 1) and, associated with this, a progressive increase in 30-day mortality (Figure 1).4
Figure 1.
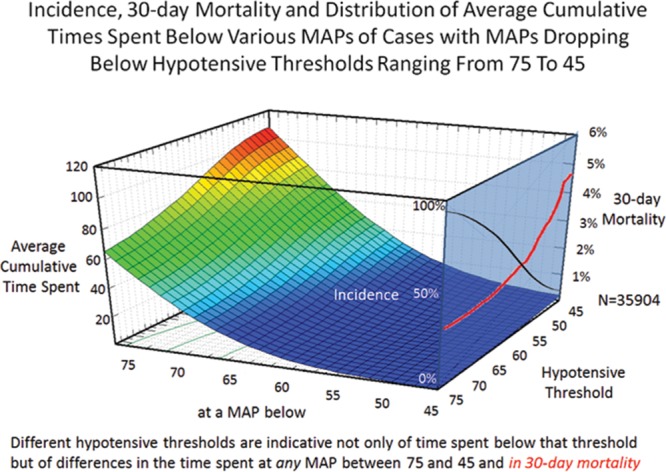
Different hypotensive thresholds are indicative not only of time spent below that threshold but of differences in the average cumulative time spent below any mean arterial blood pressure (MAP) between 75 and 45 mm Hg. While nearly all patients crossed the 75 mm Hg threshold, incidence decreased (right blue plane, black curve), whereas 30-day mortality increased (red curve) of patients crossing progressively lower MAP thresholds.4
Table 1.
Median [First, Third Quartiles] of Cumulative Hypotensive Exposure Times Below Various MAP Thresholds

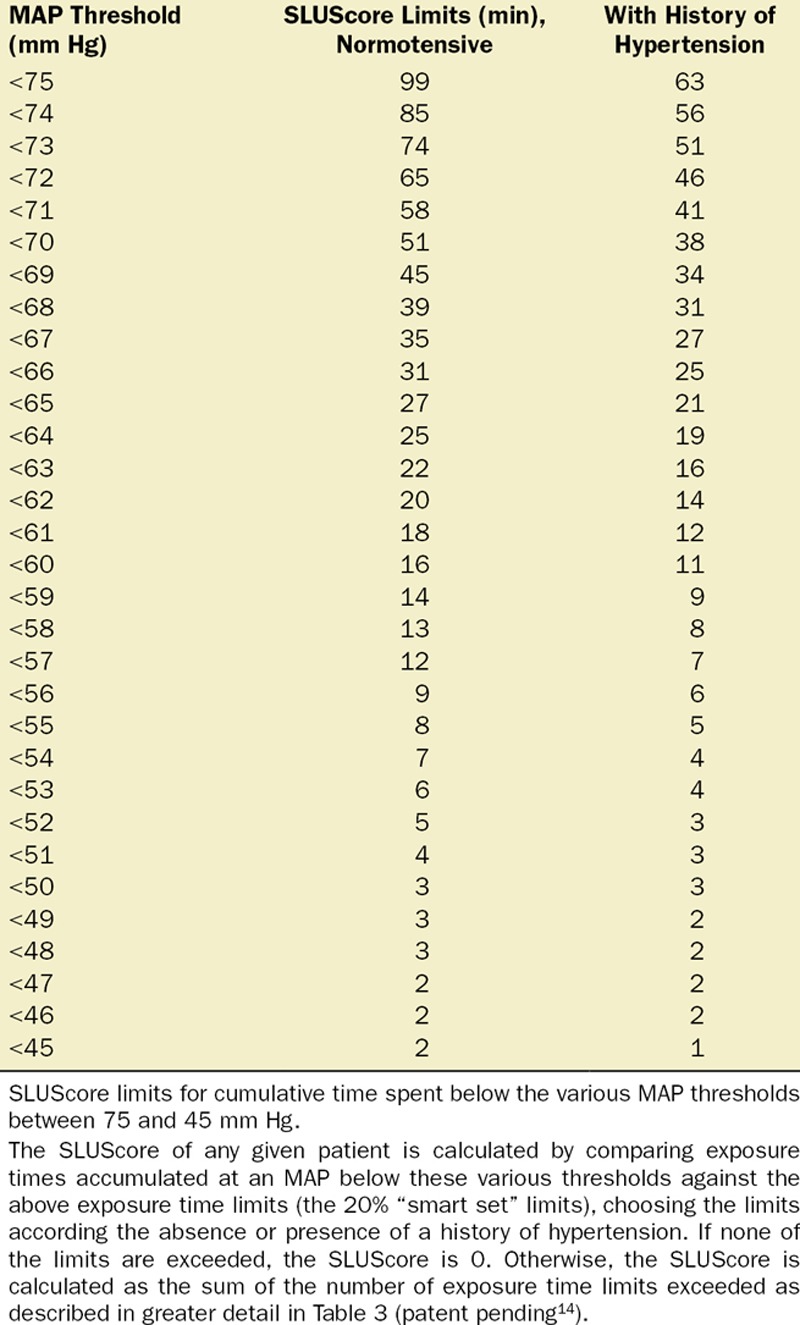
Multivariable logistic regression (mean [CI]) identified patient age (1.043 [1.037–1.049], per year), Charlson comorbidity score (1.193 [1.161–1.227], per increment), and cumulative amount of blood loss (1.038 [1.027–1.049], per 500 mL) as independent factors associated with increased 30-day mortality. All subsequent analyses involving MAP were adjusted for these, as well as case duration. Two different models were constructed, one considering blood loss and one without. The reason for this distinction is that blood loss is typically only known after the fact (at the end of surgery), whereas the other data are available in real time when information gleaned from these risk models might be most useful in the future. The essentially analogous results for both these approaches are listed in Table 2. The relationship between the severity of hypotension (the hypotensive MAP threshold dropped below), the cumulative amount of time spent below that threshold, and adjusted odds of 30-day mortality is listed in Table 2 and graphically depicted in Figure 2. As demonstrated in the figure, as well as in Table 2, dropping below progressively lower MAP thresholds portended a progressively greater increase in 30-day mortality per unit of time accumulated below that threshold. For any given MAP threshold, patients carrying a preoperative diagnosis of hypertension (prevalence of 40% according to the definition above) required less cumulative time to be accrued below that threshold to incur the same increase in 30-day mortality as did patients without a history of hypertension (see Table 2, as well as red lines in Figure 2, depicting the intersection with the plane indicating identical 20% increases in the odds of mortality). The cumulative exposure times expected to portend the same percentage increase in the odds of 30-day mortality (“smart set exposure limits”), shown in Table 2 (pink background), were used to compare patients exceeding these limits with those not exceeding these limits, using the method and algorithm described in Table 3. The result of these analyses is listed in Table 4. Within each set of “smart exposure limits,” patients exceeding these limits exhibited greater mortality than patients not exceeding these limits. The total increase in mortality depended on the number of exposure limits exceeded, with each incremental limit exceeded portending a compounding further increase in the odds ratio for 30-day mortality (Table 4). On the basis of the slightly highest C-score of 0.80 (0.78–0.82), the 20% “smart set” of exposure limits resulting from the model without considering blood loss was selected as the basis for determining the so-called SLUScore, the novel risk score. The SLUScore was calculated, along with the number of exposure time limits exceeded of each of the other “smart exposure limit sets,” for each patient in the following analyses, to quantify hypotensive exposures and examine their association with outcome. The SLUScore exposure limits for patients with and without a history of hypertension are listed separately in Table 5.
Table 2.
Increase in Mortality Odds per Minute and Calculated Number of Minutes Expected to Portend Certain % Increases in Odds
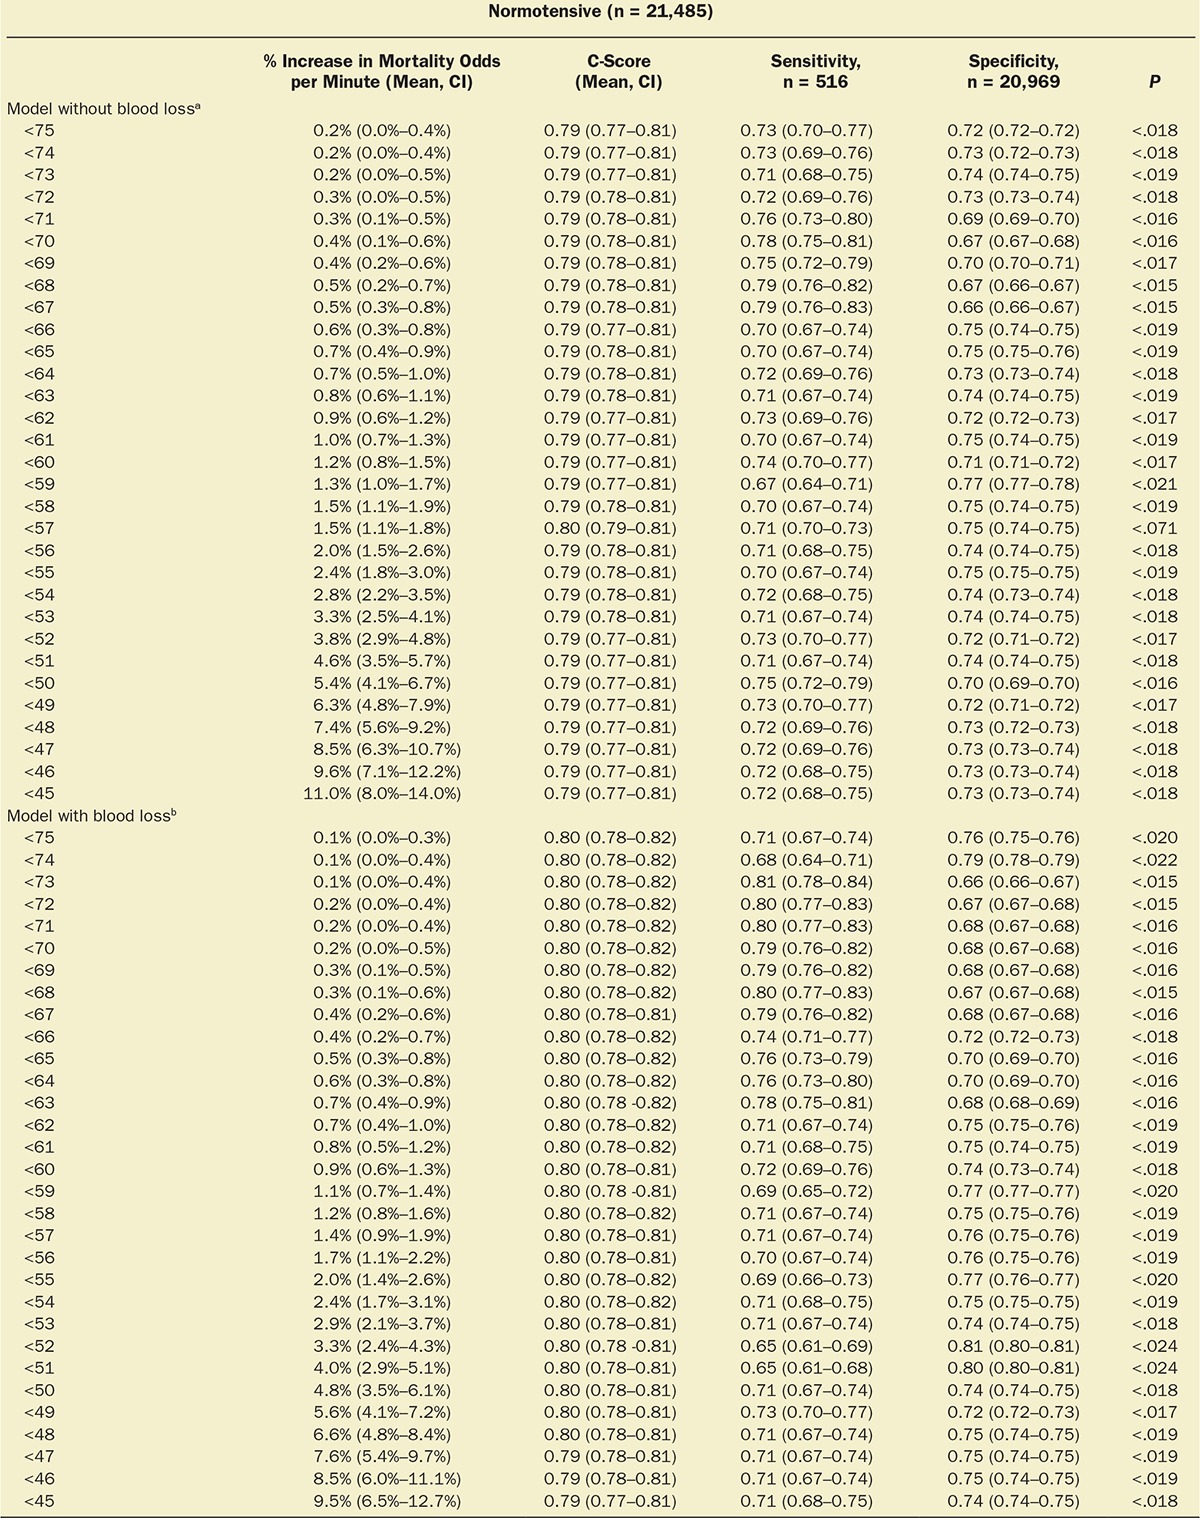
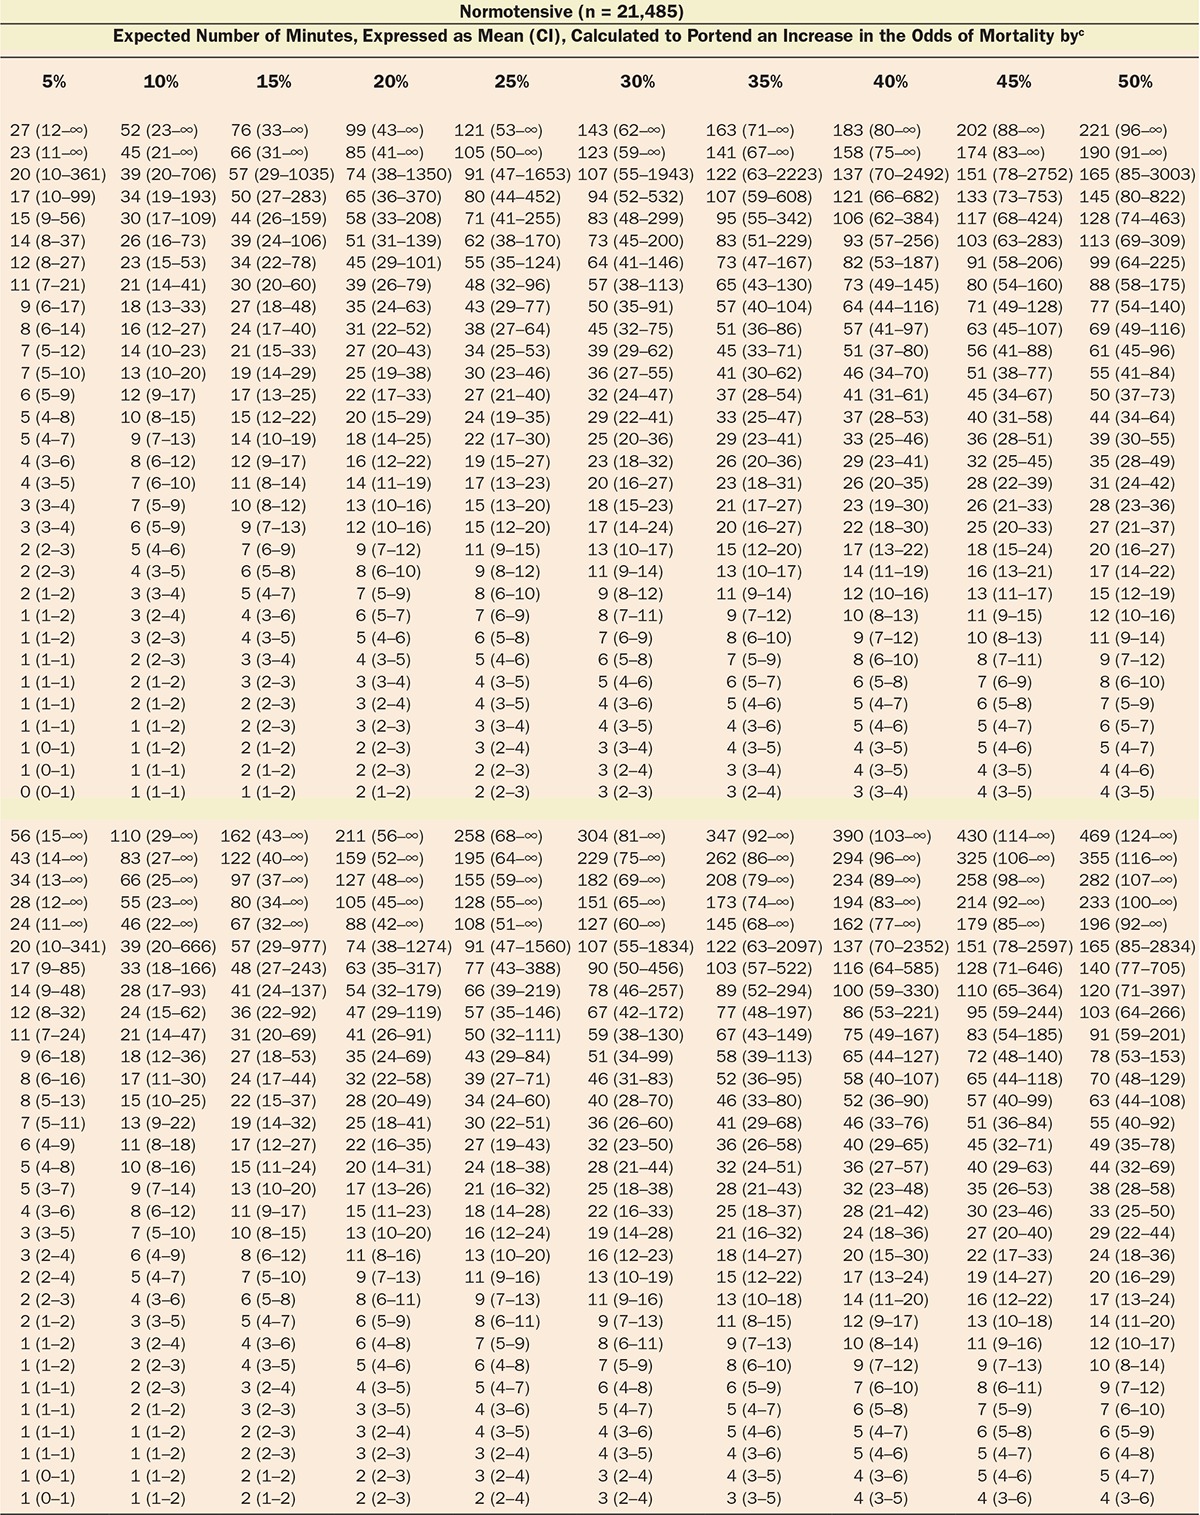
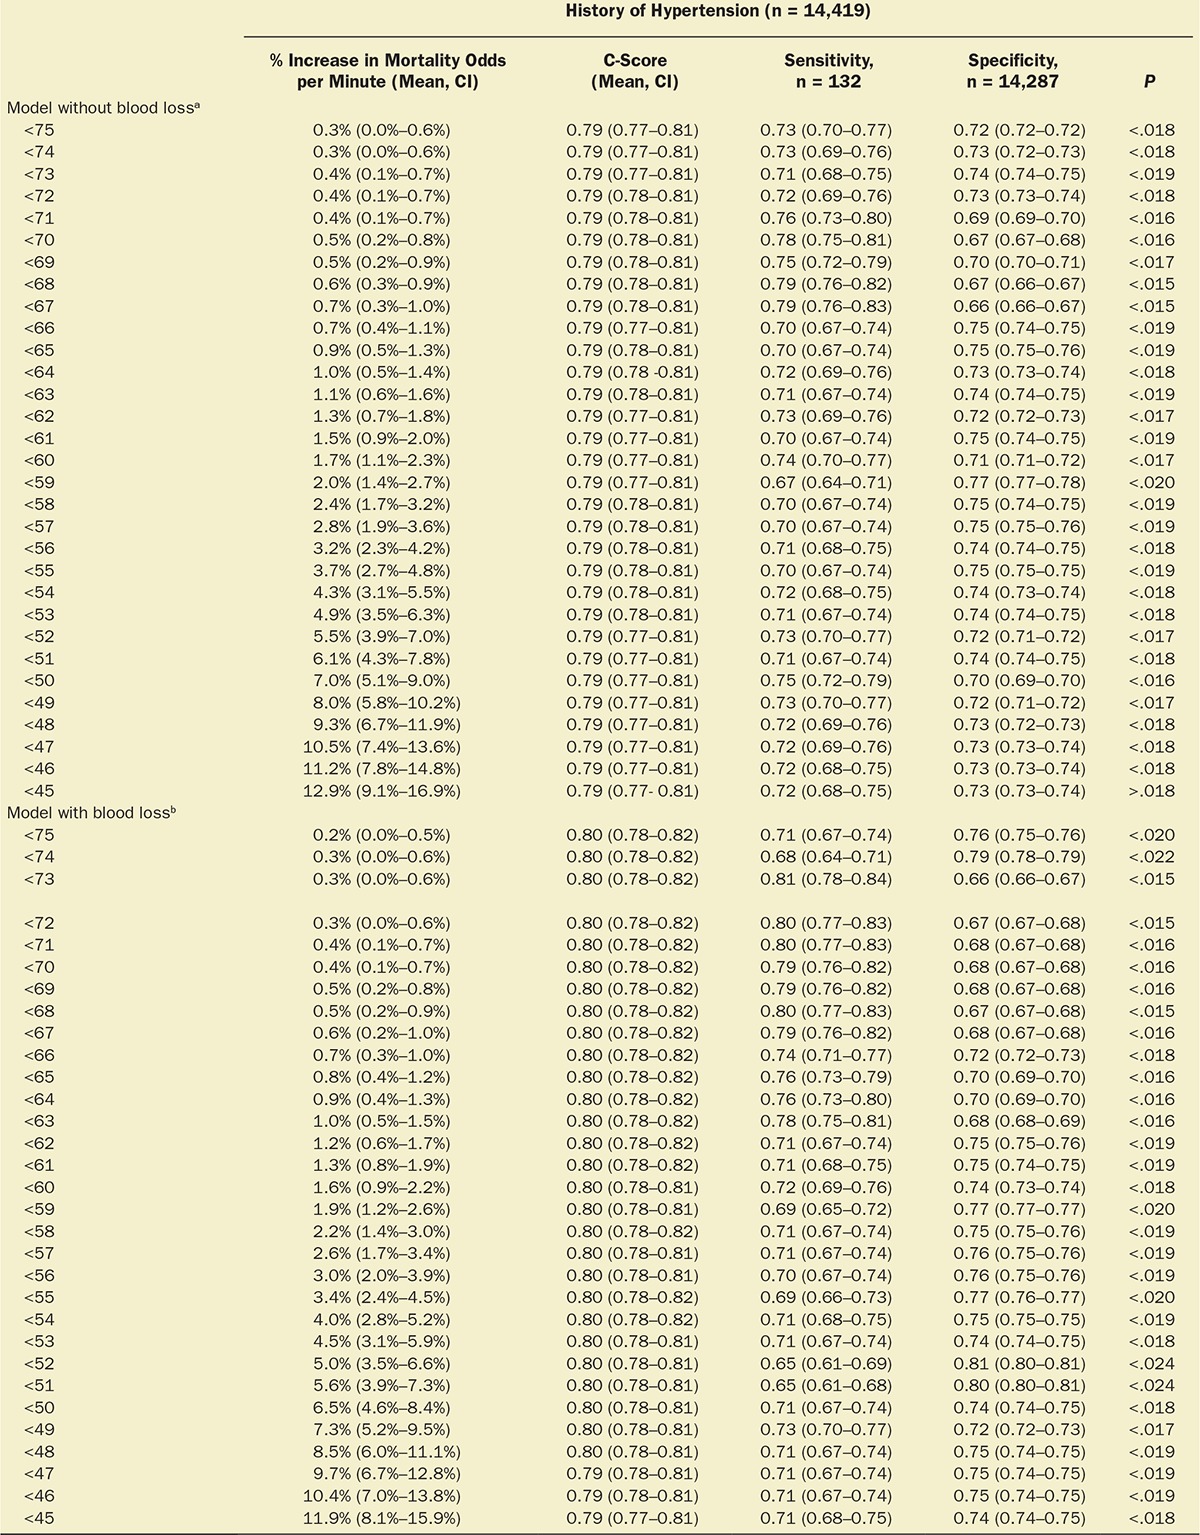
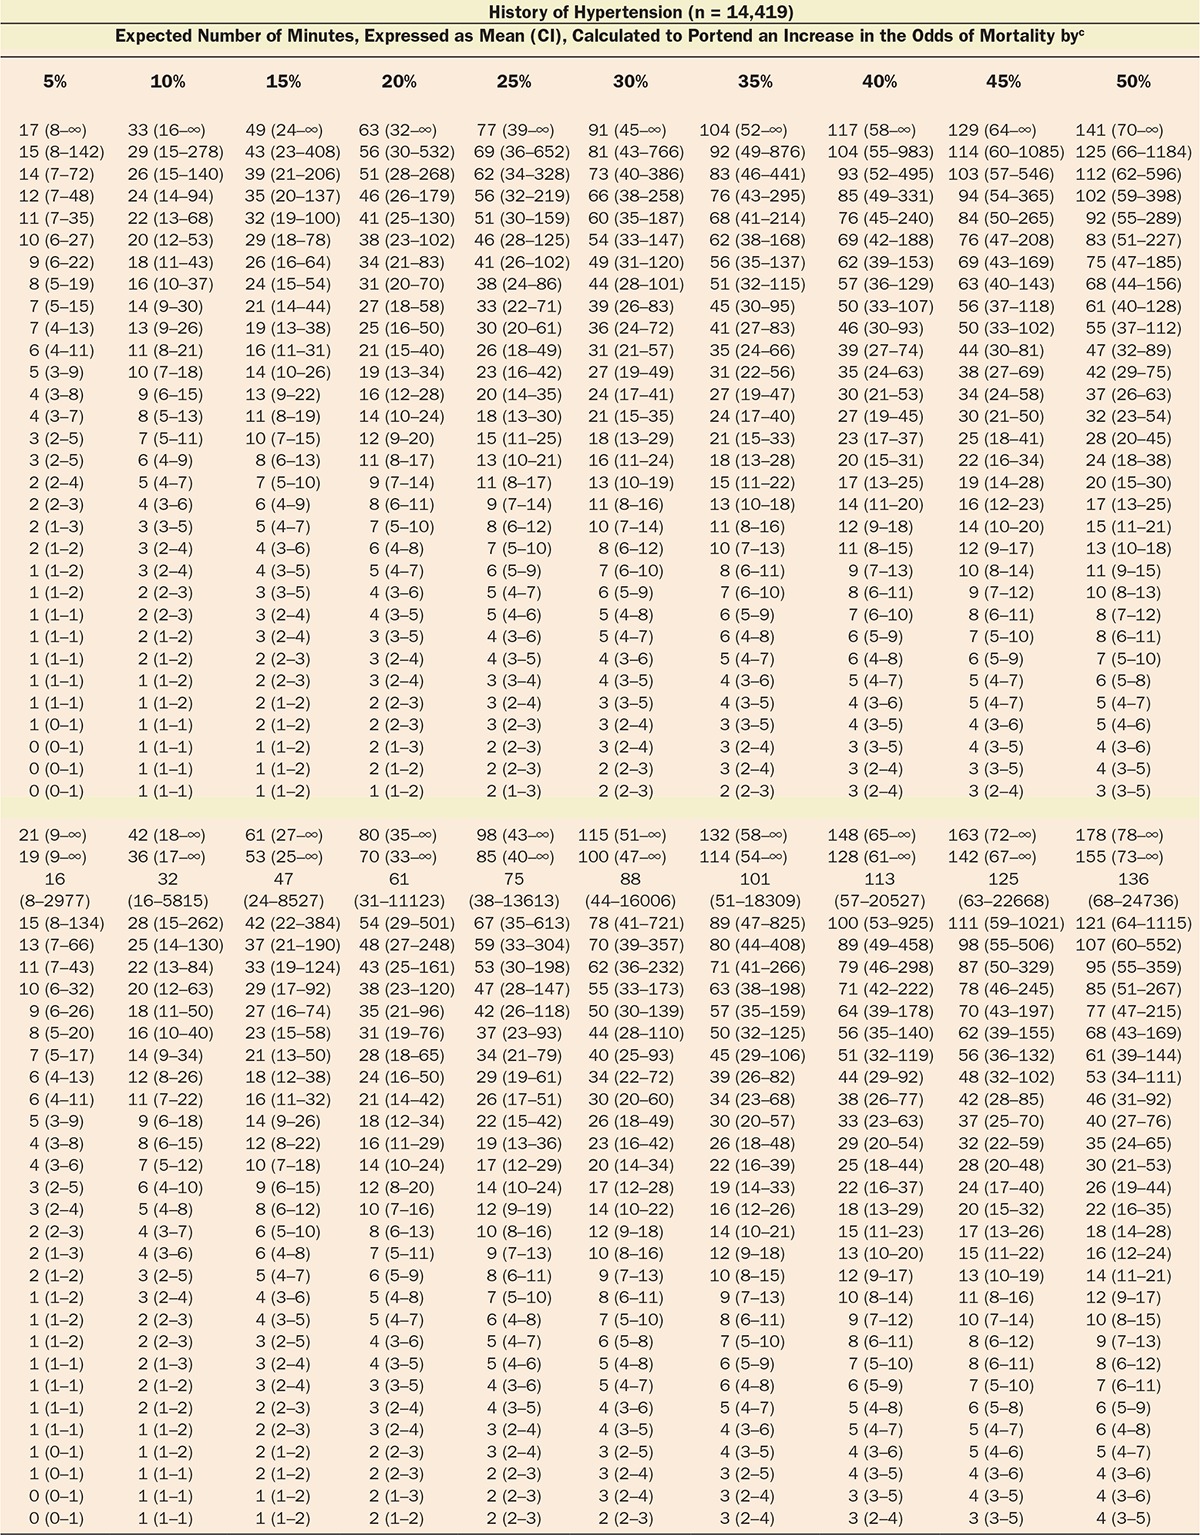
Figure 2.
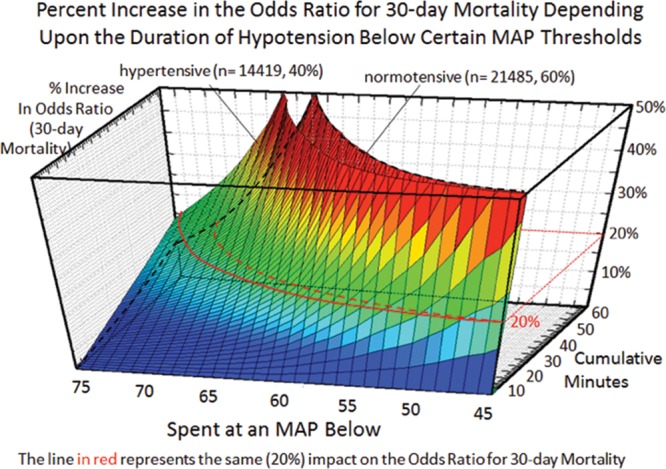
Relationship between severity (x-axis) and duration (y-axis) of cumulative hypotensive exposures with 30-day mortality (z-axis).4 Although even extended exposures below a mean arterial blood pressure (MAP) of 75 had relatively little impact, even just a few minutes accumulated below an MAP of 50 portended a sharp increase in 30-day mortality. Note that for each hypotensive MAP threshold, less time was required to be accumulated in patients with a history of hypertension than in normal patients to incur the same relative increase in the odds ratio for 30-day mortality, the red lines indicating a 20% increase in normal patients (dotted line) versus patients with a history of hypertension (solid line).
Table 4.
Testing of the Various Exposure Limits Sets in the Development Cohort, Using the Method Described in Table 3
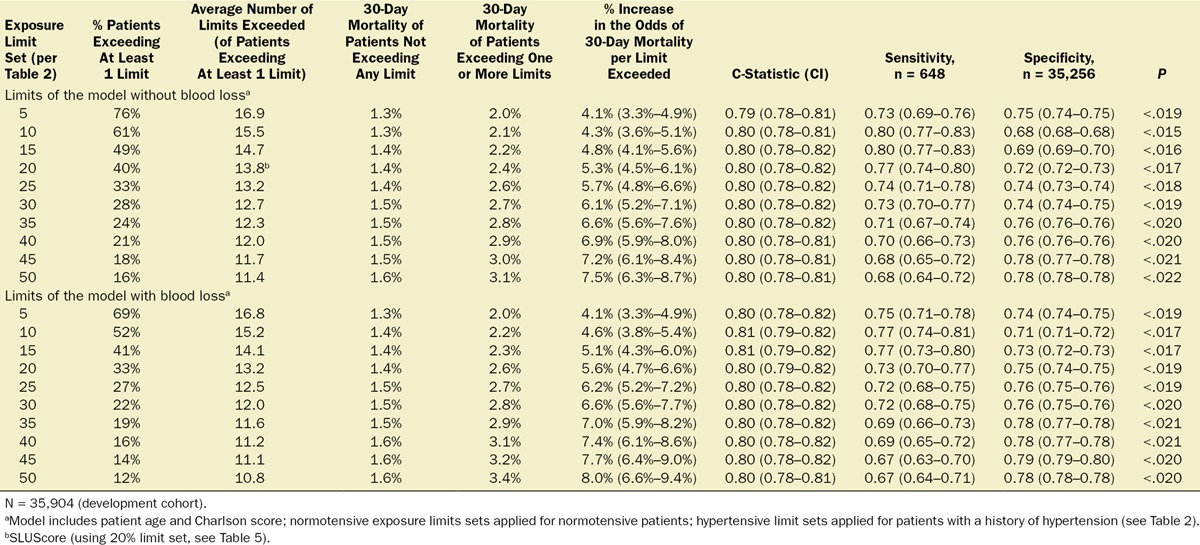
Table 5.
SLUScore Exposure Limits for Cumulative Time Spent Below Various MAP Thresholds Between 75 and 45 mm Hg
Validation of the SLUScore (Validation Cohort)
In an additional 116,541 patients studied at the 3 different US health systems, cumulative hypotensive exposure times were compared with the various “smart set exposure limits” including the SLUScore limits (Table 5), choosing the limits according to whether or not patients carried a history of hypertension and calculating the total number of exposure limits that had been exceeded as described in Table 3. Within each set of “smart exposure limits,” patients exceeding one or more of these limits exhibited greater mortality than patients not exceeding any of these limits. The increase in mortality depended on the number of exposure limits exceeded, with each incremental limit exceeded portending a compounding further increase in the odds of mortality (Table 6). With overall 30-day mortality being in the same range (between 1.4% and 1.8%), there was a similar experience with regard to incidence and impact of the SLUScore in patients from each of the 3 health systems: the SLUScore was >0 in about one-third of patients, and 30-day mortality was approximately doubled in patients with a SLUScore > 0 compared with that of patients with a SLUScore of 0, associated with an average SLUScore of 14.1 and an approximate 5% compounding increase in adjusted odds per SLUScore increment (Table 7; Figure 3).
Table 6.
Testing of the Various Exposure Limits Sets in the Validation Cohort, Using the Method Described in Table 3

Table 7.
Mortality in Association With SLUScores

Figure 3.
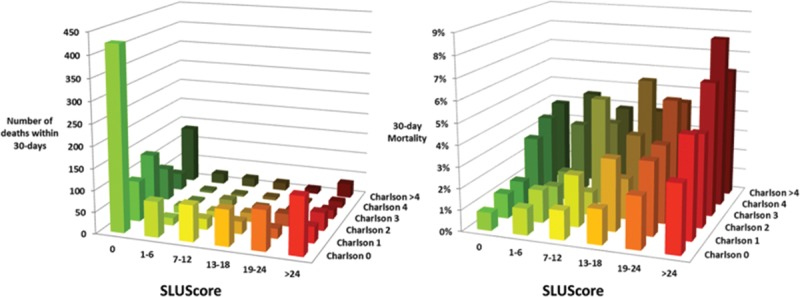
Number of deaths and 30-day all-cause mortality of a total of 116,541 patients from the 3 different organizations with regard to their Charlson comorbidity score and SLUScore. Both scoring systems independently portended decreased 30-day survival in association with progressively greater scores. With nearly 90% of patients having a Charlson score ≤2, overall more patients’ decreased survival occurred in association with a progressively greater SLUScore than a progressively greater Charlson score.15
When studied in these same 116,541 patients, the association of a progressive SLUScore with 30-day mortality was independent of that of the Charlson comorbidity score (Table 6; Figure 3). Given the fact that lower Charlson comorbidity scores were more prevalent than higher ones, overall more patients’ adverse outcomes were associated with their higher SLUScore than their comorbidity as reflected in the Charlson comorbidity score (Table 6; Figure 3).15
Because the SLUScore exposure limits had not been adjusted for the types of surgical procedure or their actuarial risk—for the reasons mentioned above—we attempted to examine the potential post hoc association of patients’ SLUScores with observed total risk for 5 distinct types of procedures identified in the Saint Louis University patient cohort subset (Figure 4). As shown in the figure, procedures carrying a progressively greater observed total risk were associated with a progressively greater fraction of patients with a SLUScore > 0, a greater average SLUScore > 0, as well as a greater average overall SLUScore (Figure 4), thus reinforcing the concern about confounding. However, the uniformly small numbers of deaths precluded a determination as to what extent greater mortality risk may have been attributable to a (as yet unknown) procedural versus some other risk portion that was ostensibly at least associated with (if not potentially caused or mediated by) hypotensive exposures. Regardless of this eventual distinction, which remains to be sorted out in future studies, ideally ones that either adjust for procedure or are designed to specifically apply only to certain types of procedures, the SLUScore as currently conceived managed to do what it had been designed for, namely to identify that fraction of patients whose greater risk was portended by greater hypotensive exposures (a SLUScore > 0). This latter, most salient observation would of course remain no less true if the SLUScore limits had not been determined by any logistic regression analyses but rather arbitrarily set and merely applied as nominal limits for maximum permissible hypotensive exposure times.
Figure 4.
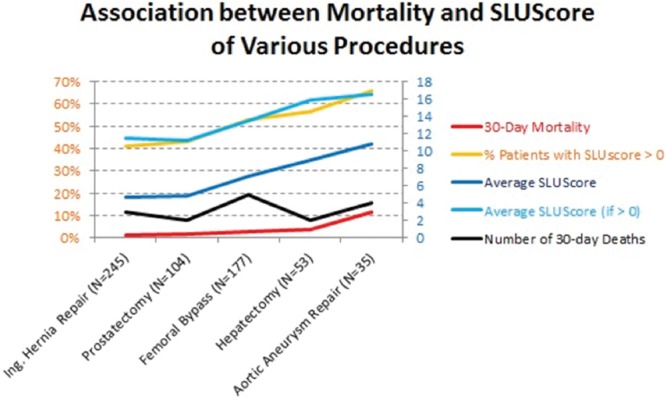
Association between the observed mortality (red, left abscissa) of 5 distinct, sufficiently homogeneous surgical procedures identified in the limited Saint Louis University patient cohort subset (ranging from inguinal hernia repairs to abdominal aortic aneurysm repairs, performed in the indicated number of patients) with these patients’ final SLUScores in terms of incidence of SLUScore > 0 (orange, left abscissa), average SLUScore > 0 (light blue, right abscissa), overall average SLUScore (blue, right abscissa), and observed number of deaths (black, right abscissa). Please note that progressively “higher risk” procedures (those with a higher observed mortality) were also associated with progressively higher SLUScores, meaning that these procedures were associated with greater hypotensive exposures as quantified by their SLUScore. This finding reinforces the idea that the SLUScore cannot be interpreted as any direct measure of the risk associated with hypotensive exposures alone because the type of surgical procedure during which they occur remains a confounding factor that could not be adjusted for because of the low absolute number of deaths incurred with each type of procedure. Still, the SLUScore accomplishes what it was meant and designed to do, namely to help allow those substantial fractions of patients to be identified who are at some greater risk, portended by their greater hypotensive exposures, because of whatever (essentially unknown) procedural risk in conjunction with worse hypotension, independent of other less modifiable factors such as patient age and comorbidity. Both procedural risk (through more refined and potentially less-invasive surgical procedures) and ostensibly some portion of overall risk apparently associated with—if not potentially caused by—accompanying hypotensive exposures (through efforts aimed at minimizing any prolonged periods of hypotension) may be principally amenable to potential future reduction resulting in lower SLUScores and improved outcomes.
DISCUSSION
Although considered important, the role of intraoperative blood pressure with regard to long-term outcome after surgery remains poorly understood. The present findings demonstrate a significant independent association between the cumulative times accrued below a wide range of MAP thresholds commonly experienced during noncardiac anesthesia (and not generally considered to be of concern by most anesthesia providers) and increased all-cause mortality within 30 days after surgery. Consequently, an approximate doubling of mortality was observed in 1 of every 3 of over 150,000 patients at each of the 3 different health care institutions. With approximately 200 million surgical procedures being performed annually worldwide, universally rather high mortality has raised questions regarding underlying causes.16 Unlike previous attempts at identifying risk conceivably associated with intraoperative hypotension, this novel approach considers any blood pressure a patient may have experienced for the amount of time it was observed over the course of an entire case. Accordingly, in agreement with the existing literature, there does not seem to be one particular pressure threshold having to be dropped below to portend greater risk for 30-day mortality versus being spared from such an effect. Rather, increased risk appears to be related to an interaction between severity and duration of hypotension below a wide range of commonly encountered MAP thresholds over periods of time that are well within the currently accepted standard of care. This important, reciprocal relationship between severity and duration of hypotension is captured by the SLUScore, a novel risk index based on time accumulated at hypotensive MAPs (below 75–45 mm Hg) exceeding certain exposure limits, with each incremental limit exceeded (SLUScore increment) determined to portend a further compounding approximate 5% progression in the odds of mortality. In this sense, “smart set exposure limits” appear to be somewhat analogous to diving charts, suggesting that less time may be permissible to be spent at a lower MAP (a greater depth) while incurring a similar amount of risk (Table 5). The idea of accrual of time spent below a certain threshold (80 mm Hg systolic) exhibiting an association with progressively worse longer-term outcome was introduced by the pioneering work of Monk et al.1 The present data suggest that such progressive risk does not appear to be sufficiently quantified by examining time accrued below just one MAP threshold but rather below a wide range of commonly encountered MAP thresholds. Varying limits of cumulative exposure time need to be exceeded below these MAP thresholds to incur the same percentage increases in risk, each of these time limits being different for patients with or without a preoperative diagnosis of hypertension (Figure 2; Tables 2 and 5). A reason this type of approach might not have been contemplated in the past is that its inherent complexity would have made it impractical to be applied manually in the operating room or to be implemented by device manufacturers of free-standing blood pressure monitors. However, with the increasing availability of AIMS and the arrival of DSS functionality offering nearly instantaneous access to all required information, it has become conceivable to be able to detect and provide notification to more complex information such as the SLUScore in near real time. It is not clear whether patient outcome might be improved by knowing and acting on this information in the operating room, such as through elevating the patient’s blood pressure, opting for an intervention that would ideally correct the underlying pathophysiologic abnormality. At present, it is not conclusively clear what any such underlying pathophysiologic abnormality might be. However, two independent observations and considerations point at the likelihood that hypotensive exposures might be associated with hypoperfusion, most likely of splanchnic vascular beds. First, when examining the observed SLUScore limits in relation to the MAP deviation from 75 mm Hg, it appears that every 5.2 mm Hg decrease in MAP caused the SLUScore limits to be reduced by 50%, suggesting that any (hypothetical) blood flow deficit would have to have approximately doubled to produce an ischemic insult of equivalent severity (implied flow deficit × SLUScore time limit), portending identical risk. This apparent decrease in blood flow not being linear with decreasing MAP would suggest a progressive increase in vascular resistance, leading to an estimated 85% reduction in blood flow to occur between an MAP of 75 and 60 mm Hg (Figure 5). Because it is well understood that systemic hypotension is being responded to physiologically with sympathetic vasoconstriction and renin-angiotensin activation, both of which would tend to spare the heart and brain at the expense of other vascular, most notably splanchnic beds, it is conceivable that hypotensive vasoconstriction might have led to splanchnic hypoperfusion.17 This notion is supported by a second observation: when examined in 2618 general surgical patient records captured in Saint Louis University’s American College of Surgeons National Surgical Quality Improvement Program (NSQIP) outcomes database for which the SLUScore happened to have been determined as part of the above analysis, a progressively greater SLUScore was found to be associated with progressively greater postoperative morbidity in terms of worse renal function, deep (but not superficial or incisional) wound infection, and septic shock (Figure 6, unpublished data). Together, these findings support the possibility of ischemic injury and suggest that, in most circumstances, benefit of any potential intervention might likely depend on the ability to improve blood flow rather than subjecting it to even greater reduction through the indiscriminate administration of vasopressors. It, of course, remains unknown whether (any type of) intervention in response to a rising SLUScore in the operating room might lead to improved outcome. This intriguing question is being addressed in an upcoming prospective clinical effectiveness trial,18,19 in which DSS functionality is being used not only to detect hypotensive exposures in real time, but also to randomize provider notification to these conditions. This is similar to how DSS is being leveraged in other studies that were either recently completed20 or are currently still underway,21 examining the impact of intraoperative anesthesia provider notification to systolic hypotension20 or to the “triple low” condition, a condition thought to represent the possibility of cerebral hypoperfusion portending adverse outcome.21 Incidentally, and pertinent to the present study, the “triple low” condition is defined as spending any 2 or more consecutive minutes below an MAP of 75 mm Hg in conjunction with a bispectral index value considered too low (45) to be solely reflective of central nervous system-depressant anesthetic action of an end-tidal inhaled anesthetic concentration equivalent to 0.8 minimum alveolar concentration.3 As in the present study, prolonged periods of time spent in the “triple low” state portended worse outcome, suggesting that outcome may be improved by limiting the amount of time a patient is permitted to accrue below an MAP of 75 mm Hg.3,11 A more recent finding disputing such an association of duration of “triple low” with outcome may point to one potential weakness of the “triple low” concept being that it considers all MAPs below 75 mm Hg equally, a suggestion in stark contrast with findings underlying the SLUScore limits (Tables 2 and 5).6,7
Figure 5.
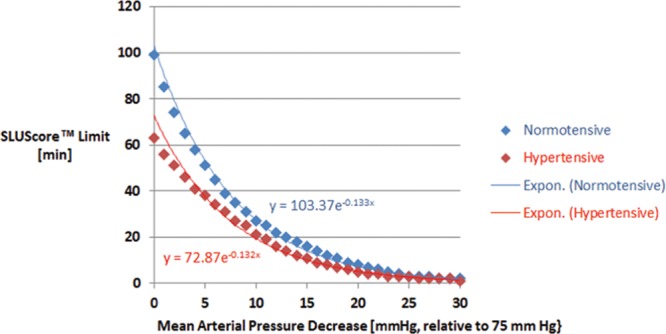
Association between the SLUScore time limits (see Table 5) and the magnitude of the decrease in mean arterial blood pressure (MAP) relative to 75 mm Hg. Approximately every 5.2 mm Hg decrease in MAP caused the associated SLUScore time limits to be reduced by 50%, suggesting progressively decreased blood flow. Because the association with MAP is not linear but exponential, it is suggestive of a progressive increase in vascular resistance with hypotension. Given the well-known relative sparing of cardiac and cerebral vascular beds, hypotensive vasoconstriction would have most likely produced splanchnic ischemic injury, leading to adverse outcome.17
Figure 6.
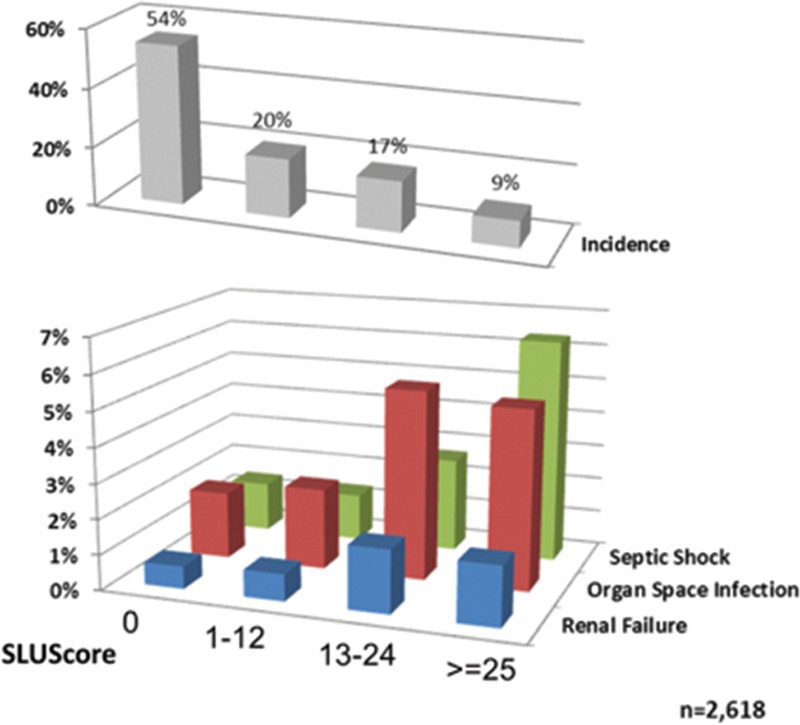
Association between patients’ SLUScore and the incidence of various postoperative complications as captured in Saint Louis University’s NSQIP database. A progressive SLUScore portended an increased risk of postoperative renal failure, (deep) organ space infection, and septic shock, suggesting possible splanchnic hypoperfusion as the pathophysiologic abnormality associated with hypotensive exposures.17
Although hypotension might theoretically be escaped altogether by keeping a patient’s MAP above 75 mm Hg at all times, this would be neither feasible in the reality of clinical practice nor likely desirable. In our findings, over 90% of patients’ MAP dropped below 75 mm Hg at some point during their anesthetic (Figure 1); however, only approximately one third of patients did so long enough to exceed at least one of the SLUScore limits (Tables 4, 6, and 7). The conceivable benefit of knowing a patient’s SLUScore in real time might be that this might allow permissive hypotension to be instituted whenever indicated (such as to minimize bleeding) while still keeping track of cumulative times spent in a hypotensive state and providing notification only to (approximate 5%) increments of risk resulting from more extended periods of hypotension. Patient benefit might be derived from not only avoiding more severe hypotension below an MAP of 60 mm Hg, but also minimizing extended periods at an MAP between 60 and 70 mm Hg, a pressure range traditionally considered only mildly hypotensive and not perceived as posing a hazard for the patient but as remaining well within the prevalent standard of care. Finally, regardless of whether or not provider knowledge of the SLUScore in real time may or may not demonstrate to help improve patient outcome,18–20 off-line calculation of the SLUScore after a case finishes may still allow those fractions of patients to be identified who appear to be at some significantly increased risk (because of unrecognized, deliberate, or insufficiently treated hypotensive exposures) and stratified for more selective follow-up care. This would apply especially to those generally healthier patients with elevated SLUScores who might not otherwise be deemed to be at much of an increased risk based on their lower comorbidity.
An important limitation of this study remains the fact that the SLUScore limits inherently incorporate, by virtue of having been generated by a less than completely adjusted model for all potential pertinent factors, including the types of procedures, some confounding portion of risk conceivably posed by the procedures themselves with which these hypotensive exposures were associated (Figure 4). Thus, it is conceivable that the true risk progression attributable to hypotensive exposures might amount to less than the proposed 5% relative increase in mortality odds per increment or to a potentially different value for different types of procedures. These possibilities will require more comprehensive model revisions, which should ideally account for the types of procedures and might also benefit from the results of the planned SLUScore trial,19 by isolating the potential impact of anesthetic interventions aimed solely at minimizing the progression of hypotensive exposures, regardless of the specific types of surgical procedures during which they occur.19 In due course, future SLUScore models might need to be revised to take into account the types of procedures, continually improving procedural techniques, as well as foreseeable anesthetic practice adjustments because even less than severe hypotension is being increasingly cited as a source of concern and potential opportunity for contributing to improved patient outcomes.
DISCLOSURES
Name: Wolf H. Stapelfeldt, MD.
Contribution: This author formulated the underlying hypothesis, obtained the development cohort data, and completed the statistical model during his tenure at the Cleveland Clinic; performed the principal data analyses; and wrote the manuscript.
Conflicts of Interest: Wolf H. Stapelfeldt has received salary support in his previous role of Chief Medical Officer of Talis Clinical, LLC, a Cleveland-Clinic spinoff software company of which he is Founder, equity holder, and former member of the Board of Directors. As inventor and holder of several patents on clinical decision support-related technologies, he is also eligible for royalty payments by the Cleveland Clinic.
Name: Hui Yuan, MD.
Contribution: This author helped procure the St. Louis University data from the various database registries, participated in literature review, and edited the manuscript.
Conflicts of Interest: None.
Name: Jefferson K. Dryden, DO.
Contribution: This author participated in the review of the pertinent literature and edited the manuscript.
Conflicts of Interest: None.
Name: Kristen E. Strehl, DO.
Contribution: This author participated in the review of the pertinent literature and reviewed the manuscript.
Conflicts of Interest: None.
Name: Jacek B. Cywinski, MD.
Contribution: This author is the owner of the Cleveland Clinic database registry (PHDS).
Conflicts of Interest: None.
Name: Jesse M. Ehrenfeld, MD.
Contribution: This author is the owner of the Vanderbilt database registry.
Conflicts of Interest: None.
Name: Pamela Bromley, MBA.
Contribution: This author helped in SQL-Server programming and database management.
Conflicts of Interest: None.
This manuscript was handled by: Maxime Cannesson, MD, PhD.
ACKNOWLEDGMENTS
The authors acknowledge the invaluable expert statistical advice and assistance offered by Jarrod E. Dalton, PhD, Section of Health Outcomes Research and Clinical Epidemiology, Department of Quantitative Health Sciences at the Cleveland Clinic, Cleveland, Ohio.
Footnotes
Published ahead of print January 19, 2017.
Funding: This work was funded by each institution’s anesthesia departments.
Conflicts of Interest: See Disclosures at the end of the article.
Reprints will not be available from the authors.
REFERENCES
- 1.Monk TG, Saini V, Weldon BC, et al. Anesthetic management and one-year mortality after noncardiac surgery. Anesth Analg. 2005;100:4–10. [DOI] [PubMed] [Google Scholar]
- 2.Bijker JB, van Klei WA, Vergouwe Y, et al. Intraoperative hypotension and 1-year mortality after noncardiac surgery. Anesthesiology. 2009;111:1217–1226. [DOI] [PubMed] [Google Scholar]
- 3.Sessler DI, Sigl JC, Kelley SD, et al. Hospital stay and mortality are increased in patients having a “triple low” of low blood pressure, low bispectral index, and low minimum alveolar concentration of volatile anesthesia. Anesthesiology. 2012;116:1195–1203. [DOI] [PubMed] [Google Scholar]
- 4.Stapelfeldt WH, Dalton J, Bromley P, et al. Risk-based decision support thresholds for hypotension in adult patients undergoing non-cardiac surgery. Am Soc Anesthesiol. 2012, A074 (oral presentation). [Google Scholar]
- 5.Walsh M, Devereaux PJ, Garg AX, et al. Relationship between intraoperative mean arterial pressure and clinical outcomes after noncardiac surgery: toward an empirical definition of hypotension. Anesthesiology. 2013;119:507–515. [DOI] [PubMed] [Google Scholar]
- 6.Kertai MD, White WD, Gan TJ.Cumulative duration of “triple low” state of low blood pressure, low bispectral index, and low minimum alveolar concentration of volatile anesthesia is not associated with increased mortality. Anesthesiology. 2014;121:18–28. [DOI] [PubMed] [Google Scholar]
- 7.Stapelfeldt WH.Duration of hypotension (still) matters. Anesthesiology. 2015;122:470. [DOI] [PubMed] [Google Scholar]
- 8.Mascha EJ, Yang D, Weiss S, et al. Intraoperative mean arterial pressure variability and 30-day mortality in patients having noncardiac surgery. Anesthesiology. 2015;123:79–91. [DOI] [PubMed] [Google Scholar]
- 9.Monk TG, Bronsert MR, Henderson WG, et al. Association between intraoperative hypotension and hypertension and 30-day postoperative mortality in noncardiac surgery. Anesthesiology. 2015;123:307–319. [DOI] [PubMed] [Google Scholar]
- 10.Sun LY, Wijeysundera DN, Tait GA, et al. Association of intraoperative hypotension with acute kidney injury after elective noncardiac surgery. Anesthesiology. 2015;123:515–523. [DOI] [PubMed] [Google Scholar]
- 11.Willingham MD, Karren E, Shanks AM, et al. Concurrence of intraoperative hypotension, low minimum alveolar concentration, and low bispectral index is associated with postoperative death. Anesthesiology. 2015;123:775–785. [DOI] [PMC free article] [PubMed] [Google Scholar]
- 12.van Waes JA, van Klei WA, Wijeysundera DN, et al. Association between intraoperative hypotension and myocardial injury after vascular surgery. Anesthesiology. 2016;124:35–44. [DOI] [PubMed] [Google Scholar]
- 13.Deyo RA, Cherkin DC, Ciol MA.Adapting a clinical comorbidity index for use with ICD-9-CM administrative databases. J Clin Epidemiol. 1992;45:613–619. [DOI] [PubMed] [Google Scholar]
- 14.Stapelfeldt WH, Reynolds M, Ghosh B. The Monitoring of Severity and Duration of Aberrant Physiologic Parameters during a Procedure. USPTO. US20140107504 A1. Application US14/051,902, October 11, 2013.
- 15.Stapelfeldt WH, Vuong P, Yuan H, et al. The SLUScore™: a novel method to quantify the adverse impact of intraoperative hypotension on patient outcome following non-cardiac surgery. American Soc Anesth. 2014, A1008 (oral presentation). [Google Scholar]
- 16.Pearse RM, Moreno RP, Bauer P, et al. European Surgical Outcomes Study (EuSOS) group for the Trials groups of the European Society of Intensive Care Medicine and the European Society of Anaesthesiology. Mortality after surgery in Europe: a 7 day cohort study. Lancet. 2012;380:1059–1065. [DOI] [PMC free article] [PubMed] [Google Scholar]
- 17.Reilly PM, Wilkins KB, Fuh KC, et al. The mesenteric hemodynamic response to circulatory shock: an overview. Shock. 2001;15:329–343. [DOI] [PubMed] [Google Scholar]
- 18.Stapelfeldt WH, Strehl KE, Yuan H, et al. Rate of Intraoperative Progression of SLUScore™-Portended Risk for Adverse Outcome Following Adult Non-Cardiac Surgical Procedures. Am Soc Anesthesiol. 2015, A5011 (oral presentation). [Google Scholar]
- 19.Stapelfeldt WH, Yuan H, Dryden K, et al. Prospective, randomised trial of alerting to extended hypotensive exposures on long-term outcome following adult non-cardiac surgical procedures: The SLUScore™ trial. Available at: http://www.thelancet.com/protocol-reviews/14PRT-4102. Accessed on February 8, 2016.
- 20.Panjasawatwong K, Sessler DI, Stapelfeldt WH, et al. A randomized trial of a supplemental alarm for critically low systolic blood pressure. Anesth Analg. 2015;121:1500–1507. [DOI] [PubMed] [Google Scholar]
- 21.Sessler DI, Stapelfeldt WH. A randomized effectiveness trial of early hemodynamic support in patients demonstrating a “Triple Low” of mean-arterial pressure, end-tidal anesthetic concentration, and bi-spectral index.. Available at: http://clinicaltrials.gov/ct2/show/NCT00998894. Accessed on February 8, 2016.


