Abstract
The Golgi apparatus plays a central role in processing and sorting proteins and lipids in eukaryotic cells. Golgi compartments constantly exchange material with each other and with other cellular components, allowing them to maintain and reform distinct identities despite dramatic changes in structure and size during cell division, development, and osmotic stress. We have developed three minimal models of membrane and protein exchange in the Golgi—a discrete, stochastic model, a continuous ordinary differential equation model, and a continuous stochastic differential equation model—each based on two fundamental mechanisms: vesicle-coat-mediated selective concentration of cargoes and soluble N-ethylmaleimide-sensitive factor attachment protein receptor SNARE proteins during vesicle formation and SNARE-mediated selective fusion of vesicles. By exploring where the models differ, we hope to discover whether the discrete, stochastic nature of vesicle-mediated transport is likely to have appreciable functional consequences for the Golgi. All three models show similar ability to restore and maintain distinct identities over broad parameter ranges. They diverge, however, in conditions corresponding to collapse and reassembly of the Golgi. The results suggest that a continuum model provides a good description of Golgi maintenance but that considering the discrete nature of vesicle-based traffic is important to understanding assembly and disassembly of the Golgi. Experimental analysis validates a prediction of the models that altering guanine nucleotide exchange factor expression levels will modulate Golgi size.
I. INTRODUCTION
Membrane trafficking is critical to cellular physiology and pathophysiology. Over one quarter of all proteins in eukaryotic cells interact with compartments in the early secretory pathway that mediate protein folding, quality control, glycosylation, proteolytic activation, and localization [1–4]. The Golgi apparatus plays a central role in these processes through its involvement in sorting and transporting proteins and lipids. The cytoplasmic surface of the Golgi apparatus is also a site for numerous important signaling pathways [5]. Golgi compartments engage in a constant flux of material between each other, the endoplasmic reticulum ER, and other cellular components through exchange of small trafficking vesicles. This exchange of material allows Golgi compartments to establish, maintain, and reform distinct identities characterized by the presence of distinctive sets of protein markers despite dramatic changes in structure and size during cell division, development, and osmotic stress [6–9]. Furthermore, the Golgi is capable of self-assembling de novo from the ER [10]. It is, nonetheless, not well understood precisely how the Golgi performs these activities or which components of the Golgi are minimally necessary to allow for compartment assembly and maintenance.
While it is not definitively known precisely which biochemical activities are needed for Golgi function, there are some fundamental activities that appear to be necessary for maintaining a flux of material between compartments. Transport of protein and membrane between compartments is mediated by vesicular transport (see Fig. 1), which involves two essential steps: budding and fusion. In vesicle budding, a vesicle emerges from a donor compartment carrying some portion of protein from the compartment. The budding process is initiated by guanine nucleotide exchange factor(GEF)-catalyzed loading of specific guanosine triposphate hydrolases (GTPases) that catalyze recruitment of a protein coat, which assembles on the membrane and leads to the pinching off of a vesicle followed shortly afterward by disassembly of the coat [11]. The coat is also involved in selective concentration of specific cargoes in the budding vesicle. After budding, the vesicle travels to a target compartment, at which it undergoes fusion. Vesicle fusion with the target compartment is mediated by the interaction of vesicle (v-) and target (t-) soluble N-ethylmaleimide-sensitive factor attachment protein receptors (SNAREs) [12]. v- and t-SNARES occur in multiple homologous variants, with specific cognate pairs exhibiting high affinity for one another and allowing for specific recognition and driving membrane fusion between vesicle and compartment. Upon fusion, membrane and protein of the vesicle are absorbed into the target compartment. While these two mechanisms—budding and targeted fusion—are well established and essential for Golgi function, there are many other mechanisms that may contribute appreciably to the proper formation and maintenance of the Golgi. For example, tethering proteins often link vesicles to their budding compartments, possibly restricting the selection of possible targets [13–18]. For instance, tether protein p115-golgin may tether coat protein complex I (COPI) vesicles to the cis Golgi network [19–21]. In addition, cytoskeleton-mediated active transport of vesicles [22–24] or vesicular tubular clusters (VTCs) [25] occurs at key stages of Golgi assembly. Recent studies have also demonstrated the importance of lipids in protein trafficking through the Golgi complex [26,27]. It is not clear, however, if these additional mechanisms are obligatory for robust Golgi function.
FIG. 1.
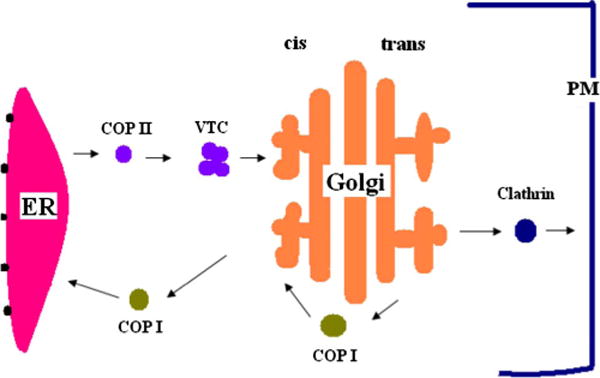
(Color online) Vesicular transport pathway. Transport between compartments is mediated by vesicular carriers. Three types of vesicles mediate intracellular transport. Coat protein complex II (COPII) vesicles mediate transport from the ER. Coat protein complex I (COPI) vesicles act in intra-Golgi transport and retrograde transport from the Golgi to the ER. Clathrin vesicles mediate transport between the Golgi and the plasma membrane.
Questions about the minimal mechanisms needed for Golgi function do not lend themselves well to direct experimental validation and mathematical models have therefore proven crucial in their study. Several mathematical models have been developed to simulate the generation and maintenance of the Golgi. For example, Glick et al. [28] developed a model of sorting in the Golgi based on the postulate that proteins comprise different kin populations that compete with each other for entry into transport vesicles. Their studies showed that different relative affinities of kin groups for potential vesicle types could generate distinct steady-state distributions of the different kin populations across the Golgi compartments. Weiss and Nilsson [29] extended this competition model by introducing specific recycling reactions to increase model robustness. They also included compartment-specific sorting affinities and exchange with the ER; their model suggested that a minimal set of selective sorting and targeting reactions could provide robust Golgi operation. Their model further suggested limits on the affinity parameter space permitted by the model. Heinrich and Rapoport [30] developed a differential equation model to simulate vesicle-mediated protein transport as a continuous flux of membrane and proteins between compartments. Their model verified that SNARE-mediated vesicle targeting was sufficient to establish and maintain distinct compartment identities in a simplified continuum model. In previous work [31], we developed a discrete, stochastic DS model implementing similar sorting and fusion reactions. In this model, Golgi evolution proceeds through a series of discrete steps in which a single vesicle of finite size is formed or fuses with a compartment. The use of a discrete model made it possible to explore de novo assembly of compartments, establishing that the same basic mechanisms explored by Heinrich and Rapoport [30]—vesicle-coat-mediated selective concentration of SNARE proteins during vesicle formation and SNARE-mediated selective fusion of vesicles—were sufficient not only to robustly maintain compartment identities but even to establish them from a fully disassembled Golgi. These models collectively show that a very limited set of biochemical functions is sufficient in theory to establish a minimal Golgi model.
In the present work, we describe continued investigation into the precise features necessary to minimal Golgi function. We are specifically interested here in the importance of discretization and stochasticity in Golgi function. Vesicle-based membrane transport is an inherently discrete, stochastic mechanism, but it is not obvious whether the overall behavior of the system would be appreciably different if materials were exchanged in the Golgi via a smooth, continuous flow between compartments. By examining precisely where discretization and stochasticity at the level of vesicle budding and fusion leads to observable differences at the level of compartment assembly, disassembly, and maintenance, we hope to determine what kind of mathematical models we need to describe various Golgi behavior and what analysis tools we can apply to those models. For this purpose, we investigate three analogous models: our original DS model [31], a continuous, deterministic extension of the model implemented as a system of ordinary differential equations (ODEs) similar to that of Heinrich and Rapoport [30], and a continuous, stochastic differential equation (SDE) model. All three simulate the same set of fundamental budding and fusion reactions at different levels of abstraction. The remainder of this paper presents our reaction model and its implementation in the three simulators. It then describes a series of simulation experiments designed to detect differences between the models in their operations during Golgi assembly, disassembly, and maintenance. Finally, it presents an experimental validation designed to test a model prediction that relative compartment sizes are modulated by changes in GEF concentrations.
II. METHODS
A. Mathematical model of budding and fusion
Our simulations each implement a common quantitative model describing how budding and fusion rates are controlled by protein concentrations in a set of membrane compartments and vesicles. As in our prior work [31], we implemented the model with three compartments, representing the ER, cis Golgi, and trans Golgi. For convenience, we will use the labels A, B, and C to stand for the ER, cis Golgi, and trans Golgi compartments, respectively. We define the variables SA(t), SB(t), and SC(t) to be compartments A, B, and C’s surface areas as functions of time, which we use as an approximate measure of the total mass of membrane they contain. We can define compartment radii RA(t), RB(t), and RC(t) in terms of the surface areas by modeling compartments as spheres. Newly budded vesicles are assigned a fixed radius, R0=60 nm with corresponding surface area . Our model contains three types of proteins, GEFs (abbreviated G), t-SNAREs (T), and v-SNAREs (V), each of which comes in three possible identities. For any protein type P with identity i, we define its concentration in compartment α (A, B, or C) to be Pα[i], where P is one of (G,T,V). We similarly define Pvα[i] (Gvα[i], Tvα[i], or Vvα[i]) to be the concentration of protein P in a vesicle v newly budded from compartment α. Protein concentrations are expressed in units of molecules/nm2 in our study.
We assume that GEF proteins initiate vesicle budding and that each identity of GEF, GEF[i], produces vesicles with a specific active v-SNARE, v-SNARE [j]. There are therefore three types of budding events possible from any compartment, one per marker identity. The budding rate is assumed to be dependent on the GEF and v-SNARE complements in the compartment. We model this assumption by defining the rate at which vesicles of type-k bud from the compartment α initiated by GEF Gα[i] to be
| (1) |
where k=i mod 3+1, that is, vesicle type k is a function of the GEF identity i, and c is a budding normalization constant with unit [c] =nm2/min, giving B units of vesicles/min. This value will define a rate of flux for the continuum simulations and a mean time between budding events for the discrete simulation. The full system of budding equations is provided for reference in Appendix, Sec. 1.
In order to implement the simulations, it is necessary to convert the overall vesicle budding rate into changes in membrane and protein content of compartments. We assume that both total protein content and total membrane content, measured by surface area, are conserved upon budding and fusion. During vesicle budding, the surface area of the compartment is set such that the total surface area of the vesicle Svα and post-budding compartment are equal to the surface area of the prebudding compartment Sα, that is, . Protein is distributed between the budding compartment and the budded vesicle based on a user-defined coat-cargo affinity keq that describes the equilibrium ratio of protein concentration in vesicle versus the donor compartment. The affinity is set to 1 (denoted by k0) for proteins that are native to the compartment. The affinity is greater than 1 (denoted by kn), favoring export, for proteins native to other compartments. Suppose we let Pα, , and Pvα be the protein concentration in the prebudding compartment α, post-budding compartment α′, and budded vesicle v from compartment α, respectively. Then, we have , i.e., that the final protein concentrations of compartment and vesicle are set proportional to the affinity without changing the total protein amount in the system [31].
Fusion rate in the model is assumed to be controlled by affinities between complementary v-SNARE–t-SNARE pairs. Each vesicle has a single marker v-SNARE determined by its budding GEF. Its fusion rate with any given compartment is determined by the amount of the complementary t-SNARE in the target compartment or vesicle. We assume as in Gong et al.[31] that the fusion reaction is cooperative. Thus, the rate with which vesicle v-SNARE Vvα[i] fuses with a compartment β with complementary t-SNARE concentration Tβ[i] is
| (2) |
where d is a vesicle fusion normalization constant and we fixed d=1 nm8/min in our simulator. n is the order of dependence on SNARE concentrations, a measure of cooperativity of the reaction. We assume n=2, a difference from the first-order fusion rate in [30]. The cooperativity of fusion is experimentally supported by results from Stewart et al.[32]. Other studies 33 have also observed higher-order complexes formed from individual SNARE proteins carrying the transmembrane domain, consistent with a cooperative binding mechanism. Hua and Scheller [34] provided an estimate of the degree of cooperativity of fusion by examining fusion rate dependence on concentration of a SNARE inhibitor; their data were inconsistent with a first-order dependence, with third-order providing a best fit but second order also plausible. The fusion probability pαβi is proportional to the fusion rate Fαβi, normalized by the sum of rates to all possible targets. In the discrete model, we also allow for an intermediate compartment type, a VTC, that is presumed to have some concentration of all three v-SNARES that act additively in interacting with their cognate t-SNARES in a given target. In Appendix, Sec. 2, we provide the full resulting set of vesicle fusion rates and fusion probabilities for all three vesicle types from all three compartments.
B. DS simulation
Our DS simulations use a discrete event simulation model based on the methods proposed in our previous paper [31]. The model simulates Golgi function as a sequence of discrete steps, each corresponding to either a vesicle budding event or a vesicle fusion event. Each event is presumed to occur instantaneously but with exponentially distributed waiting times between events, sampled as in the stochastic simulation algorithm (SSA) first-reaction method of Gillespie [35]. Waiting times between events are given by the inverses of the rates of all possible events as specified in Sec. II A. Figure 2 describes the high-level simulation algorithm used by the simulator to repeatedly update the state through successive events.
FIG. 2.
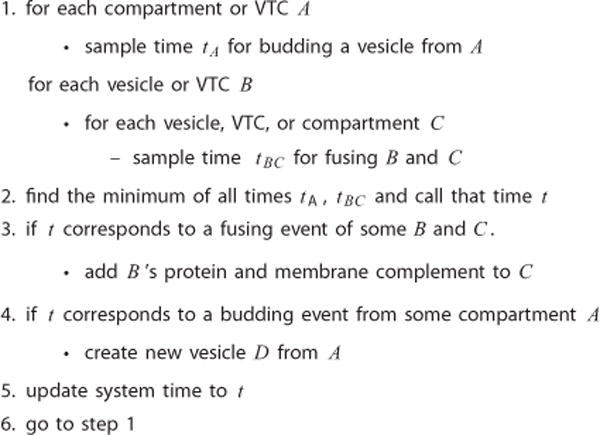
High-level pseudocode for the discrete event simulation.
C. ODE simulation
Our ODE simulations implement the model of Sec. II A assuming that changes in concentrations occur through a continuous, deterministic flux of material between compartments. There are therefore no explicitly modeled vesicles. Rather, the state of the simulation is described entirely by sizes and protein concentrations of the three compartments, with vesicle budding and fusion rates together converted into net rates of flux of membrane and protein between compartments.
To convert budding and fusion rates into fluxes of membrane and protein, we need to consider for each compartment three rates of exit of material from a compartment via vesicle budding (one per vesicle identity) and, for each vesicle identity, the three rates at which each vesicle type can fuse with three possible target compartments. We thus need to consider 27 total fluxes corresponding to 54 terms in three differential equations per protein or membrane. The existence of such fluxes is consistent with previous electron microscopy studies that cargo-laden vesicles bud from all cisternae [36,37].
One set of ODEs describes the time-dependent changes of the compartments sizes Sα, where α= {A,B,C},
| (3) |
An additional set of equations describes the time-dependent changes of the protein concentrations Pα in each compartment α and for each protein P,
| (4) |
We list the full set of ODEs for the three compartments sizes and all proteins’ concentrations in Appendix, Sec. 3. From Eqs. (3) and (4), it is easy to verify that
where i=1,2,3 and P= {G,T,V}. That is, the total amounts of surface membrane and each protein type i in the whole system are conserved during simulation.
The resulting system of ODEs is nonlinear and therefore not in general analytically solvable. We therefore solve these ODEs numerically. We use an embedded Runge-Kutta method using the MATLAB Runge-Kutta (4,5) command. We do note, however, that some properties of the system can be determined analytically. If we let , , where α= {A,B,C}, then Bα and Cα will be independent of Sα. Thus, Eq. 3 can be rewritten as
When the system goes to steady state, , then, the ODE equations can be simplified as
| (5) |
Solving these equations, we can derive steady-state compartment sizes Sα analytically.
D. SDE simulation
The discrete event and ODE models differ in two major assumptions: whether the system is treated as discrete or continuous and whether it is treated as stochastic or deterministic. In order to separate the contributions of these two factors to the global behavior, we added a third simulation of the mathematical model using SDEs. The SDEs that model the system can be written as a form of the chemical Langevin equation [38]. To derive SDEs for the system, we begin with the ODE model but extend each equation by a Brownian noise term reflecting the variability in vesicle budding and fusion events
| (6) |
| (7) |
where dα and gα are diffusion coefficients and Wα(t) are independent Wiener processes. We would expect noise in the flux to or from a compartment to vary with the compartment radius. We therefore assume diffusion coefficients for the noise terms of the form , , where the diffusion constants κs are tuned empirically from the discrete event simulation results by selecting scaling constants κs below so as to match empirically measured variances between the SDE and discrete event model. In order to satisfy the conservation of membrane surface area and total amount of specific type of proteins, we let dAdWA(t)=−dBdWB(t)−dCdWC(t) and gAdWA(t) =−gBdWB(t)−gCdWC(t). We simulate the model using the Euler-Maruyama method, described by the following pseudocode:
Initialize Sα(0), Pα(0)[i], where α=A,B,C, i=1,2,3, P=G,T,V.
- For t=1 to T/Δt
E. Simulation experiments
In order to explore the properties of the three simulation methods, we conducted a series of simulation experiments, which fall into four groups. We first conducted a series of experiments to model Golgi self-assembly from vesicle-sized remnant compartments. We did not perform a full de novo simulation, starting from a single compartment, because the continuum models do not allow for generation of new compartments. These simulations were initialized with cis and trans Golgi compartments each set to vesicle size (60 nm radius) and the ER set to a radius of 1000 nm. All three compartments were given a tenfold excess of native over nonnative marker types. The full list of input parameters is provided in Table I. Simulations were run until the system reached an apparent steady state.
TABLE I.
Input parameters in our baseline simulation: radius, t-SNARE (Ti), GEF (Gi), v-SNARE (Vi) for ER, cis Golgi, and trans Golgi.
| Radius | T1 | T2 | T3 | G1 | G2 | G3 | V1 | V2 | V3 | |
|---|---|---|---|---|---|---|---|---|---|---|
| ER | 1000 | 1.0 | 0.1 | 0.1 | 0.6 | 0.4 | 1.0 | 1.0 | 1.0 | 1.0 |
| cis | 60 | 0.1 | 1.0 | 0.1 | 0.1 | 1.0 | 0.1 | 0.1 | 1.0 | 0.1 |
| trans | 60 | 0.1 | 0.1 | 1.0 | 0.1 | 0.1 | 1.0 | 0.1 | 0.1 | 1.0 |
A second group of simulations examined Golgi disassembly. In these simulations, we modeled the experimentally induced disassembly of the Golgi via a dominant-negative form of sar1 [39–43] by prohibiting vesicle budding from the ER in all three models. Note that this is a different model of Golgi disassembly than we used in our prior work [31], in which we blocked ER exit at the fusion stage, because of the difficulty of translating that model unambiguously into the continuum simulations. The initial values for the compartment sizes and protein concentrations were extracted from the steady-state values of the ODE simulations of Golgi assembly.
A third group of simulations were designed to assess parameter sensitivity of each class of simulation. We first ran simulations varying the sorting affinity for nonnative markers during vesicle budding. Simulations were attempted for affinities 1, 2, 5, and 10–100 in increments of 10. For each condition, we measured compartment sizes and marker concentrations at steady state. We used the latter to compute the contamination of the ER at steady state, defined as the fraction of ER t-SNAREs that were of non-ER identity. For each simulation, we calculated a time to reach steady state. For the ODE model, this calculation was performed by measuring the maximum radius Rmax of the cis and trans Golgi compartments and then identifying the first time at which both Golgi’s radii Rt satisfy the relationship |Rt−Rmax|/Rmax <0.01. For the DS and SDE simulations, we selected the last 1000 events of each simulation as representative of steady state and computed means [E (R1000)] and standard errors [std (R1000)] of compartment radii over those times. We then defined the assembly time to be the first time t such that |Rt−E (R1000)|< std (R1000) for both cis and trans Golgi.
We next examined sensitivity of the model to the budding rate constant c, a scaling factor that controls the overall rate of budding relative to fusion. We ran simulations using values of c from 10−6 to 10−5 in increments of 10−6 with all other parameters as in the baseline simulations using ten repetitions per value. For each simulation, we computed assembly times as for the preceding experiments on changing affinities.
We next examined effects of changing GEF concentrations by varying the initial concentration of GEF1 (the GEF most specifically expressed in the ER) initially in the ER from 0.1 to 1. We also examined how changing GEF concentrations affects Golgi disassembly time by varying the initial values of GEF2 (the GEF most specifically expressed in the cis Golgi) from 1 to 10 and running disassembly simulations as described in the preceding paragraph. For each, we used a slightly modified version of the disassembly time measure described above, in which we measured disassembly times separately for cis and trans Golgi compartments rather than assessing only the time by which both had disassembled.
F. Experimental validation
In order to validate the models, we examined a common prediction of the three methods: that Golgi size can be modulated by changes of a single Golgi marker GEF protein’s concentration in the ER. To test this prediction, the size of the Golgi apparatus was quantified in HeLa cells. HeLa cells were transfected using Transfectol (GeneChoice, Frederick, MD) with plasmids encoding hemagglutinin (HA)-tagged mSec12 (the ER-localized GEF that mediates the ER exit of Golgi proteins), which corresponds to the ER GEF, GEF1, in our simulation models. After 24 h, the cells were paraformaldehyde-fixed and processed as previously described [10] using mouse anti-HA, rabbit anti-GPP130 antibodies, and rhodamine phalloidin (Molecular Probes, Eugene, OR). Microscopy was performed using a spinning disk confocal scan head equipped with three-line laser and independent excitation and emission filter wheels (PerkinElmer, Waltham, MA) and a 12-bit digital camera (Orca ER, Hamamatsu City, Japan) mounted on a microscope (Axiovert 200, Carl Zeiss MicroImaging, Inc.) with a 100×, 1.4 numerical aperture (NA) apochromat oil-immersion objective (Carl Zeiss MicroImaging, Oberkochen, Germany) [6]. Sections at 0.3 μm spacing were acquired using IMAGINGSUITE software (PerkinElmer). Individual experiments were performed with identical laser output levels, exposure times, and scaling. For quantification of Golgi size in each cell, staining of GPP130, a cis Golgi-localized integral membrane protein was used to define pixels in each slice corresponding to the Golgi and their area was then summed for the entire stack using the ImageJ “Measure stack” function [6,31]. Cell volume was estimated by summing the area in each section outlined manually based on the phalloidin staining pattern. To allow direct comparison of distinct experiments, given small changes in staining intensity, values were normalized by dividing by the mean values of the entire data set for a given experiment. We additionally quantified average GPP130 staining per pixel in the defined Golgi region and fit a linear regression model to mSec12 expression to test whether cis Golgi markers become comparatively more diluted in the Golgi as mSec12 expression increases.
III. RESULTS
A. Golgi assembly simulation
We first examined the ability of the models to reach a steady state from an initial configuration in which the ER contains most components and membrane. For these experiments, the ER has initial radius 1000 nm and the cis and trans Golgi are two initially vesicle-sized compartments with radii of 60 nm.
Figure 3 shows changes in compartment sizes over time for the three simulation methods. All three simulations show qualitatively similar behavior, with membrane rapidly transferring from the ER to the two Golgi compartments until reaching a steady-state at approximately 200 min. Some differences are, however, apparent between the simulations. The DS [Fig. 3(a)] and SDE [Fig. 3(c)] simulations show size fluctuations over a range of about 5×10⁵ nm2 in compartment sizes after equilibration, a feature the ODE cannot capture. Furthermore, the DS model equilibrates to slightly different values than the two continuum models, with a somewhat lower ER size (7×10⁶ vs. 8×10⁶ nm2) and overall a slightly lesser total compartment area summed among the three compartments. This difference is due at least in part to the existence of VTC and free vesicles in the DS simulator, which contain a portion of the steady-state membrane content.
FIG. 3.
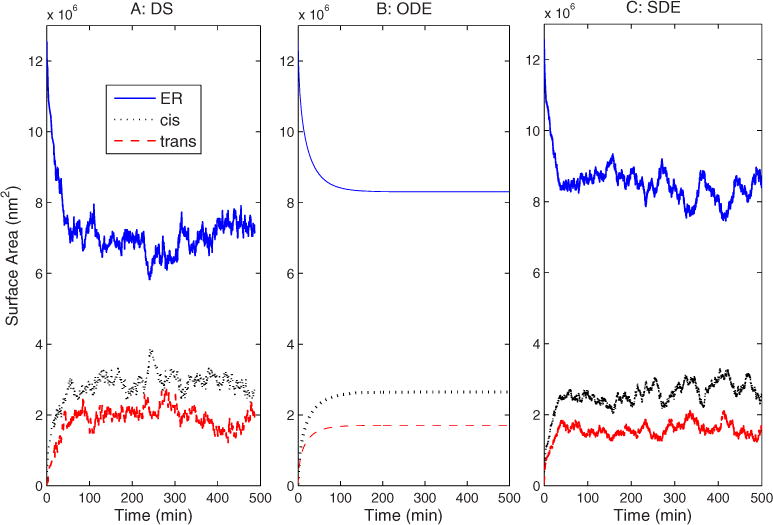
(Color online) Compartment surface area vs time for the baseline simulation with the (a) DS, (b) ODE, (c) and SDE simulations.
Figure 4 quantifies compartment identities by tracking GEF marker protein concentration changes for the three simulations. The three simulation methods again show qualitatively similar results. After expulsion of nonnative markers, compartments rapidly adjust to a stable partitioning of markers corresponding to clearly defined compartment identities. One noticeable difference among the simulations is that the DS simulation shows a transitory loss of cis Golgi compartment identity over approximately the first 10 min [Figs. 4(b) and 4(c)], in which the cis Golgi temporarily takes on a mixed cis-trans hybrid identity. No such transitory phase is evident in the ODE simulation while the SDE shows only a much briefer initial spike in trans markers in the cis Golgi. In addition, the two stochastic models show somewhat different noise distributions from one another, with the SDE model exhibiting much higher noise in each compartment’s marker GEF than in contaminating GEFs, while the DS shows comparable noise levels among all three. In the interest of conserving space, we omit an explicit display of the behaviors of the other markers (v-SNARE and t-SNARE) as functions of time, as both sort themselves similarly to GEF markers for all three simulations.
FIG. 4.
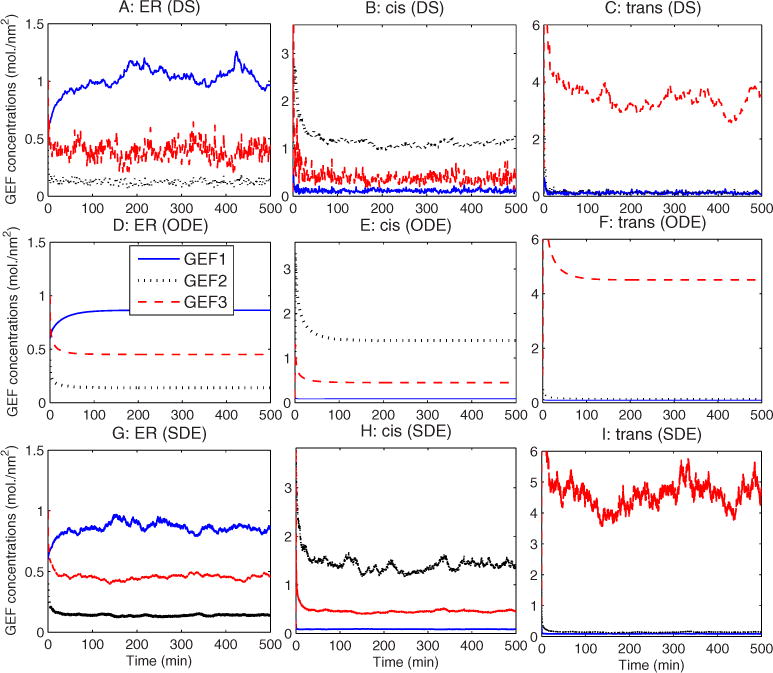
(Color online) GEF concentration vs time for the baseline simulation with the (a) – (c) DS simulator, (d) – (f) ODE simulator, and (g) – (i) SDE simulator. The first column (a, d, g) shows concentrations in the ER, the second column (b), (e), and (h) concentrations in the cis Golgi, and the third column (c), (f), and (i) concentrations in the trans Golgi.
B. Golgi disassembly simulation
Previous studies have shown that Sar1 dominant negative, which is guanosine disphosphate (GDP)-restricted due to a mutation that prevents nucleotide exchange, prevents ER exit and rapidly disassembles Golgi cisternae by inhibiting Golgi protein transport from the ER to the cis Golgi cisterna [39–43]. We modeled this condition by initiating simulations from the steady states of the experiments depicted in Fig. 3 and then allowing the simulations to continue with budding of vesicles from the ER blocked (for the DS simulator) or, equivalently, fluxes from the ER to other compartments fixed to zero (for ODE and SDE simulators). The result in each case is collapse of Golgi membrane and markers back into the ER.
Figure 5 plots the compartments sizes versus time for the three disassembly simulations. All three show a rapid loss of Golgi size and corresponding increase in ER size over approximately 50 min. Beyond that time, the DS Golgi compartments reach vesicle size, at which point they can no longer bud, while the ODE and SDE models continue to show a steady decay. All three show a faster collapse for the cis Golgi than the trans Golgi. The gap between the two times is much larger for the continuum models than for the DS model. This discrepancy between the models appears to reflect that fact that there is a minimum compartment size in the discrete model while the continuum models allow compartments to become arbitrarily small. After compartments have reached vesicle size, the DS model no longer exhibits any noise, while the SDE continues to show fluctuations about the equilibrium. Note that overall time scale of our model is arbitrary, depending only on how we define the units of the budding and fusion rate constants c and d. We would therefore not attach any significance to the absolute time required for assembly or disassembly in the model.
FIG. 5.
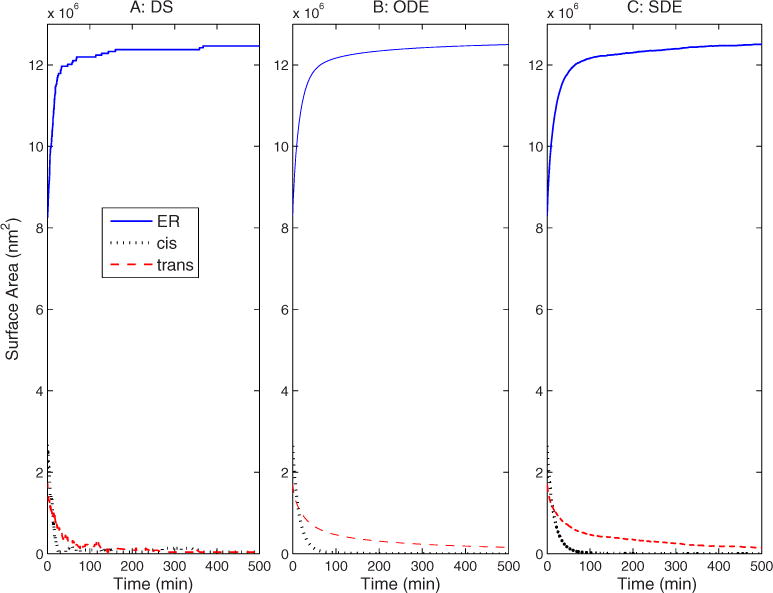
(Color online) Compartment sizes vs time during Golgi disassembly for (a) DS, (b) ODE, and (c) SDE simulations.
Figure 6 assesses contamination of the ER with Golgi markers by monitoring GEF protein concentration in the ER versus time. The ER’s GEF protein concentrations equilibrate at approximately 0.6, 0.4, and 1.0, which are the same as the initial values that we set up in the Golgi assembly experiments in Table I. As with compartment sizes, the DS and ODE models stabilize by about 500 min, while the SDE continues to exhibit notable fluctuations beyond that point.
FIG. 6.
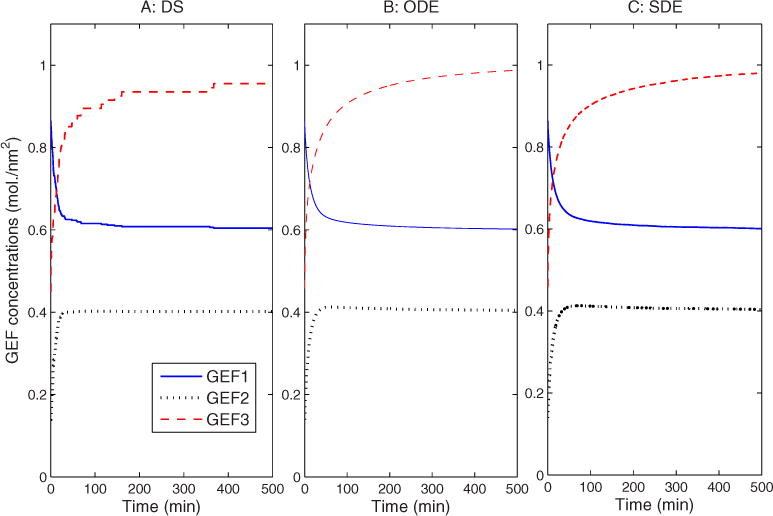
(Color online) Compartment GEF marker concentrations vs time in the ER during Golgi disassembly in (a) DS, (b) ODE, and (c) SDE simulations.
Alcalde et al. [44] reported that the cis Golgi disorganizes more quickly than the trans Golgi after brefeldin A (BFA) treatment, which induces disassembly of the Golgi apparatus, consistent with our observations. We were therefore interested in determining whether the different disassembly kinetics for cis and trans compartments is a robust feature of the model or whether it might depend on specific choices of initial marker concentrations for the two compartments. Figure 7 tests the robustness of the observation by separately examining the disassembly time of cis and trans Golgi compartments as functions of initial GEF2 (cis marker GEF) concentration in the cis Golgi compartment. The results reveal that increasing the initial amount of GEF2 (the cis marker GEF) accelerates disassembly of both the cis Golgi and the trans Golgi, but the cis Golgi consistently disassembles faster than the trans Golgi. The variation in disassembly times varies noticeably between the three simulations. All three show comparable times to disassemble the cis Golgi across parameter values. The trans Golgi, however, disassembles approximately twice as fast in the DS model as the SDE and 3 times as fast in the DS versus the ODE. This observation may again reflect the effect of having a minimum compartment size in the DS model that is not present in the continuum models.
FIG. 7.
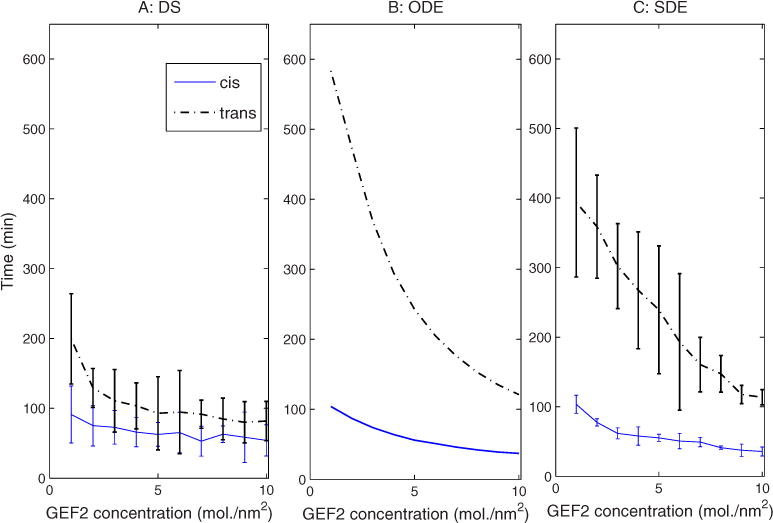
(Color online) Golgi disassembly time vs GEF2 concentration in cis Golgi for (a) DS, (b) ODE, and (c) SDE simulations.
C. Parameter sensitivity
All three simulation methods depend on a number of simulation parameters. We therefore further compared the methods by examining their sensitivity to changes in these parameters.
We first examined sensitivity to changes in the sorting affinity, Keq, which controls how effectively vesicles concentrate selectively exported markers. Figure 8 assesses the effects of sorting affinity on the ability of the model to maintain distinct compartment identities, quantified by measuring the fractional contamination of the ER by nonnative markers. Initially, the nonnative marker proteins account for 50% of the total amount of proteins in the ER. Figure 8 shows that the contamination falls rapidly with increasing affinity, dropping below 10% when the affinity is larger than 15 for all three simulation methods. All three models appear insensitive to affinity above about 40, with contamination held below 5% past that point. When the affinity is near 1, the ER exhibits a complete loss of identity.
FIG. 8.
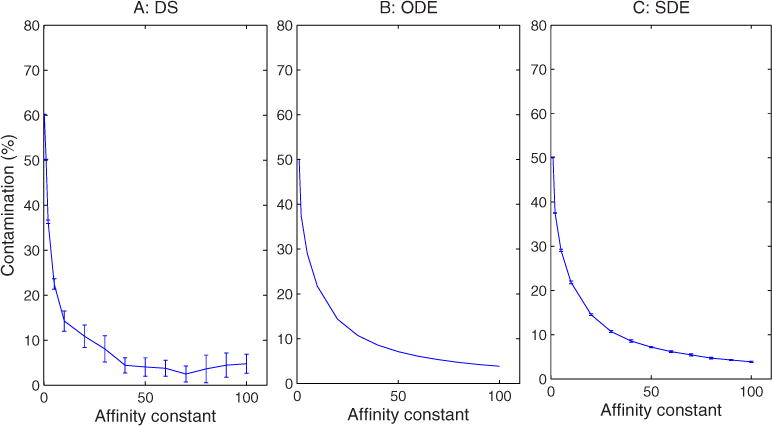
(Color online) Steady-state protein contamination in the ER as a function of sorting affinity for (a) DS, (b) ODE, and (c) SDE simulations. The affinity constant is dimensionless and therefore lacks a unit label.
The loss of ER identity is partially explained by examining the effects of affinity changes on compartment sizes, shown in Fig. 9. Compartment sizes appear insensitive to increases in the affinity constant above about 20 for all three simulations. The discrete and continuum simulations, however, diverge sharply in the extreme low values of affinity. In the DS simulation, at the extremely low affinities, the Golgi membrane mass collapses into a single compartment. In the ODE and SDE simulations, though, membrane appears to distribute equally among the three compartments as affinity approaches 1. Figure 10 shows that the affinity constant also influences the assembly time required to reach steady state. The three methods show somewhat different absolute time scales, with DS generally fastest and ODE slowest, although this may in part be attributable to different definitions of assembly time required for the stochastic versus deterministic methods. This result may also in part reflect the fact that higher affinities lead to more complete segregation of markers between compartments and thus to a longer time to achieve that segregation. With larger affinities, we also observe larger variances in assembly time, an effect that is more pronounced in the SDE than the DS simulations.
FIG. 9.
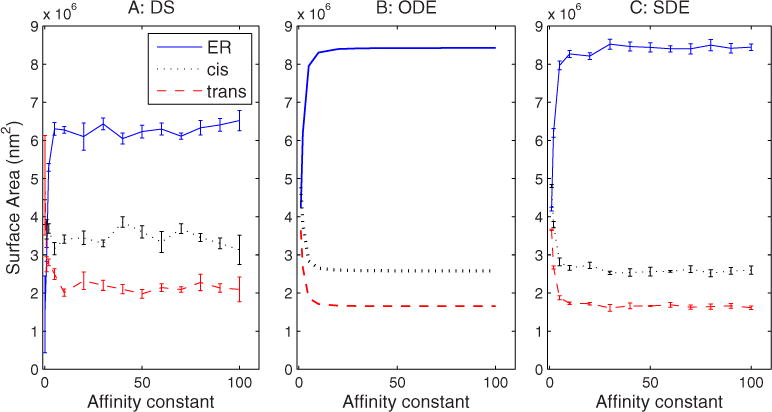
(Color online) Compartment size changes vs changes in sorting affinity in (a) DS, (b) ODE, and (c) SDE simulations. The affinity constant is dimensionless and therefore lacks a unit label.
FIG. 10.
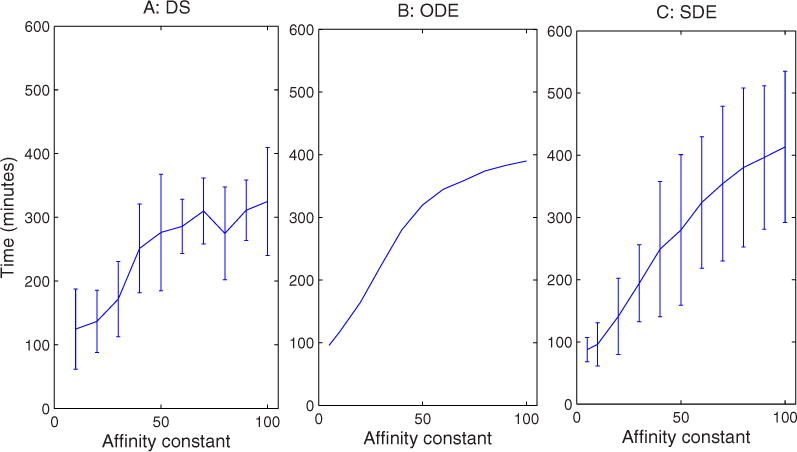
(Color online) Time to steady state vs changes in affinity constant for (a) DS, (b) ODE, and (c) SDE simulations. The affinity constant is dimensionless and therefore lacks a unit label.
We next examined sensitivity of the models to changes in the vesicle budding rate constant c, which provides an overall scaling factor for budding rate relative to fusion rate. The effects of this constant are of interest because we currently have no empirical basis for setting it and would therefore benefit from identifying observable outputs influenced by it. Our analysis of analytical steady-state solutions to the ODEs [Eq. (5)] indicates that steady-state compartment sizes are independent of this parameter, a result observed for DS simulations (data not shown). Nonetheless, Eq. (3) suggests that c would influence the time scale on which the system goes to steady state. Figure 11 quantifies this prediction by measuring the time for the system to transition from vesicle-sized Golgi compartments to steady state. The figure shows that increased budding constant reduces the time to steady state for all three simulations. The one significant difference between the ODE and the two stochastic methods is that the stochastic methods reveal a variance in assembly time that grows with slower budding rate. For the smallest budding constants, the time to the steady state in the DS model can range from 100 to 230 min. This change in variance is evident but less pronounced in the SDE model.
FIG. 11.
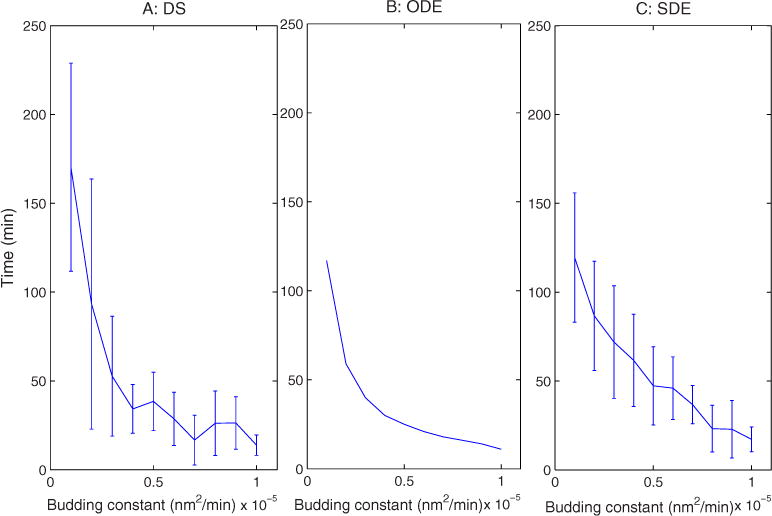
(Color online) Assembly time vs changes in budding constant for (a) DS, (b) ODE, and (c) SDE simulations.
We next examined the sensitivity of the models to the changes in starting Golgi marker protein GEF concentration, as shown in Fig. 12. The three models all show that compartment size is responsive to changes in initial concentration of GEF protein. Specifically, increasing the amounts of GEF1 concentration initially in the ER compartment caused a reassortment of membrane from ER and trans Golgi to cis Golgi. This experiment does not reveal any significant difference between the simulations aside from the previously noted smaller size of the ER in the DS simulations.
FIG. 12.
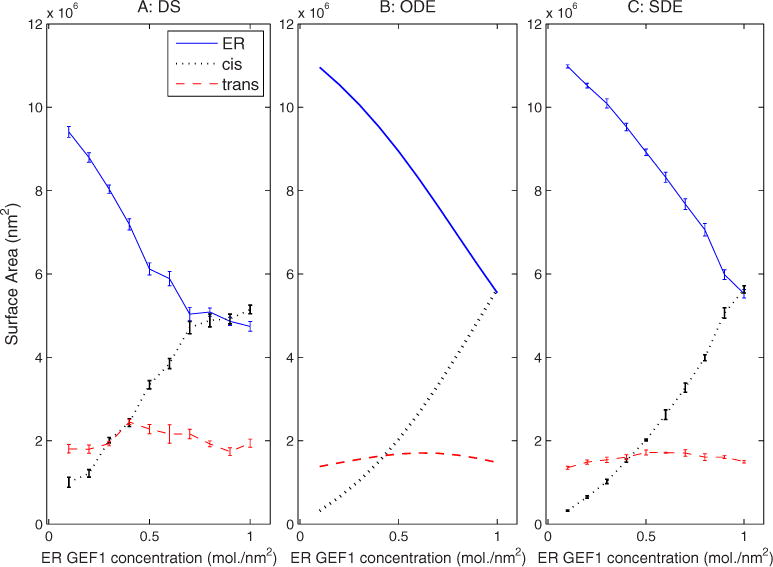
(Color online) Sensitivity of compartment sizes to changes in starting ER GEF1 protein concentration in (a) DS, (b) ODE, and (c) SDE simulations.
D. Experimental validation
We finally performed an experimental validation to determine whether the underlying model is in fact a reasonable qualitative model of Golgi function and its parameter dependence. Our intention was to determine whether the basic model, independent of its realization in the three simulations, provides a reasonable description of Golgi behavior and its parameter dependence. We therefore chose to examine a consistent prediction of the three models: the ability of changes in marker GEF concentration to cause a redistribution of membrane between compartments. For this purpose, we measured the size of the Golgi marked by a cis Golgi marker, GPP130 in HeLa cells transiently transfected with HA-tagged ER-localized GEF (mSec12), which mediates the ER exit of Golgi proteins (corresponding to the ER GEF1 in our simulation model). Figure 13 shows Golgi size is increased by expression of the ER-localized GEF as measured by HA staining (a and b) and GPP130 staining after three-dimensional (3D) rendering (c and d). Control cells were those that exhibited little or no detectable expression of HA-mSec12, whereas expressing cells were neighboring cells yielding strong staining. Golgi size normalized to cell volume was quantified in control cells and the cells expressing HA-mSec12 (e). The correlation of Golgi size to the mSec12 expression level is also shown on a cell-by-cell basis (f). This increase in Golgi size with increasing mSec12 expression corresponded with a decrease in average GPP130 staining per pixel in the defined Golgi region [regression fit of (GPP130) = −2×10⁻⁶(mSec12) + 835.28 with correlation coefficient 0.3257], consistent with the hypothesis that cis Golgi markers are diluted as the membrane mass of the cis Golgi increases due to increased ER export. These findings support our predictions based on Fig. 12 that compartment sizes will be responsive to changes in the available GEF marker protein concentrations.
FIG. 13.
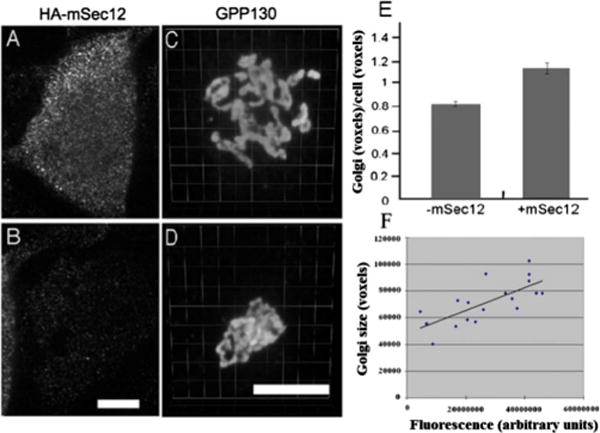
(Color online) Golgi size is increased by expression of the ER-localized GEF. HeLa cells transiently transfected with HA-tagged ER-localized GEF (mSec12) were analyzed to reveal (a) and (b) HA staining as well as (c) and (d) GPP130 shown after 3D rendering. (e) Golgi size normalized to cell volume was quantified in control cells and the cells expressing HA-mSec12. (f) The Golgi size and expression level were also compared on a cell-by-cell basis, with the correlation plot showing a slope of 0.0009. As might be expected, concomitant with the Golgi size increase was an up to 20% decrease in the mean intensity per pixel of GPP130 staining in the defined Golgi region, consistent with dilution of GPP130 in a larger compartment (not shown). Sizes are expressed in voxels, each of which has dimension 0.05×0.05×0.3 μm3. Bar, 10 μm.
IV. DISCUSSION
In order to explore the importance of discretization and stochasticity to Golgi function, we have built three different simulations of a minimal model of protein sorting and transport in the ER-Golgi network. One simulator (DS) implements a discrete, stochastic simulation of the model, the second (ODE) a continuous, deterministic simulation, and the third (SDE) a continuous, stochastic simulation. All three simulations are able to exhibit restoration, maintenance, and disassembly of Golgi compartments under appropriate conditions and do so in qualitatively similar manners. Furthermore, all three respond to increases in ER marker GEF concentration comparably to what is observed upon transient transfection of HeLa cells with recombinant mSec12. The three models do, however, display some notable distinctions in behavior, especially with regard to assembly and disassembly of the Golgi and extremes of parameter values. The stochastic models show a different mechanism than the ODEs for Golgi assembly from remnant compartments, involving transient creation of hybrid cis-trans compartments that then partition into their distinct identities. The ODEs, by contrast, yield emergence of a trans compartment essentially directly from the ER. This hybrid compartment exists only for an extremely short time in the SDE simulations, though, suggesting that both stochasticity and discretization are necessary to capture this effect on any time scale that might be biologically meaningful. Given that the true vesicle transport system is more realistically described by the discrete model, we can suggest that the alternative mechanism it yields is likely to be a more accurate description of the true assembly process. This interpretation that the trans Golgi forms out of the cis Golgi rather than directly from the ER would also appear more physically plausible given the spatial arrangement of the compartments. Likewise, the models exhibit different relative kinetics for collapse of the cis and trans Golgi compartments. These observations of different mechanisms of compartment assembly and disassembly, along with the previously noted necessity of discretization for a true de novo assembly model without prior Golgi remnants, suggest that accurately capturing both the discretization and randomness implied by a vesicle-based sorting mechanism may be important to modeling the Golgi assembly process. The DS model also suggests a very different response to loss of sorting affinities than is seen in either continuum model, with the DS model showing collapse of the Golgi while the ODE and SDE models show loss of compartment identities but not the compartments themselves. While there may be no experimental condition under which such a loss of sorting affinity occurs, it does nonetheless demonstrate how discretization effects can also lead to very different results in modeling Golgi disassembly.
It is important to note that all three models are highly simplified representations of the true behavior of the Golgi. While this simplification is necessary if one wishes to explore the minimal mechanisms by which a Golgi could function, it nonetheless does raise the question of whether other mechanisms omitted from the model may nonetheless be integral to the compartment assembly, maintenance, and disassembly behaviors we examine. Recent studies have shown the importance of Golgi tether proteins, which link a specific type of vesicle to an appropriate acceptor compartment [14,45] prior to SNARE-mediated vesicle fusion. It remains unclear whether the existence of tether proteins would fundamentally alter targeting behavior relative to the purely SNARE-mediated targeting assumed by our model. Another key concept omitted from our model is cisternal maturation [28,46]. The cisternal maturation model predicts a lag period after cargo proteins enter a Golgi compartment until they reach their final destinations, corresponding to the time that it takes the glycosylation enzymes to be transported to the Golgi compartment to process the protein molecules via retrograde trafficking. Our three simulations, as shown in Figs. 3 and 4, all lead to transport with exponential kinetics and no lag period, in contrast to the expectation from the cisternal maturation model. Recent experiments by Patterson et al. [27], though, found that cargo protein molecules exit the Golgi at an exponential rate proportional to their Golgi abundance with no lag period, which seems to indirectly support our model despite its omission of any notion of cisternal maturation. Nonetheless, developing a Golgi model capable of producing cisternal maturation is a long-term goal of the present work. While the present model does not incorporate maturation, our results suggest that discretization and stochasticity are likely to be important features to accurately capturing the repeated compartment formation and disassembly events that would be required of a maturation model. Patterson et al. [27] recently developed a rapid-partitioning model for intra-Golgi trafficking which for the first time incorporates a model of lipid trafficking into the protein transport through the secretory pathway. Their model found that protein trafficking in the Golgi could also be driven by lipid sorting, another feature our model lacks that might fundamentally alter its behavior. A further consideration is the possibility of a direct recycling pathway from the trans Golgi to the ER, suggested by evidence from Young et al. [47]. While the present work and the prior work of us [31] and Heinrich and Rapoport [30] suggest that no such alternative pathway is needed to explain recycling, that does not exclude the possibility that the pathway nonetheless operates and may significantly alter the behaviors described here.
Other experimental literature on Golgi assembly and disassembly provides observations of phenomena that might be considered in contradiction to our model. Our studies of the relative kinetics of disassembly of cis and trans Golgi were motivated by work of Alcalde et al. [44] showing more rapid disorganization of the cis Golgi upon BFA treatment, consistent with our model. Miles et al. [42], however, found that trans Golgi enzymes return to the ER more quickly than cis Golgi enzymes upon an ER exit block that would appear to more closely capture the conditions of our disassembly simulations. Miles et al. also found, though, that certain cis-localized transport and structural components were the first to return to the ER upon ER exit block and our model uses such transport components to establish compartment identities. It is not clear whether this distinction between marker types is sufficient to explain the apparent discrepancy in reports of relative cis-trans reassembly kinetics. Further elaboration of our model to distinguish between different marker types would likely be required to answer this question. Similarly, Kasap et al. [48] and Jiang et al. [49] reported that trans proteins concentrate early in the reassembling Golgi. This observation could be taken to contradict our model observation that the cis Golgi appears to emerge more rapidly than the trans. The compartment that will emerge as our cis Golgi, however, is initially strongly contaminated with trans markers and essentially exhibits a hybrid cis-trans identity in the stochastic models. There may therefore, in fact, be no contradiction between the experimental observation of trans markers emerging more rapidly and our model observation of the cis compartment emerging more rapidly. In addition, Presley et al. [50] used a temperature-sensitive ts045 vesicular stomatis virus G (VSVG) protein (VSVG-GFP) as transmembrane cargo to study protein trafficking, finding a wavelike pattern of cargo protein traversing the Golgi stack upon release from a short temperature block [25]. Our model currently produces no such “ringing” behavior during adjustment to equilibrium, suggesting that there may be more complicated feedback mechanisms influencing sorting kinetics than our simplified model captures.
There remain many unresolved questions about the necessary features of Golgi activity that will require experimental assessment before it will be possible to build and validate reliable predictive Golgi models. Our simulations make several predictions that suggest experiments one might perform to further validate or refine the models. Some predictions, for example, that Golgi compartment disassembly time after the application of dominant-negative Sar1 is dependent on cis marker GEF expression levels appear to be consistent across the simulation types we examine and may therefore provide good tests of the underlying model assumptions independent of the details of the simulation method. Others predictions differ between simulation methods, such as those regarding distributions of Golgi markers early in assembly, potentially providing ways to determine whether discretization and/or stochasticity do in fact affect overall Golgi behaviors or whether there are other mitigating factors missing from our models. A key goal of developing simulation models is to provide a framework in which one can infer quantitative parameters that cannot be directly observed experimentally. Future experiments might, for example, help us to constrain various unknown parameters such as the sorting affinities or rate constants and reaction orders for budding and fusion. The coarse-grained models described here are likely to require much further refinement before they will give sufficiently reliable quantitative results. Studies such as that described here, which help us understand what features a Golgi simulation model must contain, nonetheless form a key step in the development of such predictive systems-level models of Golgi function.
Acknowledgments
We are grateful to Kuok-Chiang Kim and Jonathan Lustgarten for their efforts in coding earlier prototypes of the discrete event simulation approach used in this work. We would like to thank Professor Michael Widom, Professor Robert Swendsen, and Professor Markus Deserno for their helpful suggestions on our paper. This work was supported by grants from the U.S. National Science Foundation (Grant No. 0346981, R.S.), U.S. National Institutes of Health (Grant No. R01GM56779, A.L.), the American Cancer Society (Grant No. RSG0314801CSM, A.L.), and the Eberly Family Foundation (R.S.).
APPENDIX: REACTION RATES AND ODES
1. Vesicle budding rates
In the compartment A,
Rate to bud a v-SNARE1-activated vesicle is BA1 = cSAGA[3](VA[1] + VA[2]).
Rate to bud a v-SNARE2-activated vesicle is BA2 = cSAGA[1](VA[2] + VA[3]).
Rate to bud a v-SNARE3-activated vesicle is BA3 = cSAGA[2](VA[1] + VA[3]).
The budding rates in the compartments B and C are:
The three types of budding rates in the compartment B are BB1 = cSBGB[3](VB[1] + VB[2]), BB2 = cSBGB[1](VB[2] + VB[3]), and BB3 = cSBGB[2](VB[1] + VB[3]).
The three types of budding rates in the compartment C are BC1 = cSCGC[3](VC[1] + VC[2]), BC2 = cSCGC[1](VC[2] + VC[3]), and BC3 = cSCGC[2](VC[1] + VC[3])
2. Vesicle fusion rates
The vesicle fusion rates and probabilities for vesicles budded from compartment A are:
For vesicles with label v-SNARE1 (VvA[1]=k0VA[1]), the rates to fuse with compartments A, B, and C are FAA1 = d(TA[1]VvA[1])2, FAB1 =d(TB[1]VvA[1])2. and FAC1 =d(TC[1]VvA[1])2. The corresponding fusion probabilities are pAA1=NA1FAA1, pAB1=NA1FAB1, and pAC1=NA1FAC1, where NA1= (FAA1+FAB1+FAC1)−1.
For vesicles with label v-SNARE2 (VvA[2]=knVA[2]), the rates to fuse with compartments A, B, and C are FAA2=d(TA[2]VvA[2])2, FAB2=d(TB[2]VvA[2])2, and FAC2=d(TC[2]VvA[2])2. The corresponding fusion probabilities are pAA2=NA2FAA2, pAB2=NA2FAB2, and pAC2=NA2FAC2, where NA2= (FAA2+FAB2+FAC2)−1.
For vesicles with label v-SNARE3 (VvA[3]=knVA[3]), the rates to fuse with compartments A, B, and C are FAA3=d(TA[3]VvA[3]2, FAB3=d(TB[3]VvA[3])2, and FAC3=d(TC[3]VvA[3])2. The corresponding fusion probabilities are pAA3=NA3FAA3, pAB3=NA3FAB3, and pAC3=NA3FAC3, where NA3= (FAA3+FAB3+FAC3)−1.
The vesicle fusion rates and probabilities for vesicles budded from compartment B are:
For vesicles with label v-SNARE1 (VvB[1]=knVB[1]), the rates to fuse with compartments A, B, and C are FBA1 =d(TA[1]VvB[1])2, FBB1=d(TB[1]VvB[1])2, and FBC1=d(TC[1]VvB[1])2. The corresponding fusion probabilities are pBA1=NB1FBA1, pBB1=NB1FBB1, and pBC1=NB1FBC1, where NB1=(FBA1+FBB1+FBC1)−1.
For vesicles with label v-SNARE2 (VvB[2]=k0VB[2]), the rates to fuse with compartments A, B, and C are FBA2=d(TA[2]VvB[2])2, FBB2=d(TB[2]VvB[2])2, and FBC2=d(TC[2]VvB[2])2. The corresponding fusion probabilities are pBA2=NB2FBA2, pBB2=NB2FBB2, and pBC2=NB2FBC2, where NB2= (FBA2+FBB2+FBC2)−1.
For vesicles with label v-SNARE3 (VvB[3]=knVB[3]), the rates to fuse with compartments A, B, and C are FBA3=d(TA[3]VvB[3])2, FBB3=d(TB[3]VvB[3])2, and FBC3=d(TC[3]VvB[3])2. The corresponding fusion probabilities are pBA3=NB3FBA3, pBB3=NB3FBB3, and pBC3=NB3FBC3, where NB3= (FBA3+FBB3+FBC3)−1.
The vesicle fusion rates and probabilities for vesicles budded from compartment C are:
For vesicles with label v-SNARE1 (VvC[1]=knVC[1]), the rates to fuse with compartments A, B, and C are FCA1=d(TA[1]VvC[1])2, FCB1=d(TB[1]VvC[1])2, and FCC1=d(TC[1]VvC[1])2. The corresponding fusion probabilities are pCA1=NC1FCA1, pCB1=NC1FCB1, and pCC1=NC1FCC1, where NC1=(FCA1+FCB1+FCC1)−1.
For vesicles with label v-SNARE2 (VvC[2]=knVC[2]), the rates to fuse with compartments A, B, and C are FCA2=d(TA[2]VvC[2])2, FCB2=d(TB[2]VvC[2])2, and FCC2=d(TC[2]VvC[2])2. The corresponding fusion probabilities are pCA2=NC2FCA2, pCB2=NC2FCB2, and pCC2=NC2FCC2, where NC2=(FCA2+FCB2+FCC2)−1.
For vesicles with label v-SNARE3 (VvC[3]=k0VC[3]), the rates to fuse with compartments A, B, and C are FCA3=d(TA[3]VvC[3])2, FCB3=d(TB[3]VvC[3])2, and FCC3=d(TC[3]VvC[3])2. The corresponding fusion probabilities are pCA3=NC3FCA3, pCB3=NC3FCB3, and pCC3=NC3FCC3, where NC3= (FCA3+FCB3+FCC3)−1.
3. Ordinary differential equations
ODEs for the compartment sizes SA, SB, and SC,
ODEs for protein concentration PA (where PA can be GA, TA, VA) in compartment A are
ODEs for protein concentration PB (where PB can be GB, TB, VB) in compartment B are
ODEs for protein concentration PC (where PC can be GC, TC, VC) in compartment C are
References
- 1.Rothman JE, Wieland FT. Science. 1996;272:227. doi: 10.1126/science.272.5259.227. [DOI] [PubMed] [Google Scholar]
- 2.Schekman R, Orci L. Science. 1996;271:1526. doi: 10.1126/science.271.5255.1526. [DOI] [PubMed] [Google Scholar]
- 3.Yoshihisa T, Barlowe C, Schekman R. Science. 1993;259:1466. doi: 10.1126/science.8451644. [DOI] [PubMed] [Google Scholar]
- 4.Bonifacino JS, Glick GS. Cell. 2004;116:153. doi: 10.1016/s0092-8674(03)01079-1. [DOI] [PubMed] [Google Scholar]
- 5.Donaldson JG, Lippincott-Schwartz J. Cell. 2000;101:693. doi: 10.1016/s0092-8674(00)80881-8. [DOI] [PubMed] [Google Scholar]
- 6.Guo Y, Linstedt AD. J Cell Biol. 2006;174:53. doi: 10.1083/jcb.200604058. [DOI] [PMC free article] [PubMed] [Google Scholar]
- 7.Yu W, O’Brien LE, Wang F, Bourne H, Mostov KE, Zegers MM. Mol Biol Cell. 2003;14:748. doi: 10.1091/mbc.E02-06-0350. [DOI] [PMC free article] [PubMed] [Google Scholar]
- 8.Lu Z, Joseph D, Bugnard E, Zaal KJ, Ralston E. Mol Biol Cell. 2001;12:795. doi: 10.1091/mbc.12.4.795. [DOI] [PMC free article] [PubMed] [Google Scholar]
- 9.Knaapen MW, Vrolijk BC, Wenink AC. Anat Rec. 1997;248:233. doi: 10.1002/(SICI)1097-0185(199706)248:2<233::AID-AR10>3.0.CO;2-Q. [DOI] [PubMed] [Google Scholar]
- 10.Puri S, Linstedt AD. Mol Biol Cell. 2003;14:5011. doi: 10.1091/mbc.E03-06-0437. [DOI] [PMC free article] [PubMed] [Google Scholar]
- 11.Springer S, Spang A, Schekman R. Cell. 1999;97:145. doi: 10.1016/s0092-8674(00)80722-9. [DOI] [PubMed] [Google Scholar]
- 12.Rothman JE. Nature (London) 1994;372:55. doi: 10.1038/372055a0. [DOI] [PubMed] [Google Scholar]
- 13.Behnia R, Munro S. Nature (London) 2005;438:597. doi: 10.1038/nature04397. [DOI] [PubMed] [Google Scholar]
- 14.Short B, Haas A, Barr FA. Biochim Biophys Acta. 2005;1744:383. doi: 10.1016/j.bbamcr.2005.02.001. [DOI] [PubMed] [Google Scholar]
- 15.Alvarez C, Fujita H, Hubbard A, Sztul E. J Cell Biol. 1999;147:1205. doi: 10.1083/jcb.147.6.1205. [DOI] [PMC free article] [PubMed] [Google Scholar]
- 16.Alvarez C, Garcia-Mata R, Hauri HP, Sztul E. J Biol Chem. 2001;276:2693. doi: 10.1074/jbc.M007957200. [DOI] [PubMed] [Google Scholar]
- 17.Waters MG, Clary DO, Rothman JE. J Cell Biol. 1992;118:1015. doi: 10.1083/jcb.118.5.1015. [DOI] [PMC free article] [PubMed] [Google Scholar]
- 18.Brandon E, Szul T, Alvarez C, Grabski R, Benjamin R, Kawai R, Sztul E. Mol Biol Cell. 2006;17:2996. doi: 10.1091/mbc.E05-09-0862. [DOI] [PMC free article] [PubMed] [Google Scholar]
- 19.Puthenveedu MA, Linstedt AD. Proc Natl Acad Sci USA. 2004;101:1253. doi: 10.1073/pnas.0306373101. [DOI] [PMC free article] [PubMed] [Google Scholar]
- 20.Allan B, Moyer BD, Balch WE. Science. 2000;289:444. doi: 10.1126/science.289.5478.444. [DOI] [PubMed] [Google Scholar]
- 21.Sonnichsen B, Lowe M, Levine T, Jamsa E, Dirac-Svejstrup B, Warren G. J Cell Biol. 1998;140:1013. doi: 10.1083/jcb.140.5.1013. [DOI] [PMC free article] [PubMed] [Google Scholar]
- 22.Caviston JP, Holzbaur EL. Trends Cell Biol. 2006;16:530. doi: 10.1016/j.tcb.2006.08.002. [DOI] [PubMed] [Google Scholar]
- 23.Soldati T, Schliwa M. Nat Rev Mol Cell Biol. 2006;7:897. doi: 10.1038/nrm2060. [DOI] [PubMed] [Google Scholar]
- 24.Egea G, Lazaro-Dieguez F, Vilella M. Curr Opin Cell Biol. 2006;18:168. doi: 10.1016/j.ceb.2006.02.007. [DOI] [PubMed] [Google Scholar]
- 25.Trucco A, et al. Nat Cell Biol. 2004;6:1071. doi: 10.1038/ncb1180. [DOI] [PubMed] [Google Scholar]
- 26.Drin G, Morello V, Casella JF, Gounon P, Antonny B. Science. 2008;320:670. doi: 10.1126/science.1155821. [DOI] [PubMed] [Google Scholar]
- 27.Patterson GH, Hirschberg K, Polishchuk RS, Gerlich D, Phair RD, Lippincott-Schwartz J. Cell. 2008;133:1055. doi: 10.1016/j.cell.2008.04.044. [DOI] [PMC free article] [PubMed] [Google Scholar]
- 28.Glick BS, Elston T, Oster G. FEBS Lett. 1997;414:177. doi: 10.1016/s0014-5793(97)00984-8. [DOI] [PubMed] [Google Scholar]
- 29.Weiss M, Nilsson T. FEBS Lett. 2000;486:2. doi: 10.1016/s0014-5793(00)02155-4. [DOI] [PubMed] [Google Scholar]
- 30.Heinrich R, Rapoport TA. J Cell Biol. 2005;168:271. doi: 10.1083/jcb.200409087. [DOI] [PMC free article] [PubMed] [Google Scholar]
- 31.Gong H, Sengupta D, Linstedt AD, Schwartz R. Biophys J. 2008;95:1674. doi: 10.1529/biophysj.107.127498. [DOI] [PMC free article] [PubMed] [Google Scholar]
- 32.Stewart BA, Mohtashami M, Trimble WS, Boulianne GL. Proc Natl Acad Sci USA. 2000;97:13955. doi: 10.1073/pnas.250491397. [DOI] [PMC free article] [PubMed] [Google Scholar]
- 33.Laage R, Rohde J, Brosig B, Langosch D. J Biol Chem. 2000;275:17481. doi: 10.1074/jbc.M910092199. [DOI] [PubMed] [Google Scholar]
- 34.Hua Y, Scheller RH. Proc Natl Acad Sci USA. 2001;98:8065. doi: 10.1073/pnas.131214798. [DOI] [PMC free article] [PubMed] [Google Scholar]
- 35.Gillespie DT. J Comput Phys. 1976;22:403. [Google Scholar]
- 36.Mogelsvang S, Marsh BJ, Ladinsky MS, Howell KE. Traffic (Oxford, UK) 2004;5:338. doi: 10.1111/j.1398-9219.2004.00186.x. [DOI] [PubMed] [Google Scholar]
- 37.Volchuk A, Amherdt M, Ravazzola M, Brugger B, Rivera VM, Clackson T, Perrelet A, Sollner T, Rothman JE, Orci L. Cell. 2000;102:335. doi: 10.1016/s0092-8674(00)00039-8. [DOI] [PubMed] [Google Scholar]
- 38.Gillespie DT. J Chem Phys. 2001;115:1716. [Google Scholar]
- 39.Barlowe C, Orci L, Yeung T, Hosobuchi M, Hamamoto S, Salama N, Rexach MF, Ravazzola M, Amherdt M, Schekman R. Cell. 1994;77:895. doi: 10.1016/0092-8674(94)90138-4. [DOI] [PubMed] [Google Scholar]
- 40.Storrie B, White J, Rottger S, Stelzer EH, Suganuma T, Nilsson T. J Cell Biol. 1998;143:1505. doi: 10.1083/jcb.143.6.1505. [DOI] [PMC free article] [PubMed] [Google Scholar]
- 41.Zaal KJ, Smith CL, Polishchuk RS, Altan N, Cole NB, Ellenberg J, Hirschberg K, Presley JF, Roberts TH, Siggia E, Phair RD, Lippincott-Schwartz J. Cell. 1999;99:589. doi: 10.1016/s0092-8674(00)81548-2. [DOI] [PubMed] [Google Scholar]
- 42.Miles S, McManus H, Forsten KE, Storrie B. J Cell Biol. 2001;155:543. doi: 10.1083/jcb.200103104. [DOI] [PMC free article] [PubMed] [Google Scholar]
- 43.Ward TH, Polishchuk RS, Caplan S, Hirschberg K, Lippincott-Schwartz J. J Cell Biol. 2001;155:557. doi: 10.1083/jcb.200107045. [DOI] [PMC free article] [PubMed] [Google Scholar]
- 44.Alcalde J, Bonay P, Roa A, Vilaro S, Sandoval I. J Cell Biol. 1992;116:69. doi: 10.1083/jcb.116.1.69. [DOI] [PMC free article] [PubMed] [Google Scholar]
- 45.Malsam J, Satoh A, Pelletier L, Warren G. Science. 2005;307:1095. doi: 10.1126/science.1108061. [DOI] [PubMed] [Google Scholar]
- 46.Morre DJ. Int Rev Cytol. 1987;17:211. [Google Scholar]
- 47.Young J, Stauber T, del Nery E, Vernos I, Pepperkok R, Nillson T. Mol Biol Cell. 2004;16:162. doi: 10.1091/mbc.E04-03-0260. [DOI] [PMC free article] [PubMed] [Google Scholar]
- 48.Kasap M, Thomas S, Danaher E, Holton V, Jiang S, Storrie B. Traffic (Oxford, UK) 2004;5:595. doi: 10.1111/j.1398-9219.2004.00203.x. [DOI] [PubMed] [Google Scholar]
- 49.Jiang S, Rhee SW, Gleeson PA, Storrie B. Mol Biol Cell. 2006;17:4105. doi: 10.1091/mbc.E05-12-1112. [DOI] [PMC free article] [PubMed] [Google Scholar]
- 50.Presley JF, Cole NB, Schroer TA, Hirschberg K, Zaal KJM. J Lippincott-Schwartz, Nature (London) 1997;389:81. doi: 10.1038/38001. [DOI] [PubMed] [Google Scholar]


