

Abstract
The dimeric focal adhesion protein talin contains up to 22 cryptic vinculin binding sites that are exposed by unfolding. Using a novel method to monitor the in situ dynamics of the talin dimer stretch, we find that in contrast to several prevalent talin dimer models the integrin-binding talin N-termini are separated by 162 ± 44 nm on average whereas as expected the C-terminal dimerization domains colocalize and are mobile. Using vinculin tagged by DHFR-TMP Atto655 label, we found that optimal vinculin and vinculin head binding occurred when talin was stretched to 180 nm, while the controls did not bind to talin. Surprisingly, multiple vinculins bound within a single second in narrowly localized regions of the talin rod during stretching. We suggest that talin stretches as an antiparallel dimer and that activates vinculin binding in a cooperative manner, consistent with the stabilization of folded talin by other binding proteins.
Keywords: Talin, vinculin, focal adhesion, protein recruitment, single molecule tracking, localization microscopy
Graphical Abstract
The sensing of cellular forces and substrate rigidity plays fundamental roles in cell growth, death, and differentiation. But how cells transduce matrix forces into chemical responses remains often unclear at a molecular level because the tools to follow the molecular mechanics and dynamics are incomplete. Earlier studies on cytoskeletal and signaling proteins have formed a consensus that the mechanical stretching of proteins is a fundamental mechanism of force sensing that stimulates the binding or release of partner proteins.1 We have shown before in vitro and in situ that mechanical unfolding of talin leads to vinculin binding.2,3 In addition, it was found during early adhesion formation in live cells that vinculin was only recruited to integrin clusters upon myosin II contraction but it had a lifetime of less than 20 seconds in adhesions.4 There are a few more proteins that bind to talin in vitro and could alter the stretching of talin by stabilizing the folded form of talin in vivo such as Riam1.5 Further, little was known whether or not talin’s antiparallel, C-terminal, dimerization domains result in a significant separation of the N-terminal binding sites.6 The dynamics of the stretching and binding events underlie fundamental processes that result in mechanical signaling. The surprisingly rapid stretch-dependent binding and relaxation events in vivo are difficult to correlate with cellular functions because the simultaneous measurement of binding and molecular stretching in situ has not been done.
In order to understand the molecular nature of both stretching and binding, we have derived a system to monitor both molecular length and the binding of other proteins at a subsecond time scale and super-resolution precision using three fluorophores. The previously developed method for measuring talin length in vivo using an N-terminal GFP and C-terminal mCherry tag2 was extended to enable measurements of the separation between the two GFP or two mCherry moieties (Figure 1A) in a single talin dimer. Building on this capability, we could address the question of whether or not the N-terminal binding sites were separated in vivo. In brief, the point-spread functions (PSFs) of validated dimers were analyzed for distortion due to the separation between the GFP molecules (most validated mCherry doublets maintained a single PSF). A third spectral channel was introduced using a recent protocol for tagging DHFR chimeric proteins with TMP-Atto655 covalently.7 Atto655 is spectrally discernible from GFP and mCherry, and features a high photon output rate while fluorescent and a long-lived triplet state makes it possible to differentiate numerous tags within a diffraction-limited spot. Using intense TIRF illumination, binding of Atto655 tagged proteins is signaled by a bright, short-lived fluorescence emission that localizes the binding event and enables the recording of the rate of binding. With this protocol, we are able to visualize vinculin interaction with talin in situ beyond the resolution limit while we track talin’s length. This vinculin was expressed in cells containing endogenous vinculin and the ratio of tagged to endogenous was about 1 to 6 (see Supplementary Figure 1). These methods revealed that binding occurred during stretching and in a cooperative fashion not observed before.
Figure 1.

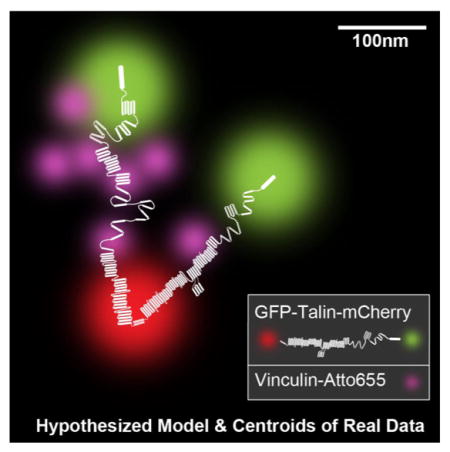
Localization of the C and N termini of talin Dimers. (A) A schematic of the GFP-talin-mCherry construct (GTC). GFP is attached to the N-terminal of talin and mCherry to the C-terminal of Talin. The N–C terminal distance (termed stretch) is calculated by averaging the length of two strands of the dimer, that is, (y1 + y2)/2. The distance between the two N-termini is referred to as x. (B) The GTC construct was transfected into talin (−/−) cells. Images were processed by the previously described methods for subsequent single molecule identification and tracking. Lower panel represent the illustration of centroid-based localization of a single talin dimer.
GFP-talin-mCherry was transfected into talin-knockout cells. As in our previous study, only signals present in both channels that were spatially isolated from other signals of the same spectral color and were observed in at least 4 time points (i.e., images, 1 s per frame) were processed. Processing involved correcting for stage drift with fiducial markers and for chromatic aberration with multiwavelength beads (Supplementary Figure 2). Further, true dimers were validated by two bleaching steps per channel. The analysis entailed removing background noise by accepting only those PSFs that satisfied our criteria (Figure 1B). Talin has an antiparallel dimerization domain that is localized at the end of the C-terminal.8,9 This raises the question of whether the two N-terminal domains are localized near one-another or far apart upon binding to integrins. We noted that the PSF of the GFP signal was often asymmetric, which we confirmed to be the subresolution separation of the two N-termini of the talin dimer, because single GFPs assumed a much stronger symmetry after the bleaching of one of the two dimers. Further, the PSF of the two C terminal mCherry fluorophores was nearly always symmetric but slightly out of focus as expected if the mCherry fluorophores were about 40 nm farther from the coverslip than the GFPs.10 We derived a matching algorithm that could analyze two GFP point emitters within a single diffraction limited optical peak and was tested by analyzing two overlapping images of a single fluorophore separated by 30–200 nm using a piezo stage (Supplementary Figure 3). The algorithm measured the displacement of the fluorophores in test images with an accuracy of 25nm–35nm when they were separated by 75 nm or more (see Supplementary Figure 4). For shorter separations, the uncertainty increased steeply, reaching 50 nm at 30 nm separation, which meant that the measurement of the separation distance between two fluorophores was only useful for fluorophores separated by more than 75 nm.
To determine the timing and the molecular location of vinculin binding to talin in correlation with the talin stretch length, a third fluorophore was attached to vinculin. It was important for the third fluorophores to not only be separated in wavelength from GFP and mCherry but also to have different excitation dynamics. To that end, we attached Atto655 to Vinculin in cells with the GFP-talin-mCherry construct, namely, we used the vinculin-DHFR:L28C (a DHFR-vinculin construct11) and a A-TMP-Atto655 tagging system. This method did not perturb the intracellular locations of the proteins of interest. We found that the Atto655 staining was in stress fibers in the case of a control DHFR-MLC (myosin light chain) construct (Figure 2A) and in adhesions with the DHFR-vinculin construct. We then observed the binding of DHFR-vinculin to the adhesions by its blinking events. The cycling of the Atto655 between its fluorescent and triplet states was induced by high-intensity TIRF illumination at 647 nm rather than a redox solution, akin to some dSTORM imaging techniques.12 When new vinculin molecules from the medium bound to the adhesions, we observed a brief burst of high intensity fluorescence that went dark within 30–60 ms (Supplementary Movie 2D) and typically stayed dark for more than 8–12 s in this particular environment. Using a 30 Hz frame rate, we can monitor as many as 12 individual binding events per second without ambiguity and up to 60 per second with mild aliasing resolved by the expected intensity step and shape of a single fluorophore. The length of the talin molecule was sampled in parallel once every second to ensure that we were measuring binding to talin and not to other components in the plasma membrane (Figure 2B). The vinculin events were only counted when they fell within the area of a single talin dimer as defined by the measured positions of the N- and C-termini with an uncertainty tolerance of 30 nm (Figure 2C). The TMP-Atto655-DHFR-vinculin binding events that were recorded were a lower bound estimate of the total vinculin binding to talin because of the presence of native vinculin in these cells and the presence of some DHFR-vinculin without Atto655. Very few Atto655 flares occurred in the regions that lacked talin, indicating that tagging was specific to better than 1 in 100. Thus, we were confident that the binding events observed were uniquely linked to vinculin binding to talin.
Figure 2.

Localization of vinculin and talin. (A) DHFR:L28C was genetically attached to the protein of interest (POI) and the tagging fluorophore A-TMP-Atto655 was electroporated into the cell together with plasmids (GFP-talin-mCherry and MLC-DHFR:L28C). Upon binding to DHFR:L28C-POI, a covalent bond forms between the TMP-dye compound and the DHFR:L28C-POI. (B) Illustration of GFP-talin-mCherry (filtered and contrast enhanced) and vinculin-DHFR:L28C A-TMP-Atto655 (contrast enhanced). The two algorithms for single molecule talin signal searching and dSTORM localization run independently at first. A third algorithm then merges the results of the first two algorithms along the XY axes, as well as time axis. Any dSTORM signal that falls into the resolution range of the identified talin stretch triangle is recorded. (C) In the case of this illustration (session B), there is a single dSTORM count in this talin track within the second second of the recorded talin stretching sequence.
As controls, we analyzed the binding of the DHFR-vinculin head domain (binds to talin stronger than full length vinculin), DHFR-A50I-vinculin (binds very weakly to talin) and DHFR-myosin light chain (should not bind to talin).13,14 In the case of full-length vinculin, the overall number of dSTORM events was 2721 events for 11 045 s of observation (24.6%) and with vinculin head domain 3970 events for 12 478 s of observation (31.8%), whereas only 358 events in 10 105 s of observation (3.5%) occurred with the A50I mutant (this corresponded to a specificity of binding to talin versus talin-free regions of 3 to 1, significantly below full-length vinculin) and only 130 events in 7488 s of observation for the myosin light chain (1.7%). A minimum of 75 cells (from at least two independent sample preparations) were analyzed for each of the four cell groups. Thus, we found that the binding was specific and followed the expected pattern, that is, vinculin head > full length vinculin ≫ A50I vinculin > myosin light chain.
To further characterize the binding, we measured the length of the talin when vinculin bound to it. A histogram plot (Figure 3A) shows that the maximum probability of binding occurred at a talin length of 180 nm for both the full-length vinculin and the vinculin head. When we examined where the vinculins bound along the length of the talin, we found that at low stretch, 50–180 nm, the majority of the binding events were near the N terminus of talin (Supplementary Figure 7). At high stretches >210 nm, most of the events occurred within the C terminal half of the molecule.
Figure 3.

Vinculin binding events onto talin. (A) Histogram of percentage of one-second intervals that have dSTORM events with respect to the talin stretch length. (B) Percentage of number of dSTORM events within one second over all talin stretch states of all sequences measured. (C) Talin stretch and vinculin dSTORM events of Supplementary Movie 3. Each orange line represents a vinculin dSTORM signal detected on the talin dimer. (D) Localization map of GFP, mCherry (GFP-talin-mCherry), and Atto655 (vinculin-DHFR:L28C, A-TMPAtto655) over four different time points (see Supplementary Movie 3).
The surprising finding was that many of the binding events were clustered. Although single binding events had a probability of 20% of occurring within any second, about 0.7% of the one-second periods had five and 0.2% had six binding events whereas the probability that five and six independent binding events in a Markov process that occur in 1 s should be 0.03% and 0.006%, respectively (Figure 3B). Because we followed the events for over 20 000 s combined (per group), the hypothesis that these events were correlated was significant to a level of 0.982 for a conservative bootstrap test and this was a lower estimate because only about 17% of the vinculin in the cell was fluorescent. Multiple binding events (five or more molecules binding within 1 s) occurred exclusively as the talin was being stretched. Animations of the stretching with superimposed binding also showed that stretching preceded binding (Supplementary Movie 3, Figure 3C,D). Further, the multiple binding events occurred in a small region of the talin molecule on average within a 13% standard deviation of the talin length but showed no preference for the N- or C-terminal half of talin. Often the rapid string of binding events within one second was followed by another event nearby after 2–6 s. Thus, it appeared that the stretching of talin caused cooperative vinculin binding that was not predicted.
The structure of the talin dimer in the cell has been an object of speculation for some time. Structural studies and in vitro binding experiments do not provide a clear view of the expected structure in vivo. The recently published structure of the dimerization domain indicates that the molecule should have an antiparallel dimerization domain for about 10 nm; however, the rest of the rod domains could have been oriented in almost any direction.8 Surprisingly, the separation of all observable N-terminal GFPs was 162 nm on average, which was more than twice the predicted length of the monomer (~50 nm from in vitro microscopy). Earlier, it was reported that the ligand spacing threshold for integrin-based cell spreading was 60–70 nm.15,16 However, initial integrin binding and talin recruitment presumably occurs when talin is unstretched whereas we are observing talin after an unspecified period bound to integrin. Further, we normally find that N–N axis is aligned close to the direction of the stretching, which would be the case if the N-terminal release and rebinding events occur (such events were commonly observed in long sequences). In the minimum binding unit experiments, the expectation is that the initial binding events would involve unstretched talin that would need to contact two liganded integrins to bind. The reliability of the measurement of the GFP separation distances was very significant as judged by the relative immobility of stable N-termini and the finding that some N-termini upon release are free to move with the C-termini. The release of N-termini from the integrin, movement to the C-terminus and rebinding could have accounted for the observed large stretching of the N-termini. This was supported by the fact that the C-terminus often was pulled along the axis of the two N-termini. In the case of integrin-bound N-termini, the integrin extracellular domain is 20 nm long and the cytoplasmic link through talin could add another 15 nm such that movements of ±30 nm could occur without disrupting the complex. Two actin-binding sites (ABS2 in the central rod region and ABS3 at the C terminus) were reported in talin rod domain (ABS1 overlaps with the N-terminal integrin binding site and it is usually considered nonactive). A recent study shows that although ABS2 is critical for FA maturation, constitutively active ABS2 renders FA force independent, and that ABS2 activation might be transient and happens when talin R3 domains are stretched open. This indicates that ABS3 is the main/initial talin ABS, which remains active as long as talins remain in the FA (Figure 4A).17 The stretching of talin is similar to that reported before in terms of the rate (10–60 nm/ s) and the length of the stretching (from 100 to 250 nm), which is consistent with an actin flow driven stretching. Thus, although the N-terminal separations observed are larger than expected, the overall stretching behavior is consistent with the observed antiparallel structure of the C-terminal dimerization domain and an actin filament based stick–slip model of the stretching.
Figure 4.

Schematics of talin structure and interaction of talin dimer with vinculin in cell. (A) Illustration of domain structure of full-length talin. Talin head domain contains a FERM domain (50 kDa), followed by a flexible “neck”(10 kDa), which connects the head domain to its C-terminal rod domain (220 kDa). The rod domain contains 11 cryptic VBS (drawn in blue). The dimerization domain is a single helix that sits at the end of the rod domain. (B) In the initial stage of FA formation, talin dimer binds to actin and integrin. At this stage, the cryptic VBSs remain buried among the α-helical bundles. (C) As the actin filament starts to pull on talin, the former buried VBS starts to reveal to allow vinculin binding, and subsequently more actin filament recruitment.
The binding of vinculin to stretched talin has been established in many in vitro studies showing that talin stretching will open sites for vinculin binding. Further, the in vivo measurements of talin stretching are consistent with vinculin binding to the stretched molecule, because the vinculin head domain that stays bound for long periods causes an increase in the length of talin in cells.2 Vinculin head domain also binds more readily than full-length vinculin, and both bind much more frequently than the vinculin A50I mutant to talin. Although it is expected that DHFR-vinculin will bind to stretched talin, there has been no way of knowing prior to this analysis at which length the greatest probability of binding would occur. From in vitro studies of the unfolding of the N-terminal rod domains (R1–R3) that have been used for previous studies both in vitro3,18 and in silico,19,20 those domains ought to contribute 50–180 nm to the length of talin over a force range of 5–20 pN and the other rod domains should unfold in the range of 8–12 pN (3,21 and unpublished results). Thus, it is difficult to predict from the in vitro unfolding measurements where the greatest probability of vinculin binding should occur and at what force. Because the length of vinculin is fluctuating on the 2–4 s time scale and the release of vinculin plus refolding of talin could occur on that time scale, the binding and release are potentially directly correlated with talin stretch and relaxation, respectively. Vinculin’s role in the cell is not to maintain equilibrium traction forces but it influences the dynamic forces that the cell produces in spreading to new areas.22 Because most of the binding events are near the N-terminus at low stretches, we suggest that the rod domains R1–R3, which contain five vinculin binding helices, ought to be the initial regions unfolded. At higher displacements, the C-terminal regions should unfold causing binding of vinculin as observed in vivo (Figure 4C). Thus, it appears that the in vivo binding of vinculin is consistent with the in vitro observations of vinculin binding to talin.3 Our approach, however, misses some vinculin-talin binding events: (1) A-TMP-Atto655 does not bind to every functional vinculin-DHFR:L28C and (2) there will be endogenous, nonfluorescent vinculins that bind to talin. Thus, as previously suggested, this method provides a quantitative lower bound of the dynamics of the binding interaction that is consistent with previous studies. Further, the lifetime of the bound vinculin is about 15 s from prior photobleaching studies4 and that is consistent with the average binding rate of 0.2/s since there should be many bound vinculins on average. Although we can observe a clear specificity in the binding with this method, the maximum number of vinculins that can bind to talin are significantly higher than our observation.
Numerous studies of cell mechanical activity have found statistically significant differences between the cells with vinculin and those without.23–25 However, there is not a simple parameter that correlates with the loss of vinculin and it has been difficult to pinpoint the steps where vinculin could be active. With the capability of measuring both the binding of vinculin and the stretching of molecules such as talin or α-catenin in situ, it is now possible to better understand which mechanical parameters correlate with vinculin binding and release. The dynamics may be the most important aspect of the process, because modification of vinculin could occur in the bound state (e.g., phosphorylation) and the concentration of the phosphorylated form could signal elsewhere in the cell.
Our observations indicate that vinculin binding to talin is highly cooperative with up to 10 vinculins binding in 1 s. However, in vitro studies of vinculin unfolding do not show dramatic changes in length indicating large domain unfolding except for the correlated unfolding of the interlinked rod domain R7 and R83,9,26 (Figure 4A). It is likely that the cooperative binding events are due to talin unfolding events because both full-length vinculin and vinculin head show similar cooperative binding behavior and because we always observe the multiple binding events as talin is stretching. Possible explanations for the cooperativity are (1) the folded configuration of talin is stabilized by the binding of proteins like Riam1 that are known to bind to the folded form5 or (2) the R7R8 domains are linked and hence unfold together. We favor the possibility that Riam1 and/or other proteins are holding talin in a folded configuration and their release causes the exposure of multiple vinculin binding sites.
This method can be applied to many different proteins and there are many proteins that are unfolded in vivo. On the basis of prior knowledge of the protein structure from existing biochemical and structural studies, the algorithm can be readily tailored to measure the length of single proteins as well as binding partner interactions. Our preliminary measurements of focal adhesion kinase, α-actinin, filaminA, and p130Cas have shown that they all undergo stretch-relaxation cycles within the cell. In the case of focal adhesions, it is commonly believed that they are processing centers for many adhesion components, because the lifetime of many adhesion proteins is less than 20 seconds whereas the lifetime of most adhesions is tens of minutes. To test this hypothesis, it is important to understand when the components bind to other adhesion components as the actin flow produces stretch-relaxation cycles. With the time resolution of this method, we can now measure binding in parallel with the stretch state and in correlation with force or actin flow to quantify how binding and dynamics are controlled.
Supplementary Material
Acknowledgments
Funding
MechanoBiology Institute Research Funds, Singapore.
Experiment reagents were mostly from Dr. Michael Sheetz and Dr. Alexander Bershadsky’s lab. We thank Dr. Alexander Bershadsky and Dr. Yee Han Tee for scientific advice on optimizing the experiments and Dr. Mingxi Yao and Dr. Ben Goult for discussion on structural information for talin. The support from staff in MBI Microscopy Core is appreciated.
ABBREVIATIONS
- dSTORM
direct stochastic optical reconstruction microscopy
- DHFR
dihydrofolate reductase
- TMP
trimethoprim
- PSF
point spread function
- MLC
myosin light chain
- ABS
actin binding site
- VBS
vinculin binding site
Footnotes
Author Contributions: The manuscript was written through contributions of all authors. All authors have given approval to the final version of the manuscript. X.H., F.M., and M.S. designed the experiments and wrote the paper. X.H. performed most of the experiment and data analysis. X.H. and F.M. were in charge of purchase, setup, and optimizing the microscopes used in this experiment. Image analysis algorithm was developed by F.M. and X.X. and they also ran some of the data analysis. C.J. was responsible for generating the DHFR-plasmids and A-TMP-Atto655 and contributed equally as X.H. in developing the new staining method of DHFR and TMP dyes. N.N. worked on cloning and Western blots for several control experiments. V.C. was the supervisor of C.J. and provided scientific advise on the DHFR and TMP staining and imaging experiments.
The authors declare no competing financial interest.
The Supporting Information is available free of charge on the ACS Publications website at DOI: 10.1021/acs.nanolett. 6b00650.
Supplementary Movie Legends and Material and Methods: Cell Culture, Plasmid, Transfection and Dye Characterization; Western Blotting; Microscopy; Image Processing; Statistics and Reliability of the Data Processing. (PDF)
Talin Single Molecule Trace: Processed movie of individual single Talin pair from 15 seconds of actual data (GFP-talin-mCherry (Green:GFP, Red:mCherry)). (AVI)
Real time three channel process chain. Talin Single Molecule Trace vs. Vinculin count events: A. Maximum Intensity Projection (MIP) overview of the two channels of GFP-talin-mCherry (Green:GFP, Red:mCherry). B. MIP of Vinculin Atto655. C. Enlarged movie of the single molecule Bayesian of the GFP-talin-mCherry channels in the marked Region of Interest (ROI). D. Enlarged movie of the Vinculin Atto655 channel in the same ROI. E. Identified single molecule pairs from panel C. F Identified molecular count from panel D. All scale bars are 1μm, the observation lasts17 seconds. (AVI)
Talin Single Molecule Trace and Vinculin molecular count: Processed 19 second movie of the interaction of an individual single Talin pair and Vinculins from actual data. (GFP-talin-mCherry (Green:GFP, Red:mCherry), Vinculin Atto655(Purple)). (AVI)
References
- 1.Johnson CP, Tang HY, Carag C, Speicher DW, Discher DE. Science. 2007;317(5838):663–6. doi: 10.1126/science.1139857. [DOI] [PMC free article] [PubMed] [Google Scholar]
- 2.Margadant F, Chew LL, Hu X, Yu H, Bate N, Zhang X, Sheetz M. PLoS Biol. 2011;9(12):e1001223. doi: 10.1371/journal.pbio.1001223. [DOI] [PMC free article] [PubMed] [Google Scholar]
- 3.Yao M, Goult BT, Chen H, Cong P, Sheetz MP, Yan J. Sci Rep. 2014;4:4610. doi: 10.1038/srep04610. [DOI] [PMC free article] [PubMed] [Google Scholar]
- 4.von Wichert G, Haimovich B, Feng GS, Sheetz MP. EMBO J. 2003;22(19):5023–35. doi: 10.1093/emboj/cdg492. [DOI] [PMC free article] [PubMed] [Google Scholar]
- 5.Goult BT, Zacharchenko T, Bate N, Tsang R, Hey F, Gingras AR, Elliott PR, Roberts GC, Ballestrem C, Critchley DR, Barsukov IL. J Biol Chem. 2013;288(12):8238–49. doi: 10.1074/jbc.M112.438119. [DOI] [PMC free article] [PubMed] [Google Scholar]
- 6.Golji J, Mofrad MR. Biophys J. 2014;107(8):1802–9. doi: 10.1016/j.bpj.2014.08.038. [DOI] [PMC free article] [PubMed] [Google Scholar]
- 7.Chen Z, Jing C, Gallagher SS, Sheetz MP, Cornish VW. J Am Chem Soc. 2012;134(33):13692–9. doi: 10.1021/ja303374p. [DOI] [PMC free article] [PubMed] [Google Scholar]
- 8.Gingras AR, Bate N, Goult BT, Hazelwood L, Canestrelli I, Grossmann JG, Liu H, Putz NS, Roberts GC, Volkmann N, Hanein D, Barsukov IL, Critchley DR. EMBO J. 2008;27(2):458–69. doi: 10.1038/sj.emboj.7601965. [DOI] [PMC free article] [PubMed] [Google Scholar]
- 9.Goult BT, Xu XP, Gingras AR, Swift M, Patel B, Bate N, Kopp PM, Barsukov IL, Critchley DR, Volkmann N, Hanein D. J Struct Biol. 2013;184(1):21–32. doi: 10.1016/j.jsb.2013.05.014. [DOI] [PMC free article] [PubMed] [Google Scholar]
- 10.Kanchanawong P, Shtengel G, Pasapera AM, Ramko EB, Davidson MW, Hess HF, Waterman CM. Nature. 2010;468(7323):580–4. doi: 10.1038/nature09621. [DOI] [PMC free article] [PubMed] [Google Scholar]
- 11.Gallagher SS, Sable JE, Sheetz MP, Cornish VW. ACS Chem Biol. 2009;4(7):547–56. doi: 10.1021/cb900062k. [DOI] [PMC free article] [PubMed] [Google Scholar]
- 12.Dertinger T, Heilemann M, Vogel R, Sauer M, Weiss S. Angew Chem, Int Ed. 2010;49(49):9441–3. doi: 10.1002/anie.201004138. [DOI] [PMC free article] [PubMed] [Google Scholar]
- 13.Chen H, Cohen DM, Choudhury DM, Kioka N, Craig SW. J Cell Biol. 2005;169(3):459–70. doi: 10.1083/jcb.200410100. [DOI] [PMC free article] [PubMed] [Google Scholar]
- 14.Peng X, Maiers JL, Choudhury D, Craig SW, DeMali KA. J Biol Chem. 2012;287(10):7728–37. doi: 10.1074/jbc.M111.297481. [DOI] [PMC free article] [PubMed] [Google Scholar]
- 15.Cavalcanti-Adam EA, Volberg T, Micoulet A, Kessler H, Geiger B, Spatz JP. Biophys J. 2007;92(8):2964–74. doi: 10.1529/biophysj.106.089730. [DOI] [PMC free article] [PubMed] [Google Scholar]
- 16.Schvartzman M, Palma M, Sable J, Abramson J, Hu X, Sheetz MP, Wind SJ. Nano Lett. 2011;11(3):1306–12. doi: 10.1021/nl104378f. [DOI] [PMC free article] [PubMed] [Google Scholar]
- 17.Atherton P, Stutchbury B, Wang DY, Jethwa D, Tsang R, Meiler-Rodriguez E, Wang P, Bate N, Zent R, Barsukov IL, Goult BT, Critchley DR, Ballestrem C. Nat Commun. 2015;6:10038. doi: 10.1038/ncomms10038. [DOI] [PMC free article] [PubMed] [Google Scholar]
- 18.del Rio A, Perez-Jimenez R, Liu R, Roca-Cusachs P, Fernandez JM, Sheetz MP. Science. 2009;323(5914):638–41. doi: 10.1126/science.1162912. [DOI] [PMC free article] [PubMed] [Google Scholar]
- 19.Hytonen VP, Vogel V. PLoS Comput Biol. 2008;4(2):e24. doi: 10.1371/journal.pcbi.0040024. [DOI] [PMC free article] [PubMed] [Google Scholar]
- 20.Lee SE, Chunsrivirot S, Kamm RD, Mofrad MR. Biophys J. 2008;95(4):2027–36. doi: 10.1529/biophysj.107.124487. [DOI] [PMC free article] [PubMed] [Google Scholar]
- 21.Austen K, Ringer P, Mehlich A, Chrostek-Grashoff A, Kluger C, Klingner C, Sabass B, Zent R, Rief M, Grashoff C. Nat Cell Biol. 2015;17:1597. doi: 10.1038/ncb3268. [DOI] [PMC free article] [PubMed] [Google Scholar]
- 22.Dumbauld DW, Lee TT, Singh A, Scrimgeour J, Gersbach CA, Zamir EA, Fu J, Chen CS, Curtis JE, Craig SW, Garcia AJ. Proc Natl Acad Sci U S A. 2013;110(24):9788–93. doi: 10.1073/pnas.1216209110. [DOI] [PMC free article] [PubMed] [Google Scholar]
- 23.Coll JL, Ben-Ze’ev A, Ezzell RM, Rodriguez Fernandez JL, Baribault H, Oshima RG, Adamson ED. Proc Natl Acad Sci U S A. 1995;92(20):9161–5. doi: 10.1073/pnas.92.20.9161. [DOI] [PMC free article] [PubMed] [Google Scholar]
- 24.Saunders RM, Holt MR, Jennings L, Sutton DH, Barsukov IL, Bobkov A, Liddington RC, Adamson EA, Dunn GA, Critchley DR. Eur J Cell Biol. 2006;85(6):487–500. doi: 10.1016/j.ejcb.2006.01.014. [DOI] [PubMed] [Google Scholar]
- 25.Xu W, Coll JL, Adamson ED. J Cell Sci. 1998;111(11):1535–44. doi: 10.1242/jcs.111.11.1535. [DOI] [PubMed] [Google Scholar]
- 26.Yan J, Yao M, Goult BT, Sheetz MP. Cell Mol Bioeng. 2015;8(1):151–159. doi: 10.1007/s12195-014-0364-5. [DOI] [PMC free article] [PubMed] [Google Scholar]
Associated Data
This section collects any data citations, data availability statements, or supplementary materials included in this article.