

Abstract
Background
In Dec 2014, a new Kidney transplant Allocation System (KAS) was implemented nationwide with the goal of improving longevity matching, increasing access to sensitized patients and improving racial/ethnic disparities.
Study Design
National cohort study of U.S. kidney transplant (KTX) programs, analyzing hospital-level outcomes (Oct 2012 to June 2016) using UHC data. In-hospital outcomes and costs were analyzed for trends over time using interrupted time series analysis with segmented regression.
Results
38,016 KTX procedures were analyzed during the 3.8 year period. Over time, there was an average increase of 2.7 cases/month (95% CI −0.02 to 5.4; p=0.059), unaffected by KAS (18.9 case increase, p=0.5601). Implementation of KAS led to significant changes in patient demographics, including a decrease in age (−2.8 years, p<0.001), increase in African-Americans (3.8%, p<0.001), decrease in Caucasians (6.0%, p<0.001), increase in Hispanics (2.9%, p<0.001), increase in CHF (1.3%, p<0.001) and decrease in diabetes with complications (4.0%, p<0.001). KAS had no impact on LOS (0.12 days, 95% CI −0.11 to 0.35), LOS index (0.01, 95% CI −0.03 to 0.05), ICU cases, ICU LOS, patient safety indicators or in-hospital mortality. KAS led to a significant increase in DGF rates (5.4%, 95% CI 23.3% to 7.4%), total in-hospital costs ($2,429, 95% CI $594 to $4.263) and 7 (2.2%), 14 (2.6%), and 30-day (2.7%). readmissions.
Conclusion
Policy changes in organ allocation can have a significant impact on peri-operative costs and outcomes, which may have a downstream influence on transplant center peri-surgical care processes.
INTRODUCTION
In 1984, the US Congress passed the National Organ Transplant Act (NOTA). Among other components of the law, NOTA authorizes the Department of Health and Human Services to fund the infrastructure needed for the regulation of deceased donor organ allocation across the US. A key part of organ allocation dictated within NOTA is that it should be conducted in an ethical manner, minimizing disparities in access to transplants. As such, organ allocation policies and procedures, which are described within Title I of the law (Organ Procurement and Transplantation Network [OPTN]), are routinely reviewed to ensure equity. Since its inception in 1984, the OPTN has been under contract to be managed by the United Network of Organ Sharing (UNOS).(1–3)
Over the past 30+ years, UNOS has continuously reviewed organ allocation measures to ensure equity and adjusted allocation policies when significant disparities are apparent. A major change in the policy, entitled the kidney allocation system (KAS), began in 2002 and was finally implemented on December 4, 2014. Key goals of KAS were to eliminate or minimize age mismatching (organs from young donors being allocated to older recipients), increase access to potential recipients that are highly sensitized to HLA antigens (panel reactive antibody [PRA] 99–100%) and improve access to disadvantaged minorities, particularly the African-American population.(2, 4–8)
The modifications made to the organ allocation rules substantially changed the order for a large proportion of the recipient wait list.(8) A recent study conducted by investigators within UNOS demonstrated significant changes in those that have received organ transplants after KAS was implemented. However, the impact of KAS on peri-operative outcomes and costs has not been analyzed.(6) Thus, the aim of this study was to determine how KAS and the months following KAS have influenced peri-operative quality and costs amongst US kidney transplant programs. The study hypothesis was that KAS has led to significantly increased peri-operative LOS, complications, readmissions and costs.
METHODS
Study Design
This was a time series analysis, assessing peri-operative demographics, outcomes and costs for kidney transplant recipients and the temporal trends that occurred in relation with the implementation of KAS. In 2013, the Organ Procurement and Transplant Network (OPTN) Board of Directors approved KAS and on December 4th, 2014, it went into effect. The intent of KAS is to optimize the utilization of kidneys while also improving the equitable distribution of these organs. Major changes with KAS include giving patients that are highly sensitized greater priority on the wait list, matching donor organ quality (kidney donor profile index [KDPI]) with the life expectancy of recipients (expected post-transplant survival [EPTS]) and counting wait time at the start of dialysis.(8)
Patients
Kidney transplant recipients were eligible for inclusion in this study if they were transplanted between Oct 1, 2012 and June 30, 2016 at a University HealthSystem Consortium (UHC, now part of Vizient™) member institution; which embodies 99 of the 236 kidney transplant centers (42%) across the US and approximately 60% of all kidney transplants conducted during this time frame with the U.S.(9–11) Exclusions were pediatrics (<18 years of age at time of transplant) and recipients of non-renal transplants (liver, pancreas, heart or lung); either simultaneous or a previous history of a non-renal transplant.
Study Variables and Outcomes
Demographic variables of interest included patient age, sex, race, comorbidities and severity of illness, as measured by the UHC calculated risk of mortality (graded as minor, moderate or major) and case mix index. Per-operative outcomes of interest included length of stay (LOS), observed to expected LOS (LOS index), intensive care unit (ICU) cases, ICU LOS, in-hospital complications, in-hospital morality, observed to expected mortality (mortality index), 7, 14 and 30 day readmissions to the index hospital and delayed graft function. Because data in the UHC system only includes hospitalization information, DGF was defined as the need for dialysis during the initial inpatient stay for the kidney transplant procedure.(9)
Cost Analysis
Peri-operative costs were also assessed, which were determined through UHC reported total and direct costs for the transplant procedure and subsequent hospitalization. Costs were further classified as organ procurement, surgical, pharmacy accommodations, laboratory, transfusion, medical/surgical supplies and imaging. Expected LOS, mortality and costs are projected by UHC using regression modeling calculated separately for each MS-DRG. Inhospital complications was a composite definition of the mean percentage of in-hospital complications occurring in the study group and were determined through UHC using diagnostic codes and an algorithm for each complication.
Statistical Analysis
Descriptive statistics were utilized for display of the data and included means, standard deviations, 95% confidence intervals (CIs) and percentages. Comparative analyses were conducted using both before and after and interrupted time series assessments. For the before and after assessment, cohorts were divided based on transplant date (Pre-KAS: Oct 2012 to Nov 2014 and Post-KAS: Dec 2014 to June 2016). Statistical comparisons were conducted using the chi square test and t-test for the before and after analysis. An interrupted time series analysis was also conducted using segmented regression. This was done by aggregating variables of interest by month, creating KAS and months post-KAS terms and modeling the variable of interest (demographics or peri-operative outcomes/costs) as the dependent variable with time, KAS and months post-KAS terms as the independent variables. Segmented regression (Proc Autoreg) is considered a robust method to estimate the impact of policy on outcomes because it adjusts for secular trends in time, including inflation for costs, and accounts for the correlation across time as well.(12–14) All analyses were conducted using SAS version 9.4 (SAS Institute, Cary, NC). A two-sided p-value of <0.05 was considered significant.
RESULTS
Between Oct 2012 and June 2016 a total of 38,016 adult solitary kidney transplants from UHC centers were identified and included in this analysis. The mean age of the cohort was 51.3 years, which decreased by approximately 1.0 year after KAS (51.7 vs. 50.7 yrs of age, p<0.001). KAS implementation led to immediate and significant changes in recipient demographics, including a higher proportion of females, African-Americans and Hispanics; with a compensatory decrease in Caucasians. After KAS, kidney transplant recipients also tended to be a higher risk cohort, with more comorbidities (CHF, diabetes, coagulopathy, obesity and rheumatic, collagen or vascular disorders). This was reflected as a higher case mix index and more patients being rated at major risk of mortality at admission in the Post-KAS era (Table 1). The interrupted time series analysis demonstrated similar findings, as KAS significantly influenced recipient race/ethnicity (Figure 1). Interestingly, after the initial bolus impact of KAS, there has been an incremental increase in Caucasians (0.3% increase per month, p<0.001) and decrease in African-Americans and other races/ethnicities. This is displayed in the regressed slopes of the data in Figure 1 after KAS implementation.
Table 1.
Baseline Characteristics Stratified by Pre- and Post-Kidney Transplant Allocation System
| Baseline characteristic | Pre-KAS (N=21,450) | Post-KAS (n=16,566) | p Value |
|---|---|---|---|
| Age, y, mean±SD | 51.7±12.9 | 50.7±13.1 | <0.001 |
| Sex, % | |||
| Female | 38.8 | 39.8 | 0.041 |
| Male | 61.2 | 60.2 | |
| Race/ethnicity, % | |||
| Caucasian | 50.8 | 46.2 | <0.001 |
| African-American | 25.4 | 29.0 | <0.001 |
| Hispanic | 8.7 | 12.2 | <0.001 |
| Asian | 5.5 | 5.5 | 0.885 |
| Other/unknown | 9.6 | 7.1 | <0.001 |
| Comorbidities, % | |||
| Congestive heart failure | 5.5 | 6.7 | <0.001 |
| Chronic pulmonary disease | 7.3 | 7.6 | 0.369 |
| Depression | 7.4 | 7.4 | 0.860 |
| Diabetes with complications | 18.7 | 20.5 | <0.001 |
| Diabetes without complications | 6.6 | 5.7 | 0.005 |
| Coagulopathy | 3.4 | 4.3 | <0.001 |
| Obesity | 15.5 | 17.3 | <0.001 |
| Peripheral vascular disease | 5.8 | 6.1 | 0.277 |
| Rheumatic/collagen/vascular disease | 4.2 | 5.0 | <0.001 |
| Risk of mortality at admission, % | |||
| Minor | 32.9 | 31.3 | 0.001 |
| Moderate | 60.2% | 62.1 | 0.750 |
| Major | 4.9% | 6.6% | <0.001 |
| Case Mix Index, mean±SD | 3.22±0.04 | 3.24±0.04 | <0.001 |
KAS, kidney transplant allocation system
Figure 1.

Estimated impact (using segmented regression) of kidney transplant allocation system (KAS) on race and ethnicity composition for adult kidney transplant recipients over time. The dotted vertical line represents when KAS was implemented across the US; the dots represent data points and the horizontal dotted lines represent regression estimates.
In the before and after analysis, KAS had a significant impact on a number of peri-operative outcomes, including a higher proportion of ICU cases, longer ICU LOS, higher mortality index and more DGF (Table 2). In the interrupted time series analysis, KAS had an immediate impact on increasing 7, 14 and 30-day readmissions by 2.2 to 2.7% (95% CI 1.2 to 4.2%) and increasing DGF by 5.4% (95% CI 3.3 to 7.4%). After this initial impact, in the time post-KAS era, readmissions (−0.13 to 0.28% per month) and DGF rates (−0.18% per month) have both decreased significantly (Table 3 and Figure 2). In the interrupted time series analysis, KAS did not impact LOS, LOS index, ICU cases, complications or mortality.
Table 2.
Perioperative Outcomes Compared Pre- and Post-KAS
| Outcomes | Pre-KAS (N=21,450) | Post-KAS (N=16,566) | p Value |
|---|---|---|---|
| Length of stay, d, mean±SD | 6.4±5.4 | 6.3±5.6 | 0.080 |
| Length of stay index, observed-to-expected, mean±SD | 1.06±0.04 | 1.04±0.03 | <0.001 |
| ICU cases, % | 23.6 | 25.5 | <0.001 |
| ICU length of stay, d, mean±SD | 2.5±0.2 | 2.6±0.3 | <0.001 |
| In-hospital complications, % | 6.0 | 3.9 | <0.001 |
| In-hospital mortality, % | 0.3 | 0.3 | 0.951 |
| Mortality index, mean±SD | 0.79±0.40 | 0.92±0.48 | <0.001 |
| Readmissions, % | |||
| 7-day | 5.7 | 5.4 | 0.208 |
| 14-day | 9.3 | 8.9 | 0.176 |
| 30-day | 12.9 | 12.3 | 0.082 |
| Delayed graft function | 25.8 | 28.0 | <0.001 |
KAS, kidney transplant allocation system
Table 3.
Independent Impact of KAS on Perioperative Outcomes (Adjusted for Time) Using Interrupted Time Series Analysis
| Outcomes | Independent impact of KAS (95% CI) | Post-KAS trend per month (95% CI) |
|---|---|---|
| Length of stay, d, mean (95% CI) | 0.12 (−0.11,0.35) | 0.01 (−0.01, 0.03) |
| Length of stay index, observed- to-expected ratio (95% CI) | 0.01 (−0.03, 0.05) | 0.004 (0.001, 0.007)* |
| ICU cases, % (95% CI) | −0.30 (−2.7, 2.0) | −0.27 (−0.50, −0.10)* |
| ICU length of stay, mean (95% CI) | −0.08 (−0.23, 0.39) | 0.02 (−0.002, 0.05) |
| In-hospital complications, % (95% CI) | −0.22 (−1.2, 0.70) | −0.05 (−0.1, 0.01) |
| In-hospital mortality,%, (95% CI) | 0.08 (−0.001, 0.20) | −0.01 (−0.001, 0.001) |
| Mortality index | 0.23 (−0.12, 0.58) | −0.02 (−0.05, 0.01) |
| Readmissions, % (95% CI)* | ||
| 7-day | 2.2 (1.4, 2.9) | −0.13 (−0.20, −0.10) |
| 14-day | 2.6 (1.6, 3.6) | −0.20 (−0.30, −0.10) |
| 30-day | 2.7 (1.2, 4.2) | −0.28 (−0.40, −0.20) |
| Delayed graft function, %, (95% CI)* | 5.4 (3.3, 7.4) | −0.18 (−0.30, −0.01) |
p<0.05
KAS, kidney transplant allocation system
Figure 2.

Estimated impact (using segmented regression) of kidney transplant allocation system (KAS) on delayed graft function (DGF) and readmissions for adult kidney transplant recipients over time. The dotted vertical line represents when KAS was implemented across the US; the dots represent data points and the horizontal dotted lines represent regression estimates. DGF, delayed graft function.
The impact of KAS on peri-operative costs is displayed in Table 4 (before and after analysis) and Figure 3 (interrupted time series analysis). In the before and after assessment, KAS led to significant increases in total costs ($9,259 per case, p<0.001), direct costs ($6,603 per case, p<0.001), cost index (0.10, p<0.001) and all of the costs categories, particularly organ procurement ($4,563, p<0.001), surgery ($458, p<0.001) and pharmacy ($653, p<0.001). The interrupted time series analysis, which accounted for the secular trends in time and inflation, demonstrated similar findings with regards to an increase in total costs ($2,429, 95% CI $594 to $4,264), direct costs ($1,783, 95% CI $470 to $3,096) and organ procurement costs ($808, 95% CI $23 to $1,593).
Table 4.
Perioperative Costs Compared Pre- and Post-KAS
| Costs | Pre-KAS (N=21,450) | Post-KAS (n=16,566) | p-Value |
|---|---|---|---|
| Total costs, $, mean±SD | 97,244±2,561 | 106,503±2,359 | <0.001 |
| Total direct costs, $, mean±SD | 69,731±1,751 | 76,334±1,759 | <0.001 |
| Direct costs index, mean±SD | 1.00±0.02 | 1.10±0.03 | <0.001 |
| Category, $, mean±SD | |||
| Organ procurement | 52,883±1,273 | 57,446±1,565 | <0.001 |
| Surgical | 3,914±155 | 4,372±118 | <0.001 |
| Pharmacy | 5,301±311 | 5,954±250 | <0.001 |
| Accommodations | 4,330±189 | 4,708±180 | <0.001 |
| Laboratory | 1,152±44 | 1,214±44 | <0.001 |
| Transfusion | 1,083±143 | 1,268±156 | <0.001 |
| Med/surgical supplies | 1,266±62 | 1,329±74 | <0.001 |
| Imaging | 275±15 | 286±10 | <0.001 |
KAS, kidney transplant allocation system
Figure 3.
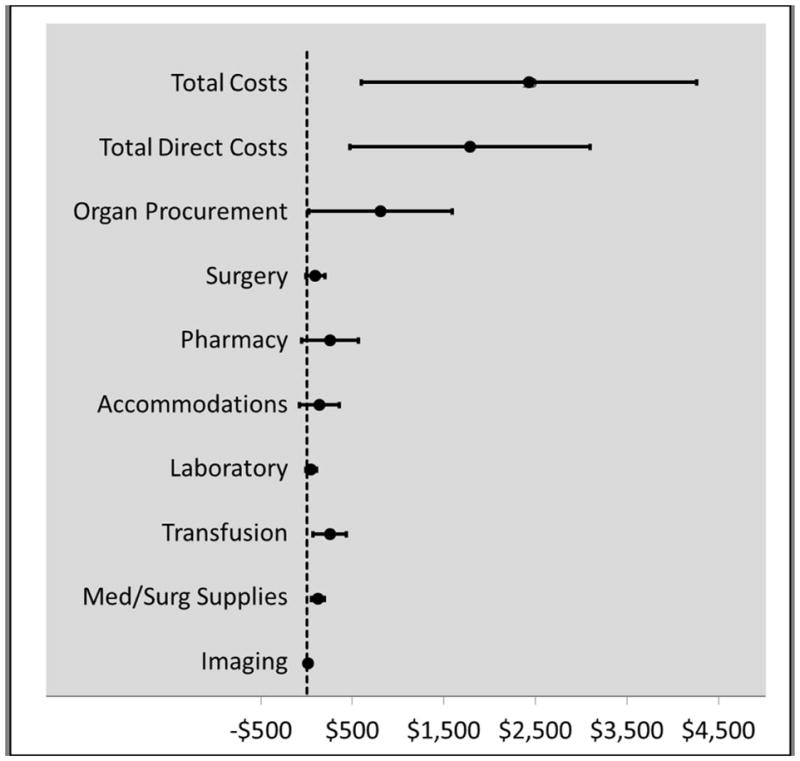
Estimated impact (using segmented regression) of kidney transplant allocation system on costs for adult kidney transplant recipients.
DISCUSSION
The results of this analysis demonstrate that the organ allocation policy transformation that occurred through KAS implementations has led to significant and continued changes to kidney transplant peri-operative costs and a bolus impact on recipient demographics and clinical outcomes. Specifically, KAS led to substantially increased in-hospital costs, particularly those related to organ procurement. KAS also led to a substantial increase in African-Americans and Hispanics receiving transplants, a compensatory decrease in Caucasian transplant recipients and a significant increase in comorbid conditions and recipient risk. Finally, KAS led to significantly higher rates of DGF and increased 7, 14 and 30 day readmissions. These findings highlight the impact policy changes can make on peri-operative costs and outcomes and suggest that policy makers should consider these potential issues when modeling the impact of policy change.
As detailed in a recent analysis, for the most part, KAS has met its intended short-term goals. It has reduced disparities based on race and ethnicity by increasing access to transplant for historically disadvantaged minority populations, including African-Americans and Hispanics. It also substantially decreased graft and recipient longevity matching by giving the youngest donor organs to the younger recipients. Finally, KAS has increased the likelihood that highly sensitized recipients (PRA 99–100%) would receive transplants; this is important, as these patients tend to have exceedingly long wait times.(6) These findings are not in question, although the sustainability of KAS on reducing disparities, particularly within minority populations, is yet to be known. In fact, the interrupted time series assessment conducted within this analysis demonstrates that after an initial bolus effect on race/ethnicity, the transplant rates across different racial and ethnic groups appears to be regressing back towards pre-KAS numbers; post-KAS proportions of Caucasians are significantly increasing, while those in African Americans are decreasing. It has yet to be determined whether these trends will continue to the point of becoming similar to pre-KAS proportions. Clearly, further scrutiny into accumulating data is warranted in this regard.
The impact of KAS on improving organ utility through age matching has been demonstrated. It is interesting to note, however, that the general transplant population has seen an increase in comorbidities as a result of KAS. This may be related to the fact that KAS changed how wait time on the list calculated, and directly after its implementation, a large number of patients with significant time on dialysis received transplants. These patients, with substantial dialysis vintage, likely accumulated significant comorbidities during this time.(15–17) It will be interesting to note if these trends continue in the long-term; while also assessing if the improvements in organ utility through age matching are offset by the increases seen in comorbidities and increase mortality risk within the general recipient pool.
Given how KAS has altered the patient population and increased organ cold ischemic times, it is not surprising that KAS has also had a significant impact on peri-operative outcomes and costs.(6) With the shift of recipient demography towards a population with more comorbidities, it is likely that these patients have significant reduced functional status and reserves. Previous studies have demonstrated these factors greatly influence outcomes, particularly short-term peri-operative complications.(18–21) Within this analysis, this is likely reflected by increased 7, 14 and 30-day readmission rates. A bolus effect is seen with KAS implementation on these metrics. It is interesting to note that after this bolus, post-KAS readmission rates actually decrease at a substantial rate. This may be a reflection of the limited impact of patient demography or concerted efforts by transplant programs to adjust care models to account for these higher risk recipients.(22, 23)
The impact of KAS on DGF is one of the more important findings of this analysis. This is likely a direct impact of increased cold ischemic times. DGF is a well-studied and known risk factor for increased peri-operative costs, complications and long-term patient and graft survival.(24–26) Thus, by KAS increasing the relative risk of DGF by more than 20%, it will be important to determine the true impact of this on long-term outcomes. Clearly, future studies are needed to adequately assess this issue. It is somewhat reassuring to see from this data that after the initial bolus effect of KAS on DGF, the rates have actually significant decreased by approximately 0.25% per month, such that as of June 2016, DGF rates are close to where they were prior to KAS implementation, in Dec 2014.(6)
As kidney transplantation is predominantly based around a DRG reimbursement system, the impact of KAS on costs has important implications for transplant center finances.(27) It is unclear whether policy makers considered the cost impact of KAS prior to implementation. Either way, it appears that in-hospital costs significantly increased after KAS. Given the razor thin margins kidney transplant centers already experience, KAS may have put a substantial number of these procedures into the negative revenue bucket.(28) Most transplants are billed through Medicare as the primary payer. The results of this analysis cannot determine margins, as reimbursement data is not included within UHC metrics. Future studies, using CMS cost data, are warranted to determine the true impact of KAS on transplant center finances, particularly as it relates to organ allocation costs and center margins.(28, 29) This would serve as an important study to help policy makers understand the cost implications of organ allocation changes for future consideration. It is also important to note that this cost analysis does not include resources. Given the increased complexities associated with organ allocation that occurred as a result of KAS, it is likely that there have been substantial increases in time spent by the organ procurement organizations (OPOs), nurse coordinators, HLA laboratories and physicians.(30) There is also a lack of analysis that specifically assesses the impact of KAS on kidneys lost due to transportation and logistic misadventures.(3, 6, 8)
In terms of methodology, by using both a before and after and interrupted time series analysis, this study provide interesting insights into differences in outcomes. Before and after analyses aggregate data into two groups and compare means or proportions across these two cohorts. By doing so, this type of analysis masks the secular trends that naturally occur in health care over time.(13) As an example, in-hospital complications appear to significant decrease (from 6.0% to 3.9%, p<0.001) using the before and after analysis. Yet, within the interrupted time series analysis, the impact of KAS on complications was negligible (0.22% decrease, 95% CI -1.2–0.70%). This contrast in results is a direct reflection that the interrupted time series (using monthly increments), measures and accounts for the fact that in-hospital complications were actually decreasing at a significant rate during the entire time period studied, both before and after KAS. Similar differences were also noted for LOS index, ICU cases, ICU LOS and mortality index, where the before and after analysis demonstrated significant differences pre and post-KAS, while the interrupted time series assessment did not. These findings demonstrate researchers need to be cautious with their interpretation of before and after analyses without accounting for the natural trends in data that occur over time.(12–14) This is also quite important when assessing cost data, as health care inflation rates are substantial and can dramatically influence these analyses.(31)
There are a number of limitations with this analysis worthy of discussion. First, these data were aggregated at the center-level in monthly intervals. Thus, patient-level data was available or utilized for this analysis. Patient risk was not adjusted for in modeling; although studies demonstrate interrupted time series analysis provide robust estimates that are not generally influences by confounding at the patient-level.(13) However, center-level changes in care that occurred at a similar time period as KAS implementation may be mistakenly classified as being caused by KAS. At a single-center, this is a potential problem. At a national-level, such as this analysis conducted, it is unlikely that dramatic changes occurred at most transplant centers at the same time as KAS in a sufficient manner to bias these estimates. Another limitation is the fact these are administrative data and only include the index hospitalization and readmissions to the transplant center. Inaccurate coding and readmissions to non-transplant center hospitals may impact these findings. It is also important to note that coding changed from ICD-9 to ICD-10 during this time period. Every effort was made to account for this during data acquisition and clean up, but the transition in ICD codes was substantial and this may have led to some inaccuracies in coded data.
CONCLUSIONS
Kidney transplant organ allocation policy changes that occurred in Dec 2014 led to significant changes in recipient demographics, increasing the proportions of African-Americans, Hispanics and those with more comorbid conditions. KAS also likely increased rates of DGF, early hospital readmissions and in-hospital costs. Changes in policies that govern organ allocation can have a substantial impact on peri-operative value metrics and policy makers should consider modeling these effects as part of their evaluation process.
Acknowledgments
Support: This study was supported by NIH NIDDK grant number K23DK099440.
Footnotes
Disclosure Information: Nothing to disclose.
Presented at the Southern Surgical Association 128th Annual Meeting, Palm Beach, FL, December 2016.
Disclosures outside the scope of this work: Dr Taber receives research support to conduct clinical trials from Astellas, Veloxis, and Novartis Pharmaceuticals. Dr Chavin receives grant support to conduct clinical trials from Gilead, Novartis, and Astellas Pharmaceuticals.
Publisher's Disclaimer: This is a PDF file of an unedited manuscript that has been accepted for publication. As a service to our customers we are providing this early version of the manuscript. The manuscript will undergo copyediting, typesetting, and review of the resulting proof before it is published in its final citable form. Please note that during the production process errors may be discovered which could affect the content, and all legal disclaimers that apply to the journal pertain.
References
- 1.Organ Procurement and Transplantation Network [homepage on the Internet] 2016 Available from: https://optn.transplant.hrsa.gov.
- 2.Formica RN, Jr, Friedewald JJ, Aeder M. Changing the kidney allocation system: A 20-year history. Curr Transplant Rep. 2016;3(1):39–44. [Google Scholar]
- 3.Stegall MD, Stock PG, Andreoni K, et al. Why do we have the kidney allocation system we have today? A history of the 2014 kidney allocation system. Hum Immunol. 2016 doi: 10.1016/j.humimm.2016.08.008. [DOI] [PubMed] [Google Scholar]
- 4.Leffell MS, Zachary AA. The national impact of the 1995 changes to the UNOS renal allocation system. Clin Transplant. 1999;13(4):287–95. doi: 10.1034/j.1399-0012.1999.130402.x. [DOI] [PubMed] [Google Scholar]
- 5.Neylan JF, Sayegh MH, Coffman TM, et al. The allocation of cadaver kidneys for transplantation in the united states: Consensus and controversy. ASN transplant advisory group. american society of nephrology. J Am Soc Nephrol. 1999 Oct;10(10):2237–43. doi: 10.1681/ASN.V10102237. [DOI] [PubMed] [Google Scholar]
- 6.Stewart D, Kucheryavaya A, Klassen D, et al. Changes in deceased donor kidney transplantation one year after KAS implementation. American Journal of Transplantation. 2016;16(6):1834–47. doi: 10.1111/ajt.13770. [DOI] [PubMed] [Google Scholar]
- 7.Guo TJ, Daily OP, Davies DB. The UNOS OPTN waiting list: 1988 to 1994. united network for organ sharing. organ procurement and transplantation network. Clin Transpl. 1994:69–86. [PubMed] [Google Scholar]
- 8.Stegall MD. Developing a new kidney allocation policy: The rationale for including life years from transplant. American Journal of Transplantation. 2009;9(7):1528–32. doi: 10.1111/j.1600-6143.2009.02712.x. [DOI] [PubMed] [Google Scholar]
- 9.Scientific Registry of Transplant Recipients (SRTR) [homepage on the Internet] 2012 Available from: http://www.srtr.org.
- 10.Organ Procurement and Transplantation Network (OPTN) [homepage on the Internet] 2012 Available from: http://optn.transplant.hrsa.gov/latestData/rptData.asp.
- 11.University Healthcare Consortium [homepage on the Internet] Available from: www.uhc.edu.
- 12.Penfold RB, Zhang F. Use of interrupted time series analysis in evaluating health care quality improvements. Academic pediatrics. 2013;13(6):S38–44. doi: 10.1016/j.acap.2013.08.002. [DOI] [PubMed] [Google Scholar]
- 13.Wagner AK, Soumerai SB, Zhang F, Ross-Degnan D. Segmented regression analysis of interrupted time series studies in medication use research. J Clin Pharm Ther. 2002;27(4):299–309. doi: 10.1046/j.1365-2710.2002.00430.x. [DOI] [PubMed] [Google Scholar]
- 14.Matowe LK, Leister CA, Crivera C, Korth-Bradley JM. Interrupted time series analysis in clinical research. Ann Pharmacother. 2003 Jul-Aug;37(7–8):1110–6. doi: 10.1345/aph.1A109. [DOI] [PubMed] [Google Scholar]
- 15.Chertow GM, Johansen KL, Lew N, et al. Vintage, nutritional status, and survival in hemodialysis patients. Kidney Int. 2000;57(3):1176–81. doi: 10.1046/j.1523-1755.2000.00945.x. [DOI] [PubMed] [Google Scholar]
- 16.Gill JS, Tonelli M, Johnson N, et al. The impact of waiting time and comorbid conditions on the survival benefit of kidney transplantation. Kidney Int. 2005;68(5):2345–51. doi: 10.1111/j.1523-1755.2005.00696.x. [DOI] [PubMed] [Google Scholar]
- 17.Merkus MP, Jager KJ, Dekker FW, et al. Quality of life over time in dialysis: The netherlands cooperative study on the adequacy of dialysis. Kidney Int. 1999;56(2):720–8. doi: 10.1046/j.1523-1755.1999.00563.x. [DOI] [PubMed] [Google Scholar]
- 18.Garonzik-Wang JM, Govindan P, Grinnan JW, et al. Frailty and delayed graft function in kidney transplant recipients. Archives of surgery. 2012;147(2):190–3. doi: 10.1001/archsurg.2011.1229. [DOI] [PubMed] [Google Scholar]
- 19.Reese PP, Shults J, Bloom RD, et al. Functional status, time to transplantation, and survival benefit of kidney transplantation among wait-listed candidates. American Journal of Kidney Diseases. 2015;66(5):837–45. doi: 10.1053/j.ajkd.2015.05.015. [DOI] [PMC free article] [PubMed] [Google Scholar]
- 20.Reese PP, Bloom RD, Shults J, et al. Functional status and survival after kidney transplantation. Transplantation. 2014 Jan 27;97(2):189–95. doi: 10.1097/TP.0b013e3182a89338. [DOI] [PMC free article] [PubMed] [Google Scholar]
- 21.Stuck AE, Walthert JM, Nikolaus T, et al. Risk factors for functional status decline in community-living elderly people: A systematic literature review. Soc Sci Med. 1999;48(4):445–69. doi: 10.1016/s0277-9536(98)00370-0. [DOI] [PubMed] [Google Scholar]
- 22.Taber DJ, Pilch NA, McGillicuddy JW, et al. Improved patient safety and outcomes with a comprehensive interdisciplinary improvement initiative in kidney transplant recipients. Am J Med Qual. 2013 Mar-Apr;28(2):103–12. doi: 10.1177/1062860612450309. [DOI] [PubMed] [Google Scholar]
- 23.Taber DJ, Pilch NA, McGillicuddy JW, et al. Improving the perioperative value of care for vulnerable kidney transplant recipients. J Am Coll Surg. 2013 Apr;216(4):668, 76. doi: 10.1016/j.jamcollsurg.2012.12.023. discussion 676–8. [DOI] [PubMed] [Google Scholar]
- 24.Butala NM, Reese PP, Doshi MD, Parikh CR. Is delayed graft function causally associated with long-term outcomes after kidney transplantation? instrumental variable analysis. Transplantation. 2013 Apr 27;95(8):1008–14. doi: 10.1097/TP.0b013e3182855544. [DOI] [PMC free article] [PubMed] [Google Scholar]
- 25.Siedlecki A, Irish W, Brennan DC. Delayed graft function in the kidney transplant. Am J Transplant. 2011;11(11):2279–96. doi: 10.1111/j.1600-6143.2011.03754.x. [DOI] [PMC free article] [PubMed] [Google Scholar]
- 26.Yarlagadda SG, Coca SG, Formica RN, et al. Association between delayed graft function and allograft and patient survival: A systematic review and meta-analysis. Nephrol Dial Transplant. 2009 Mar;24(3):1039–47. doi: 10.1093/ndt/gfn667. [DOI] [PubMed] [Google Scholar]
- 27.Machnicki G, Lentine KL, Salvalaggio PR, et al. Kidney transplant medicare payments and length of stay: Associations with comorbidities and organ quality. Arch Med Sci. 2011;7(2):278–86. doi: 10.5114/aoms.2011.22079. [DOI] [PMC free article] [PubMed] [Google Scholar]
- 28.Englesbe MJ, Ads Y, Cohn JA, et al. The effects of donor and recipient practices on transplant center finances. American Journal of Transplantation. 2008;8(3):586–92. doi: 10.1111/j.1600-6143.2007.02098.x. [DOI] [PubMed] [Google Scholar]
- 29.Axelrod DA. Economic and financial outcomes in transplantation: Whose dime is it anyway? Curr Opin Organ Transplant. 2013 Apr;18(2):222–8. doi: 10.1097/MOT.0b013e32835f0757. [DOI] [PubMed] [Google Scholar]
- 30.Evans RW, Orians CE, Ascher NL. The potential supply of organ donors: An assessment of the efficiency of organ procurement efforts in the united states. JAMA. 1992;267(2):239–46. [PubMed] [Google Scholar]
- 31.Ansari F, Gray K, Nathwani D, et al. Outcomes of an intervention to improve hospital antibiotic prescribing: Interrupted time series with segmented regression analysis. J Antimicrob Chemother. 2003 Nov;52(5):842–8. doi: 10.1093/jac/dkg459. [DOI] [PubMed] [Google Scholar]