Abstract
Tagged Magnetic Resonance Imaging (MRI) is a noninvasive technique for examining myocardial function and deformation. Tagged MRI can also be used in quasi-static MR elastography to acquire strain maps of other biological soft tissues. Harmonic phase (HARP) provides automatic and rapid analysis of tagged MR images for the quantification and visualization of myocardial strain. We propose a new artifact reduction method in strain maps. Image intensity of the DC component is estimated and subtracted from spatial modulation of magnetization (SPAMM) tagged MR images. DC peak interference in harmonic phase extraction is greatly reduced after DC component subtraction. The proposed method is validated using both simulated and MR acquired tagged images. Strain maps are obtained with better accuracy and smoothness after DC component subtraction.
Keywords: Image Processing, Artifacts Reduction, Strain Analysis, Tagged MRI, Medical Image
1 Introduction
Measuring cardiac motion and strain plays an important role in research of heart diseases [1,2]. Tagged MR imaging allows comprehensive and noninvasive assessment of regional myocardial contractile performance. It provides reliable quantification and visualization of cardiac motion and strains. The underlying longitudinal magnetization of soft tissue is spatially modulated to generate parallel tags using spatial modulation of magnetization (SPAMM) technique. The tags are generated at the beginning of each heartbeat. A sequence of images is acquired over many heartbeats in one breath-hold. The application of tagged MR images is not restricted to cardiac imaging. A new imaging method for quasi-static MR elastography using tagged MR imaging was described [3, 4]. Tagged MR images of human lower legs and porcine liver organs have been acquired using this new imaging method. A number of approaches have been proposed to analyze tagged cardiac MR images since the introduction of this imaging technique.
Template Matching [5–8], Active Geometry [9–11], Optical Flow [12–15] and Harmonic Phase (HARP) [16–21] are used in tagged MR image processing. Template matching methods compute the displacement by tracking the tag lines. Optical flow is advantageous over template matching in providing a dense estimation of the motion field instead of a sparse set of data located at the tag lines. However, the optical flow method requires a material point with constant brightness. This requirement can hardly be met due to tag fading in tagged MR images. SinMod method extracts cardiac motion from tagged MR images by modeling the image intensity as a moving sine wave front [22]. The HARP method has been the most widely used method for tagged MR image processing over the last decade.
Strain maps obtained using HARP often suffer from artifacts due to image noise and spectral interference from neighboring spectral peaks. The spectral interference from DC peak is a primary source of artifacts that degrade the performance of HARP. Different image acquisition protocols and post processing techniques have been proposed to reduce the interference. Bandpass filters with different shape and size were designed to optimize the extraction of the harmonic images [23]. Automatic determination of elliptical filter parameters was proposed to minimize strain errors by studying simulated MR tagged images [24]. Calculation of harmonic angle images was improved using a Gabor filter bank [11, 25]. A composite Gabor filter designed by modeling the spectral changes of cardiac tag deformation was proved to be superior to a standard Gabor filter [26]. A peak-combination HARP method reduces phase errors from inhomogeneity and other magnetic field non-idealities [27].
Complementary spatial modulation of magnetization (CSPAMM) was introduced to completely remove the DC peak [28,29]. In CSPAMM, a complementary acquisition is performed and subtracted from the original acquisition to cancel the DC peak. However, the requisite longer acquisition time often results in image misregistration and consequently affects the image quality. Although the DC peak is absent, the harmonic peaks will still interfere with each other. To overcome these problems, TruHARP was proposed to totally remove unwanted harmonic peaks and can be implemented in a single breath-hold [30]. Since five acquisitions are required, the short acquisition time of a single breath-hold often results in a low signal noise ratio (SNR) and constrained tag spacing. Moreover, the challenging extensive MR imaging sequence programming greatly reduces its appearance in practice.
We propose a new artifacts reduction method which is highly efficient and easy to implement. Tagged MR images acquired using SPAMM are processed. The intensity of DC and harmonic components are assumed to be spatially uniform for a specific tagged image. The intensity of DC component is estimated by calculating the mean intensity of the tagged image. The interference from DC peak is reduced by subtracting the estimated DC component from the original tagged MR image. This method is tested using synthetic tagged images both with and without noise.
In addition to acquiring strain maps of the heart, tagged MRI can be used to acquire strain maps of other biological soft tissues in quasi-static MR elastography [4]. A strain map of a phantom obtained during MR elastography is evaluated to validate this method. It is demonstrated that strain maps with good accuracy and smoothness can be obtained after DC component subtraction for both phantom and a human heart.
2 Material and method
Harmonic phase (HARP) provides fast and automatic myocardial motion tracking and strain calculation from tagged MR images. The modulation of underlying magnetization produces symmetric spectral peaks in Fourier space. A band-pass filter is used to extract the harmonic peaks and the rest of the spectrum is zero padded. The harmonic image is obtained by performing the inverse Fourier transform of the filtered harmonic peaks. It can be expressed as
| (1) |
Where y = [y1,y2]T is the position of tissue point within an image, u(y, t) is the displacement field, W is the location of harmonic spectral peak and D(y, t) is the harmonic magnitude image which represents the blurred anatomy of the images object. The strain map is calculated from the harmonic phase image using
| (2) |
Where E(y) is the 2D Lagrangian strain tensor, H matrices related with the tagged and imaging plane, ∅︀(y, t)is the harmonic phase image [18].
The image intensity of a tagged image acquired using a SPAMM pulse sequence is given by
| (3) |
Where y is the location of spatial point at reference time t and w is the sinusoidal tagged modulation frequency. Adc(y, t) and Ahp(y, t) are determined by the imaging parameters. Typically, Adc(y, t) increases with time due to T1 while Ahp(y, t) decreases with time due to tag fading [30,31]. ϕy is the phase shift resulting from tag deformation. The term Adc(y, t) carries no information about the tag deformation and often generates considerable spectral interference to the harmonic peaks.
Tagged MR image analysis has focused primarily on the myocardium of the left ventricle (LV). The magnitude image obtained by performing the inverse Fourier transform of DC peak represents a blurred anatomy of LV. We can observe from this image that the LV is generally a homogeneous region. Based on this fact, we assume that the terms Adc(y, t) and Ahp(y, t) in Eq. (3) have spatially uniform image intensity Adc′ and Ahp′. Since the intensity of the harmonic component Ahp′ is sinusoidally modulated, we can estimate Adc′ by calculating the mean intensity of the tagged image. A spatially uniform estimated DC image is subtracted from the original tagged image prior to the HARP strain analysis. After DC component subtraction, the interference from the DC peak is greatly reduced while all the displacement-encoded phase information is preserved. This method is effective in reducing the strain artifacts due to DC peak interference, and is relatively simple. It is particularly important for elasticity reconstruction in MR elastography based on tagged images.
In our quasi-static MR elastography system [21], we developed a MR-compatible actuation system for tagged MR imaging of soft tissue compression. The electrocardiogram (ECG) signal is simulated and outputted to both the motor controller and MR scanner. MRI k-space data acquisition is synchronized with the simulated ECG signal. Specific k-space segment data is acquired and filled into corresponding images repeatedly after each ECG period. The ultrasonic motor is controlled by microprocessor based controller interfaced with a USB-6221 DAQ device. The control software and signal processing is implemented using Lab View. The motor is controlled to rotate when R peak of simulated ECG is detected and stop after one full rotation. Compression of the actuation device is synchronized with the simulated ECG signal. This ensures the deformation of the imaged object to be consistent during each ECG period.
3 Experiment
This section describes the datasets and experiments for validating the new artifacts reduction method using HARP. The test data comprise simulated tagged images, tagged images of a circular phantom acquired during quasi-static MR elastography, and patient cardiac tagged images.
3.1 Simulated Tagged Images
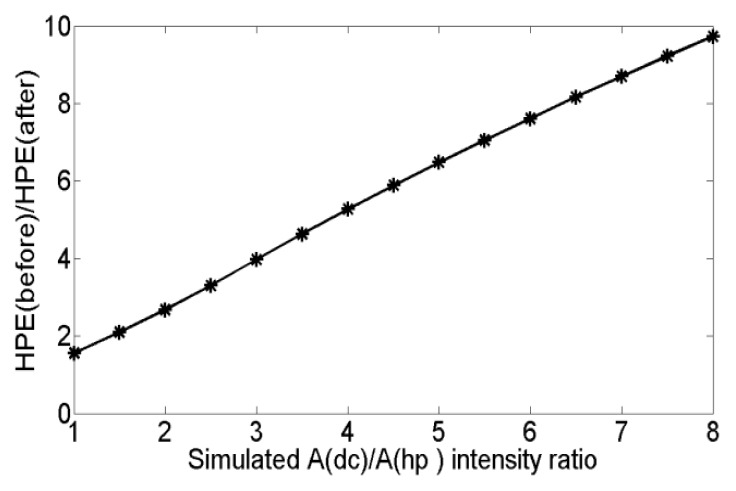
The simulated tagged images are constructed by applying sinusoidal intensity modulation to a digital circular image. The spectral interference from the DC peak is proportional to the intensity ratio Adc/Ahp of the tagged image. Due to the T1 and tag fading effect, Adc/Ahp often raises in practical myocardial MR tagged images resulting in increasing DC peak interference. Therefore, the intensity ratio Adc/Ahp of the simulated image is varied from one to eight to test the phase correction effect under different Adc/Ahp after DC component subtraction. The ratio of the harmonic phase error (HPE) before and after DC component subtraction HPEbefore/HPEafter under different Adc/Ahp ratios is obtained and shown in Fig. 1. It is illustrated that the harmonic phase correction after DC component subtraction plays a more important role when Adc/Ahp is increases.
Figure 1.
Harmonic phase error ratio HPEbefore/HPEafter under different Adc/Ahp before and after DC component subtraction
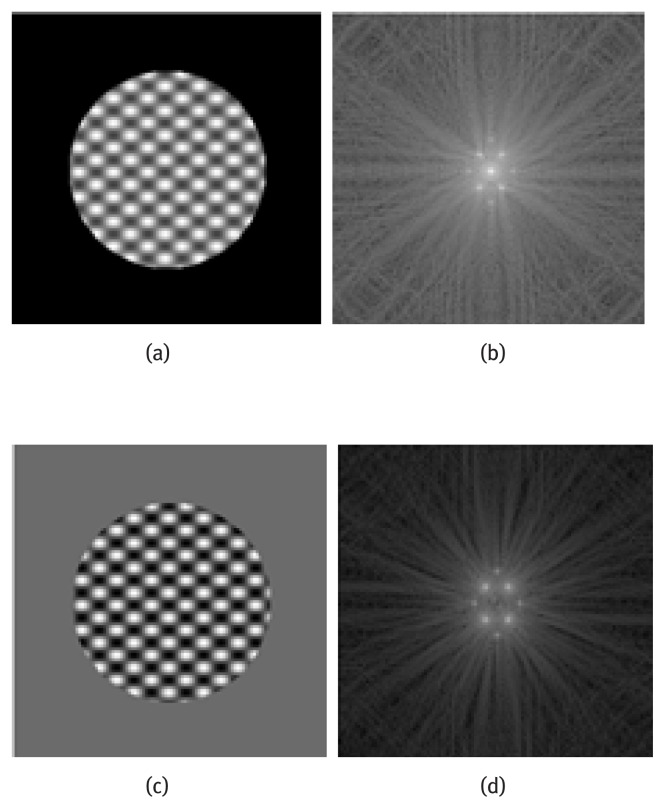
Simulated tagged images with Adc/Ahp = 2.25 and their Fourier transform before and after DC component subtraction are shown in Fig. 2. We observe that the DC peak is significantly reduced after DC component subtraction. The tagged images before and after DC component subtraction are processed to calculate strain maps using HARP. Details of the validation of HARP method was previously published in Fu et al. [3]. A circular band-pass filter with radius chosen at half of the tagged frequency is used to extract the off-center harmonic peak throughout this study. The horizontal and vertical directions in image are represented using the x and y axis respectively. Tagged images with stretch strains of 0.2 and 0.4 in the x direction are simulated and processed.
Figure 2.
(a) Simulated tagged image, (b) Fourier transform of image a, (c) Tagged image after DC component subtraction and (d) Fourier transform of image c.
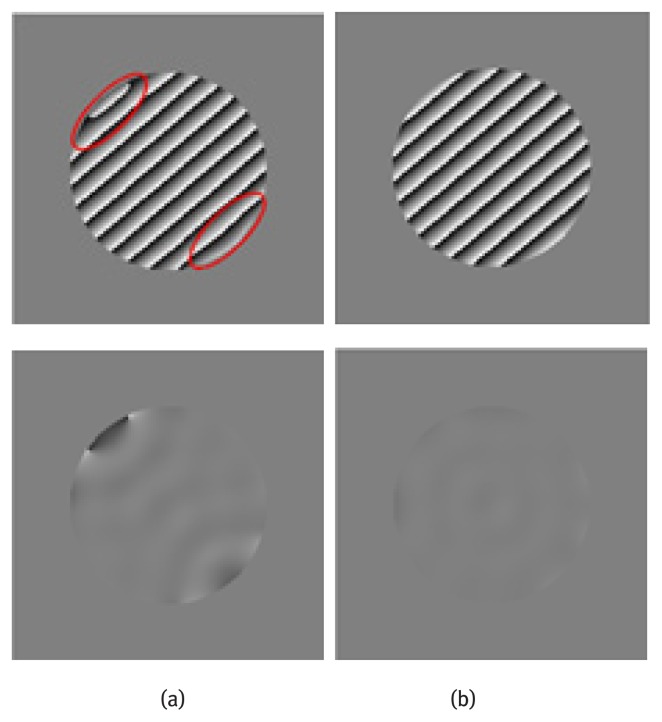
Harmonic phase image calculation is an important step in HARP technique. Motion tracking and strain maps are calculated based on the harmonic phase image. The harmonic phase and phase error images are shown in Fig. 3. Obvious phase distortions are visualized and highlighted in Fig. 3(a). After DC component subtraction, the overall phase value was rectified. Better correspondence between the phase wrapping and the tags is observed.
Figure 3.
Top: Harmonic phase image, Bottom: Harmonic phase error (a) Obtained with original simulated image and (b) Obtained after DC component subtraction. (a) (b)
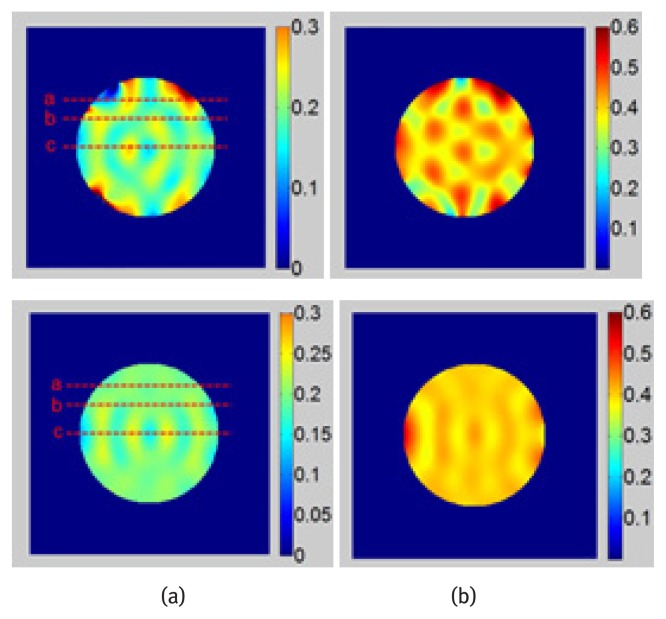
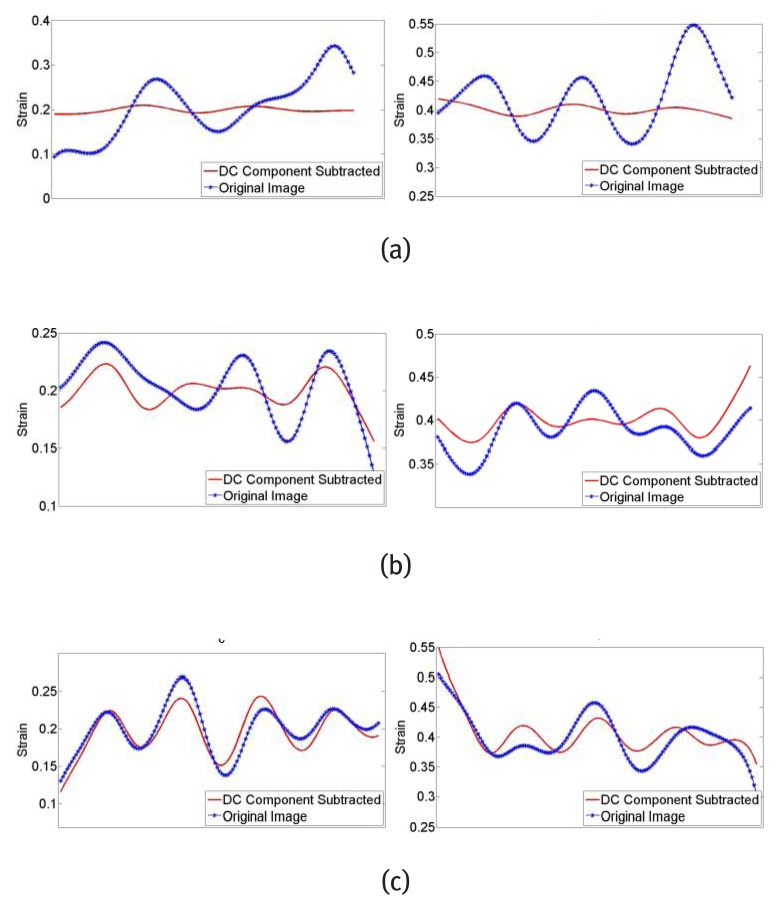
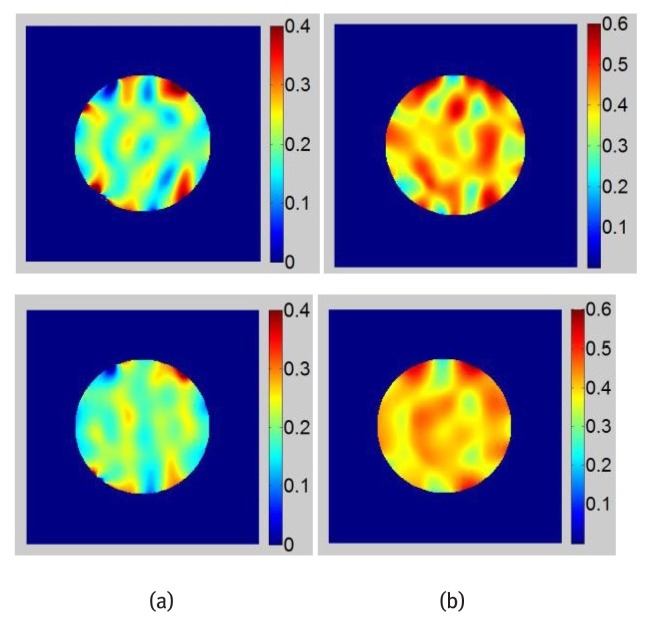
Strain maps obtained before and after DC component subtraction are shown in Fig. 4. Since the spatial derivatives of the harmonic phase image is required to calculate the strain map, the spurious phase from DC spectral interference may lead to significant strain fluctuations. The strain along lines a, b and c in Fig. 4 is plotted and shown in Fig. 5. Due to the location of the harmonic peaks, the border region of the image is more vulnerable to DC peak interference. The improvement of strain along line a is better than that along line b and line c. The fluctuation of strain in strain maps after DC component subtraction is less than that of the original images especially at the borders.
Figure 4.
Top: Strain maps obtained with original image, Bottom: Strain maps obtained after DC component subtraction, (a) EX - 0.2, (b) EX - 0.4.
Figure 5.
Strain plot along line a, b, c shown in Fig. 3(a), Left: EX - 0.2, Right: EX - 0.4.
In practice, tagged images are often contaminated with noise due to magnetic field inhomogeneity and other non-idealities. One hundred percent Gaussian white noise is added to test the sensitivity of the algorithm to noise. Due to the noise, the DC intensity estimation is less accurate than estimation without noise. Although the DC peak is not perfectly suppressed, improvement of strain maps are achieved since the magnitude of the spectral interference is largely reduced. The mean μEx and standard deviation σEx of strain maps are shown in Table 1.
Table 1.
Estimated dc intensity and calculated strains.
| Stretch Strain EX | EX - 0.2 without noise | with noise | EX - 0.4 without noise | with noise |
|---|---|---|---|---|
| Estimated DC intensity (true value: 2.25) | 2.2533 | 2.9696 | 2.2477 | 2.9653 |
| μEx before DC subtraction | 0.2062 | 0.2051 | 0.4043 | 0.4034 |
| σEx before DC Subtraction | 0.0503 | 0.0639 | 0.0551 | 0.0638 |
| μEx after DC subtraction | 0.1989 | 0.2031 | 0.4025 | 0.4029 |
| σEx after DC subtraction | 0.0163 | 0.0453 | 0.0193 | 0.0585 |
When there is no noise, the estimated DC intensity is almost the same as the true value, and the standard deviation of the strain after DC component subtraction is one third that of the strain obtained with original simulated images. Despite the negative effect on estimation of DC intensity and standard deviation of strain due to noise, the improvement on strain maps after DC component subtraction is obvious.
3.2 Phantom Tagged Images
Cylindrical agar gel phantom was made with one cylindrical soft inclusion. T1-weigthed MR image was imaged to reveal the anatomy of the phantom (Fig. 7(a)). The concentration of the phantom is 1% for the outer layer and 0.5% for the soft inclusion. The soft inclusion was made for purpose of elasticity reconstruction which is not within the scope of this paper.
Figure 7.
(a) T1-MR image of agar gel phantom, (b)–(c) The first and ninth frame of axial tagged images and (d)–(e) The first and ninth frame of sagittal tagged images.
The MR measurement was performed on a 3-T SIEMENS Trio Tim scanner. Sixteen tagged images were acquired for both axial and sagittal directions using our MR-compatible actuation system with 60 heart beats per minute and a simulated ECG. The phantom was compressed from the top using a plate. The maximum compression distance is 1cm. The imaging parameters are as follows: flip angle, 10°; tag orientation, 45°; tagging space, 8mm, echo time (TE), 3.96msec; repetition time (TR), 41msec; slice thickness, 6mm; field of view (FOV), 27×34 cm. The first and ninth frame of the tagged image sequence in both directions is shown in Fig. 7(b–e).
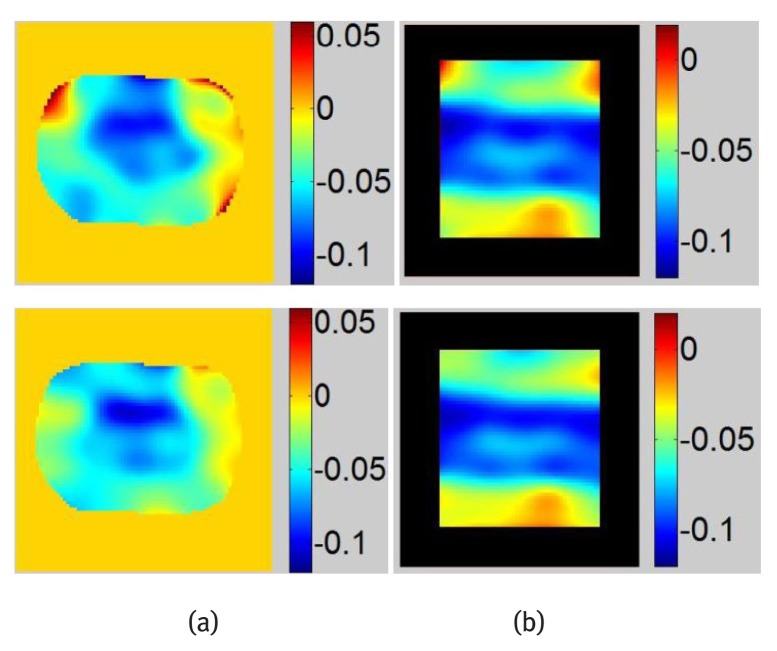
The magnitude image of the DC component is calculated by inverse Fourier transform of the filtered DC peak. The contour of the phantom can be easily tracked from the DC magnitude image. Then image is masked and only the tagged phantom is processed. This step is important since tag-unrelated pixels could generate artifacts in the final strain image. Strain maps calculated from images before and after DC component subtraction are shown in Fig. 8. For comparison, strain maps are also calculated numerically using finite element software. A large strain value is observed in the soft regions of the phantom which corresponds well with the finite element calculation. Since the phantom is compressed, negative strain values are dominating over the entire phantom domain. Positive strain values shown in red pixels are strain artifacts. These artifacts can be observed in strain maps especially at their borders before DC component subtraction. The overall smoothness of the strain maps after DC component subtraction has improved. For sagittal tagged images shown in Fig. 7(d–e), most of their DC spectrum spreads vertically and horizontally due to the rectangular shape of the tagged images. Therefore, the DC peak is less interfering to the harmonic peaks that are located on the diagonal of the images. Therefore, less improvement of strain map is obtained in the sagittal direction compared with that in the axial direction.
Figure 8.
Strain maps obtained with tagged phantom images, Top: Strain maps obtained with original image, Bottom: Strain maps obtained after DC component subtraction, (a) Axial images (b) Sagittal images.
3.3 Patient Cardiac Tagged Images
Cardiac tagged MR images are processed using the proposed method to demonstrate its practicability and application to heart imaging. The publicly available dataset was downloaded from http://www.creatis.insalyon.fr/inTag/index.html. Twenty eight tagged images were acquired within a single breath hold. The MR measurement was performed on a 1.5-T SIEMENS Avanto scanner. The imaging parameters are: flip angle, 15°; tag orientation, 45°; tagging space, 7mm, echo time (TE), 1.49msec; repetition time (TR), 28.9msec; slice thickness, 8mm; field of view (FOV), 24×24 cm.
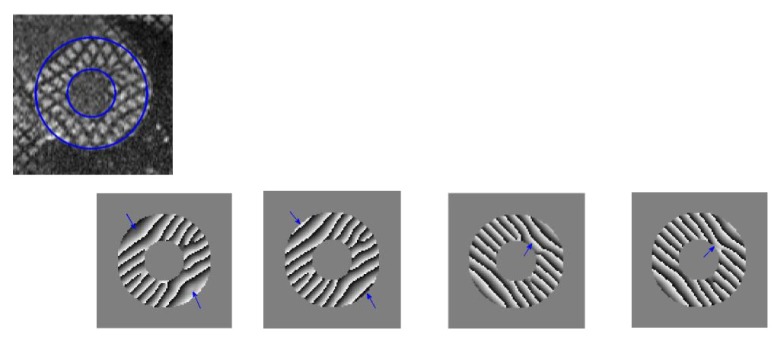
We focus on the end-systolic state because the heart reaches the maximum deformation at end systole. Therefore, the spectrum of the deformed tag signal has a wide spread in the frequency domain. Segmentation of the LV was performed manually by defining two concentric circles that enclosed the LV of the heart. Tagged image other than the LV was zero padded and only the LV region was processed.
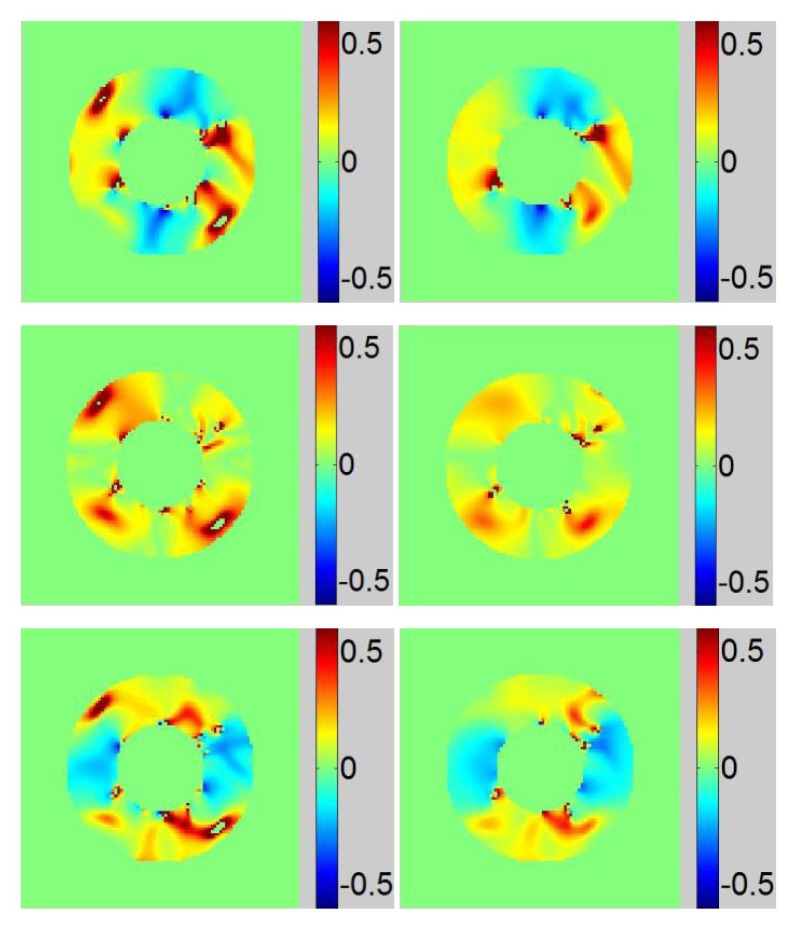
Harmonic phase images are calculated and shown in Fig. 9. We observe that the two missing tag lines at the border are recovered after DC component subtraction (highlighted using arrows). Improved correspondence between phase wrapping line and tag lines are observed after DC component subtraction. The strong strain variation along the internal border of LV was due to the missing tag signal from 3D heart contractile deformation. Negative strain in systolic regions and positive strain in diastolic regions are observed. For ease of comparison, strain maps are displayed using the same color bar limit. Erroneous strain values bigger than 0.5 is eliminated resulting in the ‘holes’ in Fig. 10(a) strain maps. Due to the DC peak interference, strain map artifacts are mostly observed in the diagonal region of the image. Compared with strain maps before DC component subtraction, strain maps with less artifacts and better smoothness has been obtained.
Figure 9.
Top: Myocardial tagged image at end-systole, Bottom: Harmonic phase image in both directions, (a) and (c) before DC component subtraction, (b) and (d) after DC component subtraction.
Figure 10.
Top, middle and bottom rows are LV strain maps of Exx, Exy and Eyy respectively, (a) Obtained with original images and (b) Obtained with images after DC component subtraction.
4 Discussion
Accurate calculation of myocardial strain maps is important for myocardial function evaluation as well as heart elastography. HARP technique provides automatic evaluation of myocardial strain analysis and motion tracking. The DC spectral interference is a primary source of strain artifacts that degrade the performance of HARP. The DC component carries no information about the tag deformation. However, the large intensity of the DC component may cause considerate peak inference to the harmonic peak extraction especially when the tag space is big and the harmonic peak is near the DC peak. The DC peak interference cannot be totally eliminated without prior knowledge of the I0. Nevertheless, by subtracting the estimated DC component, the interference can be greatly reduced since the intensity of the DC component is largely decreased.
SPAMM-based imaging protocols including CSPAMM [28], TruHARP [30] have been proposed to cancel the useless spectral peaks. The drawback of CSPAMM is that image misregistration often happens between breath-holds. As a result, large gradient of image intensity is observed at the edges of the heart wall [29]. TruHARP is proposed to totally remove unwanted spectral peaks in Fourier space. However, due to the large amount of data sampling, images obtained by TruHARP are subject to signal loss and tag spacing constraint. Gabor filter banks are designed to maximally subtract the deforming tag signal while filtering out the unrelated spectral interferences [11]. Since circular bandpass filter with radius chosen at half of the tag frequency is used throughout this study, the performance of the proposed method can be further enhanced by using Gabor filter banks.
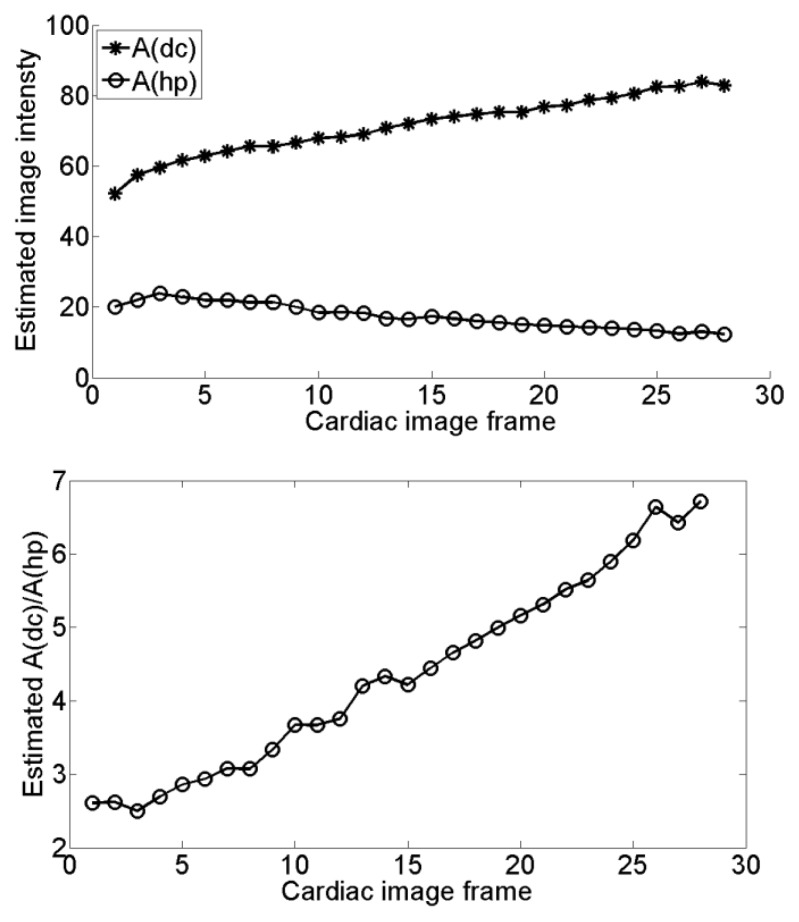
In our experiment with patient cardiac tagged images, only the cardiac image of the end systole is processed and evaluated. To investigate the performance of our method on images of other cardiac contractile stages, Adc′, Ahp′ and Adc/Ahp of the myocardial tagged images sequence are estimated and shown in Fig. 11. In the whole cardiac cycle, Adc′ increases while Ahp′ decreases. Since the estimated Adc/Ahp increases from 2.5 to 6.8, our method will provide better improvement for the cardiac diastolic stage (referred to Fig.1). Although the increasing Adc/Ahp can be suppressed by using AIR-SPAMM [31], our method can also be used since the DC peak remains.
Figure 11.
Top: Estimated Adc and Ahp, Bottom: Estimated intensity ratio Adc / Ahp.
Our method has been shown to perform well for both phantom tagged images and cardiac tagged images whose DC and harmonic component are not exactly uniform. The DC component may not be perfectly eliminated after DC subtraction, but its spectral interference is greatly reduced since its intensity has been largely decreased. During HARP calculation, it is important to note that a proper prior segmentation is important for HARP strain analysis. Any tag-unrelated image pixels will result in noisy phase values which cause strain artifacts.
The radius of the bandpass filter is usually a tradeoff between strain resolutions and artifacts. By reducing the spectral interference, the bandpass filter can have a larger radius, and better strain map resolution can be achieved using our method. When the tag is deformed by a large strain range, harmonic peak extraction is more vulnerable to the DC peak interference since the deformed tag signal has a wider spread in the frequency domain. In this case, our method will be more effective since the reduction of DC peak interference is more obvious. This method performs well with images under the presence of noise due to both the intensity averaging in DC component estimation and the harmonic peak extraction procedures. Other noise reduction techniques can also be applied prior to DC component subtraction to enhance the performance of the proposed method.
5 Conclusions
We proposed a new approach for strain maps artifacts reduction for HARP. The DC component of a SPAMM tagged image is estimated and subtracted from the original tagged image. The DC peak interference is reduced by decreasing the intensity of the DC component. Our method is tested using simulated tagged images, phantom tagged images from quasi-static MR elastography and myocardial tagged images. Harmonic phase wrapping lines obtained after DC component subtraction show better correspondence with the original tag lines. Strain maps can be obtained with few artifacts and good accuracy after DC component subtraction especially at the borders of the strain maps.
This method is important since it significantly reduces the artifacts in strain maps. Its application is not limited to myocardial tagged imaging. Soft tissue elastography is usually computed based on strain maps. Artifacts in strain maps enhance the difficulty of elasticity reconstruction and lead to erroneous elastography. With strain maps of high accuracy and smoothness, elastography can be reconstructed with high reliability using the quasi-static MR elastography method. The quasi-static MR elastography is advantageous over the dynamic MR elastography in several aspects. Dynamic MR elastography often suffers from poor spatial resolutions and the difficulties in achieving uniform mechanical wave excitation across the sample. Besides, the elastography obtained using dynamic method usually shows a dependency on the wave frequency of the external excitation. We have demonstrated the viability of this quasi-static MR elastography method using tagged imaging and HARP with applications on human lower legs and porcine liver organs.
Figure 6.
Strain maps obtained with noisy images, Top: Strain maps obtained with original image, Bottom: Strain maps obtained after DC component subtraction, (a). EX - 0.2, and (b) EX - 0.4. (a) (b) (c) (d) (e)
Footnotes
Conflict of interest statement: Authors state no conflict of interest.
References
- 1.Wu KC, Lima JA. Noninvasive imaging of myocardial viability: current techniques and future developments. Circ Res. 2003;93:1146–1158. doi: 10.1161/01.RES.0000103863.40055.E8. [DOI] [PubMed] [Google Scholar]
- 2.Bax JJ, De RA, Van EE. Assessment of myocardial viability by MRI. J Magn Reson Imaging. 1999;10:418–422. doi: 10.1002/(sici)1522-2586(199909)10:3<418::aid-jmri25>3.0.co;2-c. [DOI] [PubMed] [Google Scholar]
- 3.Fu YB, Chui CK, Teo CL, Kobayashi E. Motion tracking and strain map computation for quasi-static Magnetic Resonance Elastography. MICCAI, LNCS. 2011;6891:433–440. doi: 10.1007/978-3-642-23623-5_54. [DOI] [PubMed] [Google Scholar]
- 4.Fu YB, Chui CK, Teo CL, Kobayashi E, Chang S. A new actuation system with simulated electrocardiogram signal for MR Elastography. ASME Journal of Medical Devices. 2010 [Google Scholar]
- 5.Atalar E, McVeigh E. Optimization of tag thickness for measuring position with magnetic resonance imaging. IEEE Trans Med Imag. 1994;13(1):152–160. doi: 10.1109/42.276154. [DOI] [PMC free article] [PubMed] [Google Scholar]
- 6.Guttman MA, Prince JL, McVeigh ER. Tag and contour detection in tagged MR images of the left ventricle. IEEE Trans Med Imag. 1994;13(1):74–88. doi: 10.1109/42.276146. [DOI] [PubMed] [Google Scholar]
- 7.Kerwin WS, Prince JL. Tracking MR tag surfaces using a spatiotemporal filter and interpolator. Int J Imag Sys Tech. 1999;10(2):128–142. [Google Scholar]
- 8.Deng X, Thomas SD. Combined tag tracking and strain reconstruction from tagged cardiac MR images without user-defined myocardial contours. J Magn Reson Imaging. 2005;21(1):12–22. doi: 10.1002/jmri.20234. [DOI] [PubMed] [Google Scholar]
- 9.Kumar S, Goldgof D. Automatic tracking of SPAMM grid and the estimation of deformation parameters from cardiac MR images. IEEE Trans Med Imag. 1993;13:122–132. doi: 10.1109/42.276150. [DOI] [PubMed] [Google Scholar]
- 10.Amini AA, Chen Y, Curwen RW, Mani V, Sun J. Coupled Bsnake grids and constrained thin-plate splines for analysis of 2-D tissue deformations from tagged MRI. IEEE Trans Med Imag. 1998;17(3):344–356. doi: 10.1109/42.712124. [DOI] [PubMed] [Google Scholar]
- 11.Qian Z, Huang X, Metaxas D, Axel L. Robust segmentation of 4D cardiac MRI-tagged images via spatio-temporal propagation. Proc SPIE Med Imag. 2005:580–591. [Google Scholar]
- 12.Prince JL, McVeigh ER. Motion estimation from tagged MR image sequences. IEEE Trans Med Imag. 1992;11(2):238–249. doi: 10.1109/42.141648. [DOI] [PubMed] [Google Scholar]
- 13.Denney JT, Prince JL. Optimal brightness functions for optical flow estimation of deformable motion. IEEE Trans Image Proc. 1994;3(2):178–191. doi: 10.1109/83.277899. [DOI] [PubMed] [Google Scholar]
- 14.Gupta SN, Prince JL. On variable brightness optical flow for tagged MRI. Proc Inf Process Med Imag. 1995:323–334. [Google Scholar]
- 15.Haber I, Kikinis R, Westin CF. Phase-driven finite element model for spatio-temporal tracking in tagged cardiac MRI. Proc MICCAI. 2001 [Google Scholar]
- 16.Osman NF, Kerwin WS, McVeigh ER, Prince JL. Cardiac motion tracking using cine harmonic phase (harp) magnetic resonance imaging. Magn Reson Med. 1999;42:1048–1060. doi: 10.1002/(sici)1522-2594(199912)42:6<1048::aid-mrm9>3.0.co;2-m. [DOI] [PMC free article] [PubMed] [Google Scholar]
- 17.Osman NF, McVeigh ER, Prince JL. Imaging heart motion using harmonic phase MRI. IEEE Trans Med Imag. 2000;19:186–202. doi: 10.1109/42.845177. [DOI] [PubMed] [Google Scholar]
- 18.Liu W, Chen JJ, Ji SB, Allen SJ, Bayly PV, Wickline SA, Yu X. Harmonic Phase MR Tagging for Direct Quantification of Lagrangian Strain in Rat Hearts after Myocardial Infarction. Magn Reson Med. 2004;52:1282–1290. doi: 10.1002/mrm.20276. [DOI] [PubMed] [Google Scholar]
- 19.Pan L, Prince JL, Lima JA, Osman NF. Fast tracking of cardiac motion using 3D-HARP. IEEE Trans Biomed Eng. 2005;52(8):1425–1435. doi: 10.1109/TBME.2005.851490. [DOI] [PubMed] [Google Scholar]
- 20.Venkatesh BA, Gupta H, Lloyd SG, Italia LD, Denney TS. 3D left ventricular strain from unwrapped harmonic phase measurements. J Magn Reson Imag. 2010;31:854–862. doi: 10.1002/jmri.22099. [DOI] [PMC free article] [PubMed] [Google Scholar]
- 21.Osman NF, Prince JL. Visualizing myocardial function using HARP MRI. Phys Med Biol. 2000;45(6):1665–1682. doi: 10.1088/0031-9155/45/6/318. [DOI] [PubMed] [Google Scholar]
- 22.Arts T, Prinzen FW, Delhaas T, Milles JR, Rossi AC, Clarysse P. Mapping displacement and deformation of the heart with local sine-wave modeling. IEEE Trans Med Imag. 2010:29. doi: 10.1109/TMI.2009.2037955. [DOI] [PubMed] [Google Scholar]
- 23.Osman NF, Prince JL. On the design of the bandpass filters in harmonic phase MRI. Image Processing, International Conference. 2000;1:625–628. [Google Scholar]
- 24.Marinelli M, Positano V, Osman NF, Recchia FA, Lombardi M, Landini L. Automatic filter design in HARP analysis of tagged Magnetic Resoance Images. Biomedical Imaging: From Nano to Macro, ISBI. 5th IEEE International Symposium; 2008. pp. 1429–1432. [Google Scholar]
- 25.Barajas J, Barnes JG, Carreras F, Pujadas S, Radeva P. Angle images using gabor filters in cardiac tagged MRI. Proceeding of the conference on Artificial Intelligence Research and Development. 2005 [Google Scholar]
- 26.Davis CA, Li J, Denny TS. Analysis of spectral changes and filter design in tagged cardiac MRI. Biomedical Imaging: Nano to Macro, 3rd IEEE International Symposium; 2006. pp. 137–140. [Google Scholar]
- 27.Ryf S, Tsao J, Schwitter J, Stuessi A, Boesiger P, Peak-combination HARP. A method to correct for phase errors in HARP. J Magn Reson Imaging. 2004;20(5):874–880. doi: 10.1002/jmri.20186. [DOI] [PubMed] [Google Scholar]
- 28.Fischer SE, McKinnon GC, Maier SE, Boesiger P. Improved myocardial tagging contrast. Magn Reson Med. 1993;30:191–200. doi: 10.1002/mrm.1910300207. [DOI] [PubMed] [Google Scholar]
- 29.Kuijer JP, Jansen E, Marcus JT, Rossum AC, Heethaar RM. Improved harmonic phase myocardial strain maps. Magn Reson Med. 2001;46:993–999. doi: 10.1002/mrm.1286. [DOI] [PubMed] [Google Scholar]
- 30.Agarwal HK, Prince JL, Abd-Elmoniem KZ. Total removal of unwanted harmonic peaks (TruHARP) MRI for single breath-hold high-resolution myocardial motion and strain quantification. Magn Reson Med. 2010;64:574–585. doi: 10.1002/mrm.22403. [DOI] [PMC free article] [PubMed] [Google Scholar]
- 31.Aletras AH, Freidlin RZ, Navon G, Arai AE. AIR-SPAMM: alternative inversion recovery spatial modulation of magnetization for myocardial tagging. J Magn Reson. 2004;166:236–245. doi: 10.1016/j.jmr.2003.10.021. [DOI] [PubMed] [Google Scholar]


