

Abstract
Cellular optogenetic switches, a novel class of biological tools, have improved our understanding of biological phenomena that were previously intractable. While the design and engineering of these proteins has historically varied they are all based on borrowed elements from plant and bacterial photoreceptors. In general terms, each of the optogenetic switches designed to date exploits the endogenous light induced change in photoreceptor conformation while repurposing its effect to target a different biological phenomena. We focus on the well-characterized Light Oxygen Voltage 2 (LOV2) domain from Avena sativa phototropin 1 as our cornerstone for design. While the function of the LOV2 domain in the context of the phototropin protein is not fully elucidated, its thorough biophysical characterization as an isolated domain has created a strong foundation for engineering of photoswitches. In this chapter, we examine the biophysical characteristics of the LOV2 domain that may be exploited to produce an optogenetic protein and summarize previous design efforts to provide guidelines for an effective design. Furthermore, we provide protocols for assays including fluorescent polarization, phage display, and microscopy that are optimized for validating, improving, and using newly designed photoswitches.
1 Introduction
The ability to control biological processes with light is revolutionizing how we study biological phenomena. Via the use of lasers and modern microscopes light-activatable systems allow researchers to stimulate and monitor signaling events with amazing spatiotemporal resolution in living cells and organisms. In general, light activatable systems can be classified into two types: those that involve chemical modification of macromolecules and those that are fully genetically encoded (optogenetic). This chapter focuses on genetically encoded biological photoswitches that are based on light sensing plant proteins. Typically, upon light stimulation the proteins undergo conformational changes that are used to modulate signaling events. These photoreceptors can be placed into two groups – red- and blue-light photoreceptors.
The red-light photoreceptor that has been used most extensively to control signaling is phytochrome B (PhyB). PhyB exists in two distinct states PR and PFR that reversibly interconvert when stimulated with red light (660 nm) or far red light (720 nm). When phyB is in the PFR state it binds to phytochrome-interacting family proteins (PIF), which mediate its biological activity (Ni, Tepperman, & Quail, 1999). This provides a natural red-light inducible heterodimerizer system that can readily be used for recruiting a protein of interest to a specific location in a cell (Levskaya, Weiner, Lim, & Voigt, 2009). However, this photoswitch has a few drawbacks that can restrict engineering efforts: 1) there is a lack of structural understanding on how this heterodimerizable pair works; 2) PhyB requires the chromophore phytochromobilin, which is not present in organisms other than some plants and thus necessitates external supplementation; 3) many optical systems are not fitted with lasers in the far-red light range.
There are two main photoreceptors used for tool engineering that are excited by blue-light – Cryptochromes and Light Oxygen Voltage (LOV) domains from phototropins. The cryptochrome used extensively is Arabidopsis thaliana Cry2, which requires a FAD chromophore, commonly found throughout various organisms (Liu et al., 2008). Similarly to PhyB-PIF interaction heterodimer pair, Cry2 interacts naturally with the protein CIB1 in its photoexcited state (Kennedy et al., 2010). This represents a natural blue-light inducible heterodimerizable pair, which has been used for the recruitment of proteins of interest to the plasma membrane for the study of cell motility as well as in a two-hybrid fashion for the control of transcription and others (Kennedy et al., 2010). An intriguing property of Cry2 discovered recently is that it also homo-oligomerizes upon blue light illumination, which can be used to control cellular processes (Bugaj et al., 2015; Taslimi et al., 2014). Thus far, the most characterized photoreceptor is the LOV2 domain from phototropin 1 of Avena sativa. This protein contains an FMN chromophore, which like FAD is found in most organisms. Structural studies have established that upon blue light stimulation the C-terminal helix of the domain, the Jα-helix, undocks from the PAS core domain and unfolds (Halavaty & Moffat, 2007; Harper, Neil, & Gardner, 2003). This dramatic conformational change has served as the basis for most engineering efforts involving blue-light inducible photoswitches (Baarlink, Wang, & Grosse, 2013; Lungu et al., 2012; Niopek et al., 2014; Renicke, Schuster, Usherenko, Essen, & Taxis, 2013; Spiltoir, Strickland, Glotzer, & Tucker, 2015; Strickland et al., 2012; Wu et al., 2009; Yi, Wang, Vilela, Danuser, & Hahn, 2014; Yumerefendi et al., 2015; Yumerefendi et al., 2016). LOV2-based switches can be grouped into two categories: single- or two-component systems. Single component LOV2-based photoswitches generally exploit endogenous cellular mechanisms. Examples of such are the photo-activatible GTPases and recently described systems that exploit endogenous trafficking mechanisms (Wu et al., 2009; Yumerefendi et al., 2015). Two component systems usually couple two functional elements into a synthetic heterodimerizable system (Guntas et al., 2015; Lungu et al., 2012; Strickland et al., 2012). Here we describe how LOV2-based photoswitches can be created, validated, and optimized. Additionally, we provide some guidelines for using them in yeast and mammalian tissue culture systems.
2 Engineering LOV2-based photoswitches
All LOV2-based photoswitches to date are efforts of rational engineering. The engineering process is centered on testing a small number of variants, which requires a method and criteria for validation. While, there is not a single best test for validation, most LOV2-based switches function by regulating binding affinity for another protein, and therefore we describe a relatively universal approach based on fluorescence polarization measurements pre- and post-illumination to measure the binding affinities of the photoswitch for binding partners. The criteria for a successful design should involve achieving a change in binding affinities that is relevant for the biological process being manipulated. The design process is iterative in nature and we have shown that an initial hit can be optimized using directed evolution. Finally, LOV2-based switches can also be tuned to suit the time scale of biological process under investigation.
2.1 Rational engineering of a LOV2-based photoswitch
Structural studies of LOV2 have yielded atomic resolution information for the protein in absence of light, which revealed a PAS-fold with a tightly embedded flavin mononucleotide cofactor (Crosson & Moffat, 2001). Upon blue light irradiation the C(4a) atom in the FMN ring forms a covalent adduct with a proximal cysteine C450 (Halavaty & Moffat, 2007). The transient thiol bond formation leads to small conformational changes in the domain which propagate to the Jα-helix and cause it to become unstructured and undocked from the rest of the PAS-fold (Fig. 1A). This, Jα-helix conformational change, allows for allosteric block of a peptide of interest in the dark and its release in the light. There are successful examples for both the control of short peptides and entire functional protein domains. In all cases, the goal is to sterically block key amino acids from binding with an interaction partner.
Figure 1.
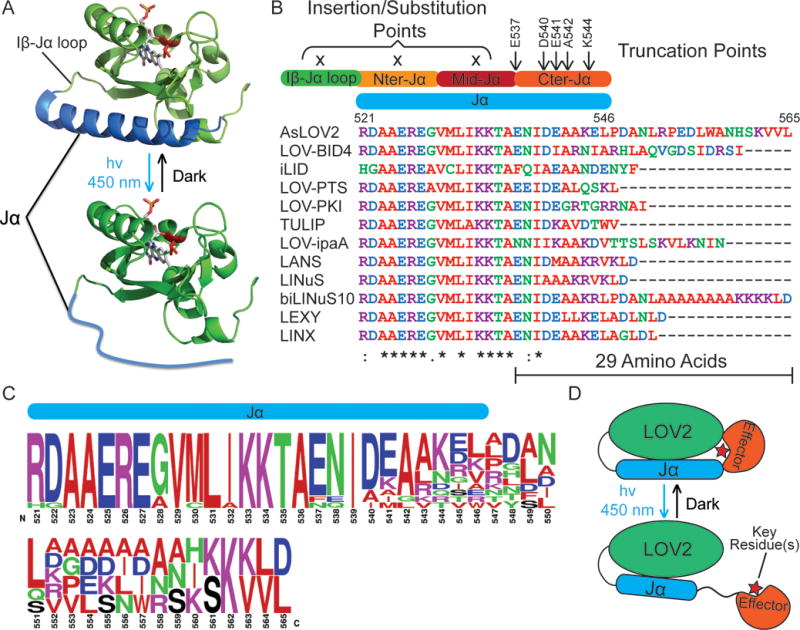
Design of LOV2-based photoswitches. A) LOV2 exhibits conformational change upon blue light illumination, which manifests by the partial undocking followed by unfolding of its C-terminal helix, the Jα helix. NOTE: While the structure for the dark state of the protein is known, thorough characterization of the lit state structure is missing and thus is illustrate in the bottom part of this figure. B) Sequence alignment of the Jα helix of LOV2-based photoswitches to date demonstrates emerging patterns. All of the current successful photoswitches are created by embedding a peptide epitope after truncation of the Jα helix at its C-terminal region (Guntas et al., 2015; Lungu et al., 2012; Mart, Meah, & Allemann, 2016; Niopek et al., 2014; Niopek, Wehler, Roensch, Eils, & Di Ventura, 2016; Spiltoir et al., 2015; Strickland et al., 2012; Yi et al., 2014; Yumerefendi et al., 2015; Yumerefendi et al., 2016). C) Consensus amino acids within the Jα helix of the photoswitches aligned in B (Crooks, Hon, Chandonia, & Brenner, 2004). D) Schematic of how LOV2 allows the control of a protein domain. Key residues (illustrated with a red star) allosteric blockage in the dark is essential for this strategy.
2.1.1 Embedding peptides
There are a few photoswitches that have been designed by embedding a peptide in the Jα helix. In most successful cases the peptide was embedded near the C-terminus of the Jα helix (Guntas et al., 2015; Lungu et al., 2012; Mart, Meah, & Allemann, 2016; Niopek et al., 2014; Niopek, Wehler, Roensch, Eils, & Di Ventura, 2016; Spiltoir et al., 2015; Strickland et al., 2012; Yi et al., 2014; Yumerefendi et al., 2015; Yumerefendi et al., 2016) (Fig. 1B). We have tested constructs that place a peptide sequence near the N-terminal or middle of the Jα helix, and in these cases observed only weak binding affinity for the target protein in the lit state (Lungu et al., 2012). When we aligned the Jα helix sequence of the best reported successful photoswitches we observed that they make use of 5 primary truncation points (E537, D540, E541, A542 and K544) (Fig. 1B). The total length for caged peptides counting from E537 and extending to the longest extension of Jα helix is 29 amino acids. Generally, significant sequence homology is followed up to residue I539 with exceptions mostly to mutations described to stabilize the LOV2 dark state (Guntas et al., 2015; Strickland et al., 2010). After residue I539, significant sequence divergence can be seen but a pronounced preference exists for alanine at residue 542, small hydrophobic amino acid at residue 543 and leucine at residue 551 (Fig. 1C). Notably, when the conserved hydrophobic amino acid at position 543 was mutated to arginine, the switch (PA-PKI) exhibited low dynamic range with only modest control (two-fold) of its target PKA kinase.
2.1.2 Fusing protein domains
There are two prominent successful examples for LOV2-based switches that allosterically block a functional protein domain, PA-Rac and LOV-DAD (Baarlink et al., 2013; Wu et al., 2009). PA-Rac is a fusion of LOV2 (404–546) and the small GTPase Rac1 (4–192). In the dark state the constitutively active Rac1 mutant Q61L has weaker affinity for its effector, the endogenous CRIB domain of PAK1 kinase. LOV-DAD is a fusion of LOV2 (403–543) and the autoinhibitory DAD domain (1038–1171) of the actin nucleation and elongation factor, the formin mDia2. Upon light illumination of LOV-DAD, the DAD domain is released to bind the N-terminal part of the endogenous mDia2 and thus lock it in an active conformation. In both photoswitches, successful obstruction of key residues in the dark state of the protein has been achieved. In the case of PA-Rac, its crystal structure reveals occlusion of a beta strand required for its interaction to its effector CRIB in the dark state of the protein. This was achieved with no truncation further into the LOV2 domain but with the identification of a suitable truncation position for Rac1. In the case of LOV-DAD, a single truncation point within the Jα helix was tested (A543) and a successful truncation of mDia2 DAD was identified such that the critical residue M1041 is immediately at the C-terminus of the Jα helix, and thus is likely to pack against the PAS domain of the LOV2 domain. These examples imply that packing a single key residue against the PAS domain may be sufficient for caging (Fig. 1D).
2.2 Validating LOV2-based photoswitches
The validation of initial designs depends largely on the targeted effector protein. In the majority of cases the goal is to regulate binding affinity to an effector protein, and therefore in vitro binding measurements can be used to validate the switch. Previously, we have demonstrated a good correlation between the biophysical behavior of a photoswitch and its functional activity (Hallett, Zimmerman, Yumerefendi, Bear, & Kuhlman, 2016). While there are numerous techniques for the measurement of protein-protein affinities few of the necessary instruments can be adapted for light illumination during the measurement process. Most systems are in fact enclosed and thus permit measurement of affinities only in the dark state of a photoswitch. One solution to this issue is the application of mutations that mimic its lit (open) conformation (Table 1). Such mutations have been proven useful but unsatisfactory for the recapitulation of the behavior of the switch in their absence, i.e. the light-stimulated photoswitch. To address this issue and measure the affinities of light sensitive switches, we have modified a fluorometer with a 465 nm LED lamp to successfully employ a variation of a fluorescent polarization competition assay (Fig. 2A and 2B). This set-up enables us to illuminate a sample and subsequently make a measurement. To perform the assay we used a fluorescently labeled peptide with the same sequence as the peptide embedded in the Jα helix of LOV2. In the dark the labeled peptide binds to the target protein (realized as a high polarization state) but upon illumination it is competed off by the photoswitch (realized by a low polarization state) (Fig. 2C and 2D).
Table 1.
List of mutations that affect the caging of LOV2 domain.
| Mutation | Effect | References |
|---|---|---|
| V529N | Lit mimetic | (Strickland et al., 2012) |
| I539E | Lit mimetic | (Strickland et al., 2012) |
| I532E/A536E | Lit mimetic | (Nash et al., 2008) |
| C450A | Dark mimetic | (Nash et al., 2008) |
| C450S | Dark mimetic | (Nash et al., 2008) |
| T406A/T407A | Improve caging | (Strickland et al., 2012) |
| G528A | Improve caging | (Strickland et al., 2010) |
| N538E | Improve caging | (Strickland et al., 2010) |
| I532A | Improve caging | (Strickland et al., 2010) |
| L514K/L531E | Improve caging | (Lungu et al., 2012) |
Figure 2.
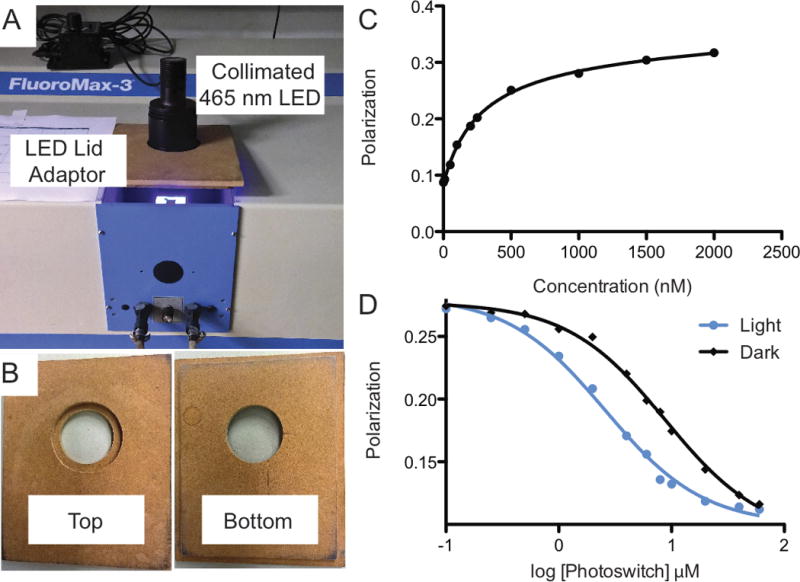
Validation and screening of initial LOV2-based photoswitch designs. A) A FluoroMax-3 setup used for measuring the affinities of photoswitches using blue LED light. B) LED lid adaptor made to fit the fluorometer and the LED light. C) An example of a titration of a TAMRA-labeled peptide against a target. D) An example of competitive binding of a photoswitch upon light illumination or absence of light.
2.2.1 Fluorescent polarization competition assay to measure binding affinities in the lit and dark states
Equipment and materials
Fluorimeter equipped with polarizers (Jobin Yvon Horiba FluoroMax-3)
5-TAMRA labeled peptide
LED light (Thorlabs M455L3-C1 - Royal Blue (455 nm))
LED Lid Adaptor
Quartz Fluorometer Open Top or MicroCell cuvettes (Starna Cells, Inc #3-3.45-Q-3)
Purified proteins
Buffers
Protocol
Establish the binding affinity of the fluorescent peptide to the target protein by titrating the target protein into 1500 μL of buffer containing 20 nM of the fluorescent peptide (see Fig. 2C). NOTE: The concentration of the peptide may need to be higher to obtain good signal-to-noise ratio for the assay.
Establish concentration of the target peptide at which it binds the fluorescent protein at about 60%.
Prepare 1500 μL of buffer containing 20 nM of the fluorescent peptide and the target protein bound at 60% (Fig. 2C).
Titrate the photoswitch into the cuvette in a dark room using a blue LED lamp to cover the sample chamber. Illuminate the sample for 2 minutes with 6 mW/cm2. Quickly turn off the lamp and take a reading (light binding). NOTE: The faster the lamp can be turned off and the measurement made the more accurate the reading will be as the process will begin reversion immediately after the lamp has been turned off. This makes measurement for switches with < 30 s half-lives difficult to measure. Take a second reading after 5 more minutes keeping the sample in the dark (dark binding). Repeat the process over 12 titration points.
Fit the fluorescent polarization values with Prism 5 to identify IC50. Use this value, the starting concentration of the target protein and peptide as well as their affinity to calculate Ki through the following online calculator (Nikolovska-Coleska et al., 2004): http://sw16.im.med.umich.edu/software/calc_ki/
2.3 Improving Initial switches by known mutations
The efficiency of a photoswitch depends on how well its inherent dynamic range aligns to that of the biologically relevant process it controls. In our hands, photoswitches with a two-fold change in binding affinity within the low nanomolar and low micromolar range have not proven useful for the control of transcription or protein co-localization. While such switches may be useful in some cases, most protein interactions occur between the low nanomolar and the low micromolar affinity range, which suggests that within this affinity range a photoswitch that exhibits such a low dynamic range may not be effective. If an initial photoswitch does not exhibit dynamic range larger than two fold we would recommend to test a set of mutations previously described to enhance the dynamic range of a LOV2-based photoswitches (Strickland et al., 2012; Strickland et al., 2010) (Table 1). These generally have been demonstrated to stabilize the Jα helix in the dark state of the LOV2 domain by increasing its helical propensity or its packing against the PAS domain thus increasing the stability of the dark conformation. A common side effect, we have observed, is that the use of such mutations may be accompanied by a decrease of activity upon light illumination. Although the number of LOV2-based photoswitches is not large, it appears that the aforementioned mutations may be particularly helpful if the peptide embedded does not have high helical propensity (the case of TULIPS and iLID).
2.4 Library-based screening and selection for functional LOV2-based photoswitches
Ideally, a photoswitch would be a binary system with a defined on-state that activates a biological process and an off-state that is completely devoid of function. While this may never be achieved due to the stochastic nature of biological systems, a large dynamic range between the active and inactive state of the protein is sufficient. One approach to achieve a large dynamic range is to create synthetic libraries of the photoswitch of interest and isolate the most efficient ones through screening or selection strategies. A possible solution we have successfully explored is to use computationally predicted mutations that stabilize the dark state of the LOV2 domain thus aiming to decrease the affinity of the targeted interaction in the dark while maintaining the affinity of the interaction under blue light. The key to successful strategies for evolving dynamic range is to maintain selective pressure for both states of the designed photoswitch and perform rounds of dual - positive and negative selections. The first aims to increase or maintain the activity in the light immediately followed by the second, which selects for variants from the first that have turned off and exhibit low levels of activity in the dark (Fig. 3A).
Figure 3.
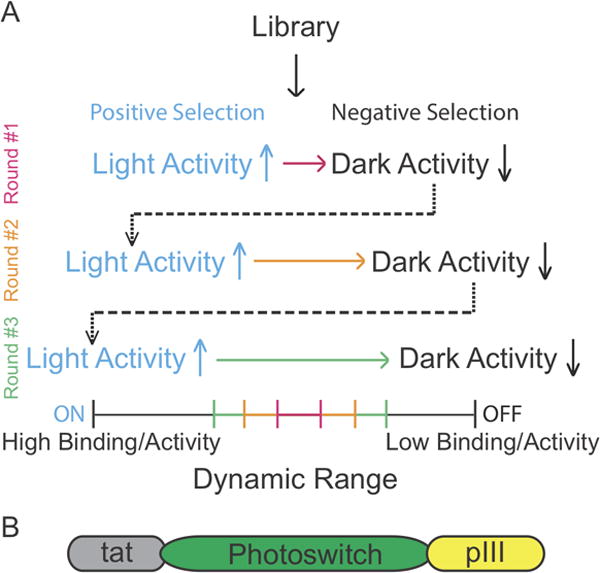
Dynamic range enhancement through library-based methods. A) A schematic of a selection strategy for the enhancement of the dynamic range of a photoswitch. Starting from a library of mutants one can perform a positive or negative selection at first and then rounds of dual positive and negative selections. B) A schematic of the pIII construct used to functionally display photoswitches using phage display.
Phage display is a common selection methodology used to evolve protein-protein interactions (Packer & Liu, 2015). Typically, a coat protein of the M13 filamentous phage such as pIII is fused to a target peptide or protein for its display (Packer & Liu, 2015). As part of the phage life cycle the coat phage proteins are secreted and fold in the periplasm (Steiner, Forrer, Stumpp, & Plückthun, 2006). Our initial attempts to use phage display on LOV2 switches using the typical Sec secretion pathway proved unsuccessful resulting in non-functional display of the LOV2 domain probably due to misfolding. To overcome this hurdle we used the twin-arginine translocation (tat) pathway, which allows the folding of a target protein to occur in the cytoplasm and its translocation to the periplasm in the folded state (DeLisa, Tullman, & Georgiou, 2003)(Fig. 3B).
Finally, we have incorporated the aforementioned dual selection concepts into a phage display strategy with which we were able to improve a photoswitch from a 8-fold dynamic range to 58-fold (Guntas et al., 2015).
2.4.1 Phage display panning
There are numerous protocols for performing phage display panning. Here, we describe the protocol employed for the development of the iLID photoswitch (Guntas et al., 2015). In this case, after the fourth round of dual selection, the gene pool was cloned in pET21b introducing a FLAG tag and soluble protein ELISA was performed on 96 clones. The ELISA allows for ranking of hits from the selection experiment as well as prioritizing clones for further validation and testing.
Equipment and materials
96-well Maxisorp immunoplates (Nunc, cat. no. 430341)
M13K07 helper phage (Invitrogen)
SS320 E. coli cells (Invitrogen)
BSA (Sigma, cat. No. A3059)
Sodium Bicarbonate buffer pH 9.6
Purified target protein
2YT media
PBS-Tween20 0.1% (PBS-T)
Protocol
Day 1
-
1
Coat a MaxiSorp 96-well plate with 100 μl/well of 5 μg/mL His-MBP-target protein in 50 mM NaHCO3 buffer at pH 9.6 over night at 4°C
Day 2
-
2
Wash three times the plate with PBS-T
-
3
Block with 200 μl of PBS-T and 5 mg/ml BSA for 2 hours at room temperature.
-
4
Wash three times the plate with PBS-T
-
5
Incubate 1×10¹¹ to 1×10¹² phage library for 1 hour under blue light at about 1mW/cm3
-
6
Wells are washed ten times with PBS-T
-
7
The washed plate is moved to a dark room and incubated for 10 minutes at room temperature
-
8
The supernatant is carefully collected (this represents the unbound portion of the phage library in the dark) and early log SS320 cells (OD600 0.2–0.5) are infected and grown in 25 mL of 2YT media supplemented with 100 μg/mL ampicillin
-
9
Incubate at 37°C shaking for 20–30 min
-
10
Add M13K07 helper phage to the culture with 20:1 multiplicity of infection
-
11
Incubate for 20 minutes at 37°C without shaking
-
12
Add 0.1 mM IPTG and 5 μM FMN and incubate at 30°C for 1.5 hours in a shaking incubator covered with aluminum foil to ensure darkness over the sample
-
13
Add Kanamycine to 25 μg/mL final to the culture and continue growing it at 30°C over night
-
14
Precipitate the enriched phage library and repeat the selection 3 times
2.5 Tuning the activity time scales of the LOV2-based photoswitch
Biological processes happen at various timescales. Furthermore, long-term exposure to intense light can affect biological samples (Cheng, Kiernan, Eliceiri, Williams, & Watters, 2016). Therefore, it is important to consider the time scale of photoswitch activation. The timescales at which a photoswitch is effective depends on its photocycle. In the case of the LOV2 domain the thiol bond formation is reversible with a half-life of ~30 seconds, leading to complete dark state reversion in absence of illumination. A large number of mutations that affect the half-life of the thiol bond between C450 and FMN in the light state of the photoswitch have been reported (Nash, Ko, Harper, & Gardner, 2008; Zayner, Antoniou, & Sosnick, 2012; Zayner & Sosnick, 2014). Half-lives from 2 seconds to 4300 seconds have been described. Depending on the application of interest one may consider tuning the half-life of the photoswitch using such mutations (Table 2).
Table 2.
List of mutations that affect the photocycle half-life of the LOV2 domain.
| Mutation | Half-life (s) | References |
|---|---|---|
| N414A/Q513H | 2 | (Zayner & Sosnick, 2014) |
| V416T | 2.6 | (Kawano, Aono, Suzuki, & Sato, 2013) |
| I427V | 4 | (Christie et al., 2007) |
| Q513D | 5 | (Zayner & Sosnick, 2014) |
| Q513N | 27.3 | (Nash et al., 2008) |
| Q513H | 30 | (Zayner & Sosnick, 2014) |
| N414D | 69 | (Zayner & Sosnick, 2014) |
| WT | 80 | (Zayner & Sosnick, 2014) |
| L453V | 160 | (Zayner & Sosnick, 2014) |
| Q513A | 261 | (Zayner & Sosnick, 2014) |
| N414Q | 280 | (Zayner & Sosnick, 2014) |
| N416S | 685 | (Zayner & Sosnick, 2014) |
| N414T | 892 | (Zayner & Sosnick, 2014) |
| V416I/L496I | 1000 | (Zoltowski, Vaccaro, & Crane, 2009) |
| Q513L | 1080 | (Nash et al., 2008) |
| N414A | 1427 | (Zayner & Sosnick, 2014) |
| Q513L | 1793 | (Zayner & Sosnick, 2014) |
| N414A/Q513A | 2081 | (Zayner & Sosnick, 2014) |
| V416L | 4300 | (Kawano et al., 2013) |
3 Using LOV2-based photoswitches
LOV2-based photoswitches can be used to modulate proteins at various size and time scales, from subcellular to whole organism and seconds to days. Population based assays can be performed using a variety of illumination methods. One difficult aspect is maintaining proper growth conditions while performing the exposure. We have designed ways to outfit incubators with light emitting apparatuses that do not interfere with growth and describe their use in this section (Fig. 4A). At the level of single cell and sub-cellular assays, a microscope outfitted with a laser that can be directed to a region of interest for activation is necessary. In most cases a laser scanning confocal microscope contains the required hardware and software modules out of the box. These instruments are commonly used for photo-bleaching assays, which are performed in a similar manner to photo-activation and can therefore be easily modified to do so.
Figure 4.
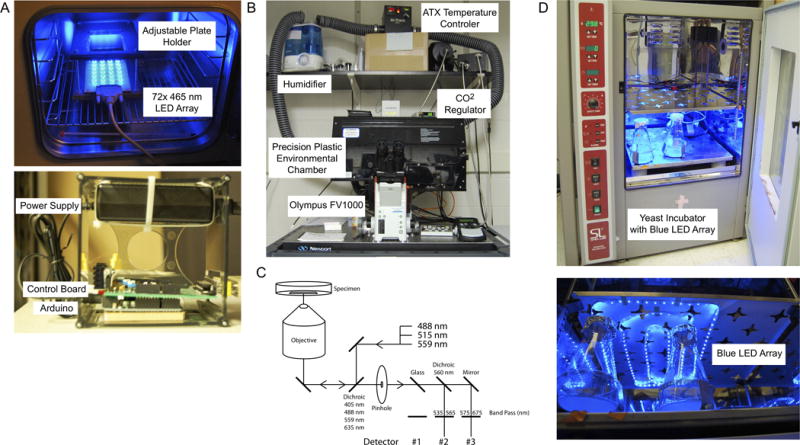
Equipment used in the validation and application of LOV2 based photoswitches. A) Adjustable and programmable tissue culture dish illuminator. Top- image of 72× 465 nm LED array placed in incubator for cell culture experiments. The plate holder can be adjusted to control the distance from the LED array. Bottom – image of Arduino based controller, which allows for programing of LED array brightness and timing. B) Image of Olympus FV1000 with equipment necessary for imaging and activation of LOV2 based photoswitches in live cells. C) Diagram of the light path used to image and activate LOV2 based photoswitches on a confocal microscope. D) Image of yeast incubator outfitted with a blue LED array for growth under activating conditions.
3.1 Single Cell Microscopy
Using a laser scanning confocal microscope, a small group or an individual cell can be imaged during photo-activation. Many out of the box microscopes have the ability to perform photo-activation/photo-bleaching experiments. The microscope described below is meant as a reference to what sorts of features are necessary. When designing your experiment, it is important to use fluorescent proteins or other molecules that are spectrally distinct from LOV2 so that activation and imaging are separate processes. Any visible light below 500 nm can activate LOV2 while optimal activation occurs at 450 nm. Therefore we use fluorophores with excitation and emission spectra greater than 500 nm (ex. mVenus, tagRFPt, mCherry, Cy5). While the filter sets described do not perfectly match the spectra of LOV2 and the fluorescent proteins used, they provide a usable signal to noise ratio that can be easily quantified.
Equipment and Reagents
- Olympus FV1000 laser scanning confocal microscope equipped with (Fig. 4B):
- 40× oil immersion objective lens, NA 1.3
- 100× oil immersion objective lens, NA 1.4
- Multi-line Argon Laser, 30 mW
- 559 nm diode laser, 15 mW
- 405/488/559/635 nm dichroic excitation mirror
- 560 nm dichroic emission mirror
- 505–540, 535–565, and 575–675 nm bandpass filters
- Precision Plastics black environmental chamber
- Air-Therm ATX-H heater
- Vix Humidifier
35 mm, No. 1.5 coverglass MatTek cell culture dish
Cell culture grade phosphate buffered saline (PBS)
Dulbecco’s modified eagle’s medium (DMEM)
DMEM, supplemented with 10% FBS, 100 U/ml penicillin, 100 μg/ml streptomycin, 292 μg/ml L-Glutamine
Trypsin –EDTA (TE)
Mammalian expression vector containing the sequence for your photoswitch fused to a fluorescent protein spectrally compatible with LOV2 (mVenus, TagRFPt, mCherry)
Cell line of interest (mouse embryonic fibroblasts are recommended as they spread out flat over a large area and survive at sparse concentrations which make them easy to work with and analyze image data from. One caveat is that they do not have high transfection efficiency)
10 μg/ml Fibronectin
NanoJuice transfection reagent (For improved MEF transfection efficiency)
Protocol
Day 1
-
1
Using supplemented DMEM and TE, lift and plate cells in a 35 mm cell culture dish so that they are 50–80% confluent the following day
Day 2
-
2
Using DMEM and NanoJuice transfect cells with the vector(s) containing your photoswitch according to the NanoJuice protocol.
-
3
4–6 hr later wash cells with PBS and change supplemented DMEM
Day 3
-
4
Coat glass area of MatTek dish with 1ml of 10 μg/ml fibronectin
-
5
Incubate cover slip for 1hr at 37° C
-
6
Wash dish with PBS
-
7
Using TE, lift transfected cells and triturate gently with pipette to separate cells.
-
8
Plate cells on coated MatTek dish with 3 ml of supplemented DMEM at ~10% confluency so that individual cells can be imaged the next day.
Day 4
Using the FV1000 and accompanying fluoview software image and activate the cells using the following suggested settings as a good starting point. Figure 4C represents the light path used in most experiments. While the excitation filter is not specific for 515 nm light it allows enough to pass in order to excite the mVenus fluorophore. Activate the cells using the 488 nm laser line and image them with the 515 nm and 559 nm laser as to not activate the LOV2 domain while imaging (Caution: while low power excitation with the 515 nm laser does not activate the LOV2 domain we have noticed that use at higher power produces low levels of activation). There is always a trade off between speed and image quality while imaging. Collecting an 800 × 800 pixel image with a 2 μs/pixel dwell time without averaging provides an image with enough signal to quantify while being sufficiently fast to measure the kinetics of your switch. To increase the signal while maintaining speed, the pinhole can be opened wider. However, this will decrease confocality of your image. Using the Time Controller module in the Fluoview software design a timeline of imaging and activation. Table 3 represents a timeline in which a 60 × 60 region of interest (ROI) is activated followed by an 800 × 800 image aquisition. This is repeated in order to measure activation over time. The sample is then repeatedly imaged without activation in order to measure the kinetics of inactivation. For membrane localization a 60 × 60 pixel ROI is chosen near the edge of a cell where the thickness is relatively uniform so that volume artifacts are avoided during quantification and the cytoplasmic background signal is lower. For whole cell activation the ROI can be expanded but keep in mind this will lengthen the time between images, as the activation time will be extended. At the end of an experiment, images collected can be appended together using the Append module in the Fluoview software.
Table 3.
Imaging timeline
| Repeat 50× (Total Time = 10 s) | ||||
|---|---|---|---|---|
| Imaging Pre-Activation | Activation | Imaging Activation | Imaging Post Activation | |
| Timing | 5 scans, 1 every 10 s | 10 scans, as fast as possible | 1 image | 50 images, 1 every 10 s |
| Size (pixels) | 800 × 800 | 60 × 60 | 800 × 800 | 800 × 800 |
| Lasers and Power | 5% – 515 and 5% – 559 nm | 1% – 488 nm | 5% – 515 and 5% – 559 nm | 5% – 515 and 5% – 559 nm |
| Pixel Dwell Time | 2 μs/pixel | 8 μs/pixel | 2 μs/pixel | 2 μs/pixel |
3.2 Image Analysis
Many of the switches previously engineered function through translocation. In these cases microscopy and image analysis can be a useful method to verify and compare the function of the photoswitches. To quantify the translocation within a cell the FIJI software package (Schindelin et al., 2012) provides many useful tools and allows you to string them together using its macro function so that analysis is automated. In Hallett et. al. the translocation of the iLID switch from the cytoplasm to the mitochondria of a cell is quantified in this way. The analysis consists of 4 steps (Fig. 5).
Figure 5.
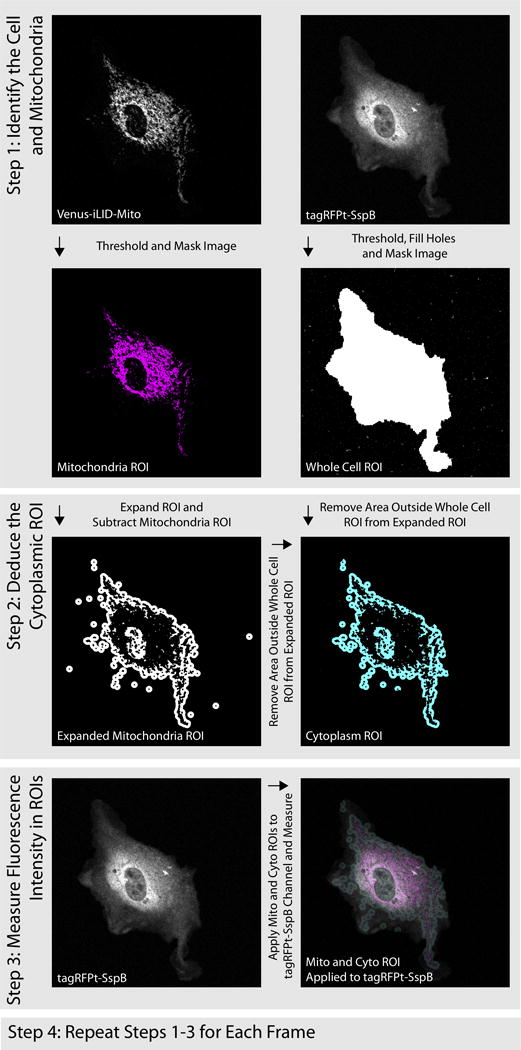
Image analysis schematic for quantification of Mitochondrial/Cytoplasmic Fluorescence intensity.
For each cell imaged collect 2 channels; Venus-iLID-Mito (acts as a mitochondria label) tagRFPt-SspB
Identify the cell and mitochondria - Threshold tagRFPT and Venus channels to create ROIs that demarcate the entire cell and the mitochondria respectively.
Deduce a cytoplasmic ROI - Create a cytoplasmic ROI by extending the mitochondrial ROI by 10 pixels. Then remove the pixels that represent the mitochondria and any pixels that extend outside of the cell body.
Measure the average tagRFPt fluorescence intensity in the mitochondria and cytoplasm ROIs
Repeat steps 1–3 for every image in the series
The supplement contains a macro script that was used to perform this analysis.
3.3 Functional assays
LOV2-based photoswitches could be used in a number of applications for the study of the kinetics of a given process or simply for the rapid activation of a desired signaling pathway. One of the most common biological processes rendered under control of light is transcription. Here, we describe the set-ups and experimental procedure for the blue light activation of transcription (Fig. 4D).
3.3.1 Yeast transcription using photoswitch for light induced dimerization
Equipment and materials
-
1
Matchmaker Gold Yeast Two-Hybrid Kit (Clontech)
Protocol
Clone and sequence verify the two parts of the light inducible dimerizer into pGBKT7 and pGADT7 plasmids
Transform the plasmids in Y2HGold and Y187 yeast strains respectively selecting for their auxotrophic selection
Combine a single colony of each in 0.5 mL YPD culture overnight for mating
Pellet and plate on double dropout plates
Select single colony and inoculate 5 mL double dropout media culture over night
Next morning use the overnight for setting a 5 mL culture at OD600 = 0.2 which is then split into two 2.5 mL cultures for dark and blue light treatment (465 nm LED of 0.5–1 mW/cm3) in a shaking incubator at 30°C for 4 hours. The dark state tube is wrapped in aluminum foil to ensure dark condition.
Take three aliquots of 600 μL from each culture and pellet them. Cultures could be frozen at −20°C at this point for testing at a later time.
Perform β-galactosidase assay to test the functionality of the light inducible dimerization.
3.3.2 Tissue Culture Illumination Setup
For many experiments it is necessary to illuminate an entire culture dish or multi well dish in order to obtain enough material to properly perform the experiment. In such cases it is important to evenly illuminate your samples while maintaining the necessary growth conditions for your cultures. For these experiments we have designed a 72× 465 nm LED array with an adjustable rack that holds a standard sized tissue culture plate (Fig. 4A). The LEDs are powered through a 9 V and 2 Amp power supply with timing and intensity controlled through an Arduino board. The LEDs are arranged under the rack to match the pattern of a 24-well plate. However, the rack height is fully adjustable by thumbscrew so that the array can evenly illuminate any dish. This apparatus easily fits within a standard tissue culture incubator so that cells can be grown under blue light with optimal temperature, CO2, and humidity (Fig. 4D).
4 Summary and Perspectives
Here we described the process of engineering a LOV2-based photoswitch. There are several steps in the rational design of such a switch, which all ultimately fall into an iterative process of trial and error. We have summarized successful strategies and provided protocols for validation and high throughput library based screening for evolved variants of such photoswitches. We have provided protocols for the test of switches via microscopy for single cells as well as entire organisms. Finally, details are provided for example applications in yeast and tissue culture. We expect that the number of cellular optogenetic tools based on Avena sativa LOV2 will continue to grow in the upcoming years.
Supplementary Material
References
- Baarlink C, Wang H, Grosse R. Nuclear actin network assembly by formins regulates the SRF coactivator MAL. Science. 2013;340(6134):864–867. doi: 10.1126/science.1235038. [DOI] [PubMed] [Google Scholar]
- Bugaj LJ, Spelke DP, Mesuda CK, Varedi M, Kane RS, Schaffer DV. Regulation of endogenous transmembrane receptors through optogenetic Cry2 clustering. Nat Commun. 2015;6:6898. doi: 10.1038/ncomms7898. [DOI] [PMC free article] [PubMed] [Google Scholar]
- Cheng KP, Kiernan EA, Eliceiri KW, Williams JC, Watters JJ. Blue Light Modulates Murine Microglial Gene Expression in the Absence of Optogenetic Protein Expression. Sci Rep. 2016;6:21172. doi: 10.1038/srep21172. [DOI] [PMC free article] [PubMed] [Google Scholar]
- Christie JM, Corchnoy SB, Swartz TE, Hokenson M, Han IS, Briggs WR, Bogomolni RA. Steric interactions stabilize the signaling state of the LOV2 domain of phototropin 1. Biochemistry. 2007;46(32):9310–9319. doi: 10.1021/bi700852w. [DOI] [PubMed] [Google Scholar]
- Crooks GE, Hon G, Chandonia JM, Brenner SE. WebLogo: a sequence logo generator. Genome Res. 2004;14(6):1188–1190. doi: 10.1101/gr.849004. [DOI] [PMC free article] [PubMed] [Google Scholar]
- Crosson S, Moffat K. Structure of a flavin-binding plant photoreceptor domain: insights into light-mediated signal transduction. Proc Natl Acad Sci U S A. 2001;98(6):2995–3000. doi: 10.1073/pnas.051520298. [DOI] [PMC free article] [PubMed] [Google Scholar]
- DeLisa MP, Tullman D, Georgiou G. Folding quality control in the export of proteins by the bacterial twin-arginine translocation pathway. Proc Natl Acad Sci U S A. 2003;100(10):6115–6120. doi: 10.1073/pnas.0937838100. [DOI] [PMC free article] [PubMed] [Google Scholar]
- Guntas G, Hallett RA, Zimmerman SP, Williams T, Yumerefendi H, Bear JE, Kuhlman B. Engineering an improved light-induced dimer (iLID) for controlling the localization and activity of signaling proteins. Proc Natl Acad Sci U S A. 2015;112(1):112–117. doi: 10.1073/pnas.1417910112. [DOI] [PMC free article] [PubMed] [Google Scholar]
- Halavaty AS, Moffat K. N- and C-terminal flanking regions modulate light-induced signal transduction in the LOV2 domain of the blue light sensor phototropin 1 from Avena sativa. Biochemistry. 2007;46(49):14001–14009. doi: 10.1021/bi701543e. [DOI] [PubMed] [Google Scholar]
- Hallett RA, Zimmerman SP, Yumerefendi H, Bear JE, Kuhlman B. Correlating in Vitro and in Vivo Activities of Light-Inducible Dimers: A Cellular Optogenetics Guide. ACS Synth Biol. 2016;5(1):53–64. doi: 10.1021/acssynbio.5b00119. [DOI] [PMC free article] [PubMed] [Google Scholar]
- Harper SM, Neil LC, Gardner KH. Structural basis of a phototropin light switch. Science. 2003;301(5639):1541–1544. doi: 10.1126/science.1086810. [DOI] [PubMed] [Google Scholar]
- Kawano F, Aono Y, Suzuki H, Sato M. Fluorescence imaging-based high-throughput screening of fast- and slow-cycling LOV proteins. PLoS One. 2013;8(12):e82693. doi: 10.1371/journal.pone.0082693. [DOI] [PMC free article] [PubMed] [Google Scholar]
- Kennedy MJ, Hughes RM, Peteya LA, Schwartz JW, Ehlers MD, Tucker CL. Rapid blue-light-mediated induction of protein interactions in living cells. Nat Methods. 2010;7(12):973–975. doi: 10.1038/nmeth.1524. [DOI] [PMC free article] [PubMed] [Google Scholar]
- Levskaya A, Weiner OD, Lim WA, Voigt CA. Spatiotemporal control of cell signalling using a light-switchable protein interaction. Nature. 2009;461(7266):997–1001. doi: 10.1038/nature08446. [DOI] [PMC free article] [PubMed] [Google Scholar]
- Liu H, Yu X, Li K, Klejnot J, Yang H, Lisiero D, Lin C. Photoexcited CRY2 interacts with CIB1 to regulate transcription and floral initiation in Arabidopsis. Science. 2008;322(5907):1535–1539. doi: 10.1126/science.1163927. [DOI] [PubMed] [Google Scholar]
- Lungu OI, Hallett RA, Choi EJ, Aiken MJ, Hahn KM, Kuhlman B. Designing photoswitchable peptides using the AsLOV2 domain. Chem Biol. 2012;19(4):507–517. doi: 10.1016/j.chembiol.2012.02.006. [DOI] [PMC free article] [PubMed] [Google Scholar]
- Mart RJ, Meah D, Allemann RK. Photocontrolled Exposure of Pro-apoptotic Peptide Sequences in LOV Proteins Modulates Bcl-2 Family Interactions. Chembiochem. 2016;17(8):698–701. doi: 10.1002/cbic.201500469. [DOI] [PMC free article] [PubMed] [Google Scholar]
- Nash AI, Ko WH, Harper SM, Gardner KH. A conserved glutamine plays a central role in LOV domain signal transmission and its duration. Biochemistry. 2008;47(52):13842–13849. doi: 10.1021/bi801430e. [DOI] [PMC free article] [PubMed] [Google Scholar]
- Ni M, Tepperman JM, Quail PH. Binding of phytochrome B to its nuclear signalling partner PIF3 is reversibly induced by light. Nature. 1999;400(6746):781–784. doi: 10.1038/23500. [DOI] [PubMed] [Google Scholar]
- Nikolovska-Coleska Z, Wang R, Fang X, Pan H, Tomita Y, Li P, Wang S. Development and optimization of a binding assay for the XIAP BIR3 domain using fluorescence polarization. Anal Biochem. 2004;332(2):261–273. doi: 10.1016/j.ab.2004.05.055. [DOI] [PubMed] [Google Scholar]
- Niopek D, Benzinger D, Roensch J, Draebing T, Wehler P, Eils R, Di Ventura B. Engineering light-inducible nuclear localization signals for precise spatiotemporal control of protein dynamics in living cells. Nat Commun. 2014;5:4404. doi: 10.1038/ncomms5404. [DOI] [PMC free article] [PubMed] [Google Scholar]
- Niopek D, Wehler P, Roensch J, Eils R, Di Ventura B. Optogenetic control of nuclear protein export. Nat Commun. 2016;7:10624. doi: 10.1038/ncomms10624. [DOI] [PMC free article] [PubMed] [Google Scholar]
- Packer MS, Liu DR. Methods for the directed evolution of proteins. Nat Rev Genet. 2015;16(7):379–394. doi: 10.1038/nrg3927. [DOI] [PubMed] [Google Scholar]
- Renicke C, Schuster D, Usherenko S, Essen LO, Taxis C. A LOV2 domain-based optogenetic tool to control protein degradation and cellular function. Chem Biol. 2013;20(4):619–626. doi: 10.1016/j.chembiol.2013.03.005. [DOI] [PubMed] [Google Scholar]
- Schindelin J, Arganda-Carreras I, Frise E, Kaynig V, Longair M, Pietzsch T, Cardona A. Fiji: an open-source platform for biological-image analysis. Nat Methods. 2012;9(7):676–682. doi: 10.1038/nmeth.2019. [DOI] [PMC free article] [PubMed] [Google Scholar]
- Spiltoir JI, Strickland D, Glotzer M, Tucker CL. Optical Control of Peroxisomal Trafficking. ACS Synth Biol. 2015 doi: 10.1021/acssynbio.5b00144. [DOI] [PMC free article] [PubMed] [Google Scholar]
- Steiner D, Forrer P, Stumpp MT, Plückthun A. Signal sequences directing cotranslational translocation expand the range of proteins amenable to phage display. Nat Biotechnol. 2006;24(7):823–831. doi: 10.1038/nbt1218. [DOI] [PubMed] [Google Scholar]
- Strickland D, Lin Y, Wagner E, Hope CM, Zayner J, Antoniou C, Glotzer M. TULIPs: tunable, light-controlled interacting protein tags for cell biology. Nat Methods. 2012;9(4):379–384. doi: 10.1038/nmeth.1904. [DOI] [PMC free article] [PubMed] [Google Scholar]
- Strickland D, Yao X, Gawlak G, Rosen MK, Gardner KH, Sosnick TR. Rationally improving LOV domain-based photoswitches. Nat Methods. 2010;7(8):623–626. doi: 10.1038/nmeth.1473. [DOI] [PMC free article] [PubMed] [Google Scholar]
- Taslimi A, Vrana JD, Chen D, Borinskaya S, Mayer BJ, Kennedy MJ, Tucker CL. An optimized optogenetic clustering tool for probing protein interaction and function. Nat Commun. 2014;5:4925. doi: 10.1038/ncomms5925. [DOI] [PMC free article] [PubMed] [Google Scholar]
- Wu YI, Frey D, Lungu OI, Jaehrig A, Schlichting I, Kuhlman B, Hahn KM. A genetically encoded photoactivatable Rac controls the motility of living cells. Nature. 2009;461(7260):104–108. doi: 10.1038/nature08241. [DOI] [PMC free article] [PubMed] [Google Scholar]
- Yi JJ, Wang H, Vilela M, Danuser G, Hahn KM. Manipulation of Endogenous Kinase Activity in Living Cells Using Photoswitchable Inhibitory Peptides. ACS Synth Biol. 2014 doi: 10.1021/sb5001356. [DOI] [PMC free article] [PubMed] [Google Scholar]
- Yumerefendi H, Dickinson DJ, Wang H, Zimmerman SP, Bear JE, Goldstein B, Kuhlman B. Control of Protein Activity and Cell Fate Specification via Light-Mediated Nuclear Translocation. PLoS One. 2015;10(6):e0128443. doi: 10.1371/journal.pone.0128443. [DOI] [PMC free article] [PubMed] [Google Scholar]
- Yumerefendi H, Lerner AM, Zimmerman SP, Hahn K, Bear JE, Strahl BD, Kuhlman B. Light-induced nuclear export reveals rapid dynamics of epigenetic modifications. Nat Chem Biol. 2016 doi: 10.1038/nchembio.2068. [DOI] [PMC free article] [PubMed] [Google Scholar]
- Zayner JP, Antoniou C, Sosnick TR. The amino-terminal helix modulates light-activated conformational changes in AsLOV2. J Mol Biol. 2012;419(1–2):61–74. doi: 10.1016/j.jmb.2012.02.037. [DOI] [PMC free article] [PubMed] [Google Scholar]
- Zayner JP, Sosnick TR. Factors that control the chemistry of the LOV domain photocycle. PLoS One. 2014;9(1):e87074. doi: 10.1371/journal.pone.0087074. [DOI] [PMC free article] [PubMed] [Google Scholar]
- Zoltowski BD, Vaccaro B, Crane BR. Mechanism-based tuning of a LOV domain photoreceptor. Nat Chem Biol. 2009;5(11):827–834. doi: 10.1038/nchembio.210. [DOI] [PMC free article] [PubMed] [Google Scholar]
Associated Data
This section collects any data citations, data availability statements, or supplementary materials included in this article.