Abstract
Background
The probability of liver transplant and death on the waiting list in the United States varies greatly by donation service area (DSA) due to geographic differences in availability of organs and allocation of priority points, making it difficult for providers to predict likely outcomes after listing. We aimed to develop an online calculator to report outcomes by region and patient characteristics.
Methods
Using the Scientific Registry of Transplant Recipients database, we included all prevalent US adults aged 18 years or older waitlisted for liver transplant, examined on 24 days at least 30 days apart over a 2-year period. Outcomes were determined at intervals of 30 to 365 days. Outcomes are reported by transplant program, DSA, region, and the nation for comparison, and can be shown by allocation or by laboratory model for end-stage liver disease (MELD) score (6–14, 15–24, 25–29, 30–34, 35–40), age, and blood type.
Results
Outcomes varied greatly by DSA; for candidates with allocation MELD 25–29, the 25th and 75th percentiles of liver transplant probability were 30% and 67%, respectively, at 90 days. Corresponding percentiles for death or becoming too sick to undergo transplant were 5% and 9%. Outcomes also varied greatly for candidates with and without MELD exception points.
Conclusions
The waitlist outcome calculator highlights ongoing disparities in access to liver transplant, and may assist providers in understanding and counseling their patients about likely outcomes on the waiting list.
Introduction
Liver transplant is a life-saving treatment for many patients with irreversible liver disease; however, 1767 candidates in the United States died while on the waiting list in 2013 and an additional 1223 candidates were removed from the list because they were too sick to undergo transplant.1 Mortality on the liver transplant waiting list is strongly correlated with disease severity, calculated using the model for end-stage liver disease (MELD) score.2–4 Since 2002, US candidates have been prioritized on the liver transplant waiting list by the Organ Procurement and Transplantation Network (OPTN) according to their MELD scores. OPTN operates under a federal contract and includes all US transplant programs and organ procurement organizations as members. Allocation by MELD score is an attempt to equitably allocate deceased donor livers according to standardized medical criteria,5 but these scarce resources continue to be allocated in a system that attempts to give them to the sickest local candidates before offering them to a broader geographic area (http://www.unos.org/docs/Liver_patient.pdf).
Implementation of the MELD allocation system in the United States resulted in an overall increase in the mean MELD score at the time of transplant and decreases in waitlist mortality rates and in numbers of patients removed from the list due to being too sick to undergo transplant. Furthermore, these benefits occurred without a corresponding decrease in posttransplant survival.6–9 However, regional variation in waitlist outcomes persists, including in average MELD score at transplant and risk of delisting due to death or becoming too sick.8;10–14 Use of MELD score exceptions also varies by region.15 MELD exceptions are given by OPTN to candidates whose MELD scores do not adequately reflect the medical need for transplant, most commonly for hepatocellular carcinoma (HCC) (http://www.unos.org/docs/Liver_patient.pdf), resulting in an allocation MELD score higher than the laboratory MELD score. Outcomes for candidates with a given allocation MELD score differ greatly for those with and without exception points.15 These variations in availability of organs and in use of MELD exception scores make it difficult for individual patients and their providers to understand the likely outcomes specific to their geographic areas while on the liver transplant waiting list, or how these outcomes compare with the nation and other regions.
Several possible mutually exclusive outcomes can occur for patients on the liver transplant waiting list: 1) deceased donor liver transplant, 2) living donor liver transplant, 3) death or removal from the waiting list due to deteriorating medical condition, 4) removal from the list due to improved condition such that transplant is no longer needed, 5) removal from the list for other reasons, or 6) remaining on the waiting list. We created an online calculator (http://tools.srtr.org/LiverWaitCalc_V4/) to help liver transplant providers understand possible outcomes at different time points in the coming year based on the candidate’s blood type, age, current allocation or laboratory MELD score, and geographic location.
Materials and Methods
This study used data from the Scientific Registry of Transplant Recipients (SRTR). The SRTR data system includes data on all donors, waitlisted candidates, and transplant recipients in the US, submitted by the members of OPTN, and has been described elsewhere.16 The Health Resources and Services Administration, US Department of Health and Human Services, provides oversight of the activities of the OPTN and SRTR contractors.
Study Population
We included all adults (aged 18 years or older) active on the liver transplant waiting list on any of 24 specific days between September 2012 and July 2014. Status 1A candidates were excluded as they do not use the MELD allocation system, as described below. Patients listed for multi-organ transplant were also excluded.
Analytical Approach
The online calculator was built to show possible outcomes from any day on the waiting list, not only from the candidate’s first day. A candidate’s priority on the list was determined by the MELD score, calculated from serum creatinine, bilirubin, and international normalized ratio values, and by whether the candidate received dialysis within the past week. These factors resulted in a measured, or laboratory, MELD score. In addition, some candidates were awarded MELD exception priority points due to other underlying conditions that warrant additional priority (eg HCC, primary hyperoxaluria, hepatopulmonary syndrome), resulting in an allocation MELD score that may differ from the laboratory MELD score. MELD scores were grouped into categories: 6–14, 15–24, 25–29, 30–34, and 35–40. Because there is no requirement for programs to update the laboratory MELD once exceptions are granted, the reliability of these candidates’ laboratory MELD scores is suspect. Therefore, the calculator allows selection of results for only candidates with exceptions, only candidates without exceptions, or all candidates within the allocation MELD range.
The calculator uses actual historical data from 2013–2015 to derive the outcomes. Because actual results are reported rather than statistical modeling, confidence intervals or statistical significance testing is not indicated. All candidates on the national liver transplant waiting list were examined on 24 separate days within a 2-year period, each about 30 days apart. Candidates were followed for 30, 60, 90, 180, or 365 days to observe outcomes. As the 24 observation days were all more than 30 days apart, all candidates on the list on any of the 24 observation days were used to derive the 30-day estimates. Overlapping dates were subsequently removed for longer follow-up times. For example, only candidates on the list on March 18, 2013, September 20, 2013, March 25, 2014, and September 27, 2014, were included in the 180-day estimates (each of these 4 days is at least 180 days from the others), and only candidates on the list on March 18, 2013, and March 25, 2014, were included in the 365-day estimates (each of these 2 days is at least 365 days from the other) (Table 1). Candidates listed at multiple programs were included separately, as if they were different candidates; however, a transplant event was counted only toward the area in which it took place, eg program, DSA, or region. Thus, for a candidate listed at a program in New York and at a program in Washington, DC, who underwent transplant in Washington, DC, the calculator counted the transplant toward the Washington, DC, program, DSA, and region. The outcomes were determined based on a candidate’s MELD score at the time the list was sampled; if a candidate’s MELD score changed at any time after the sampled date, only the MELD score on the sampled date was used. Outcomes are presented as counts and percentages of all candidates meeting the selection criteria (blood type [optional], age group [optional], and MELD score range).
Table 1.
Sampling dates for the current calculator
| Date Sampled | 30-Day | 60-Day | 90-Day | 180-Day | 365-Day |
|---|---|---|---|---|---|
| March 18, 2013 | X | X | X | X | X |
| April 18, 2013 | X | ||||
| May 19, 2013 | X | X | |||
| June 19, 2013 | X | X | |||
| July 20, 2013 | X | X | |||
| August 20, 2013 | X | ||||
| September 20, 2013 | X | X | X | X | |
| October 21, 2013 | X | ||||
| November 21, 2013 | X | X | |||
| December 22, 2013 | X | X | |||
| January 22, 2014 | X | X | |||
| February 22, 2014 | X | ||||
| March 25, 2014 | X | X | X | X | X |
| April 25, 2014 | X | ||||
| May 26, 2014 | X | X | |||
| June 26, 2014 | X | X | |||
| July 27, 2014 | X | X | |||
| August 27, 2014 | X | ||||
| September 27, 2014 | X | X | X | X | |
| October 28, 2014 | X | ||||
| November 28, 2014 | X | X | |||
| December 29, 2014 | X | X | |||
| January 29, 2015 | X | X | |||
| March 1, 2015 | X |
Note: In order to create nonoverlapping observation windows for the varying outcomes studied, only certain days are included in the estimates for the various timeframes as shown in the table. Sampling dates will be updated quarterly as the calculator is updated.
The calculator reports estimated outcomes at the following geographic levels:
Transplant program: Outcomes for candidates listed at the selected program.
DSA: A geographic region served by 1 of the 58 organ procurement organizations. Some DSAs have more than 1 transplant program.
OPTN region: There are 11 in the United States.
National: All transplant programs in the OPTN system.
The calculator provides data for the 4 geographic levels so users can compare outcomes at the program and in the DSA, the broader OPTN region, and the nation as a whole. For some subsets, the numbers of candidates may be too small to allow for good estimates of outcomes. Data will be suppressed for any geographic area that includes fewer than 5 candidates. In these cases, data may be sufficient to allow estimates to be derived at the next larger geographic level, such as the DSA, the OPTN region, or the nation. The calculator will be updated quarterly to ensure that the most recent data are used to provide estimates.
Results
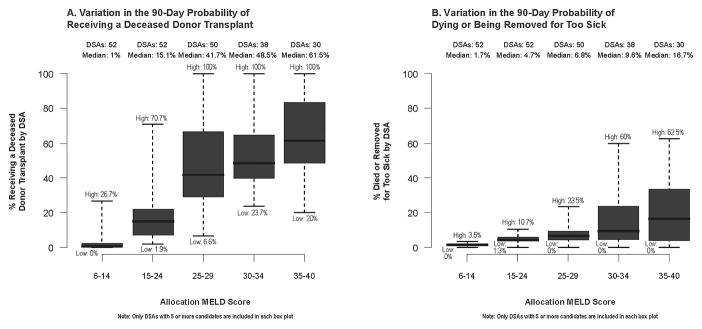
Waiting list outcomes varied greatly by DSA (Figure 1). For the 90-day outcome of undergoing deceased donor transplant for candidates with an allocation MELD score of 25–29, the 25th and 75th percentiles of the probability within the DSA were 30% and 67%, respectively, with a total range from 6.6% to 100% across DSAs. Similarly, the 25th and 75th percentiles of the probability of death or removal from the list due to deteriorating medical condition for candidates with an allocation MELD score of 25–29 were 5% and 9%, with an overall range of 0% to 23.5% across DSAs. (Note: only DSAs with 5 or more candidates in the MELD category were included in these summaries.) The number of candidates with high allocation MELD scores differed greatly from the number with high laboratory MELD scores: nationally, 6587 sampled candidates had an allocation MELD score of 30–34, while only 1775 candidates had a laboratory MELD score in that range.
Figure 1.
Variation in 90-day probabilities of undergoing deceased donor transplant (panel A) or dying or being removed from the list due to becoming too sick to undergo transplant (panel B) by DSA. DSA, donation service area; MELD, model for end-stage liver disease.
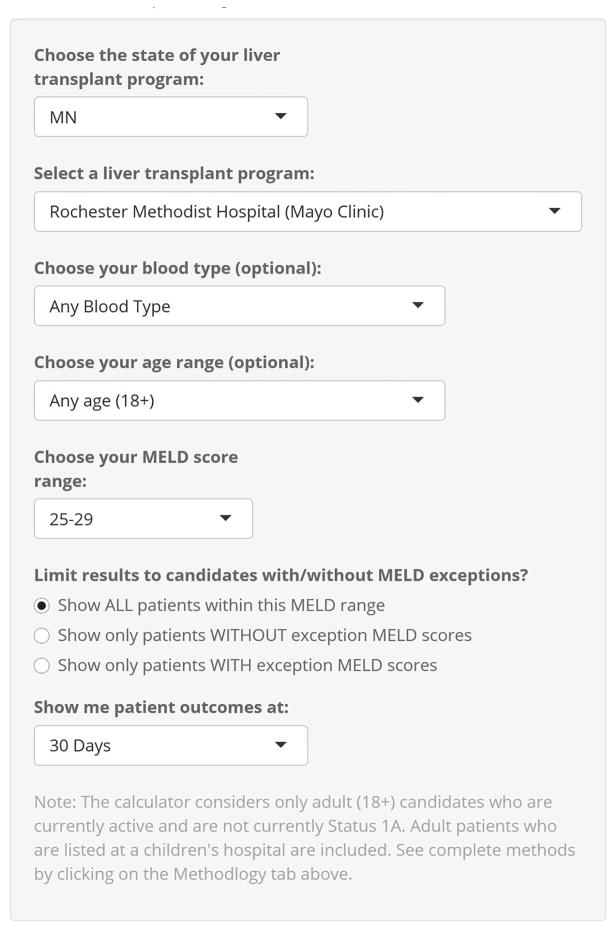
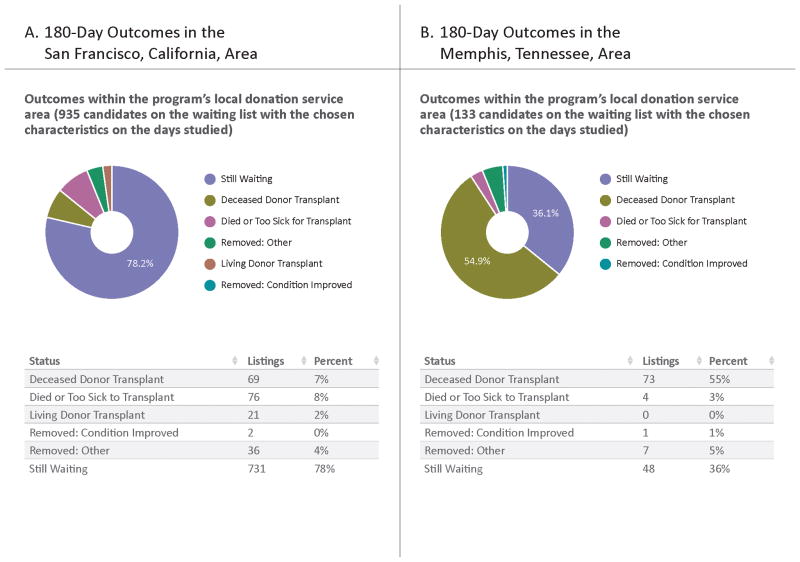
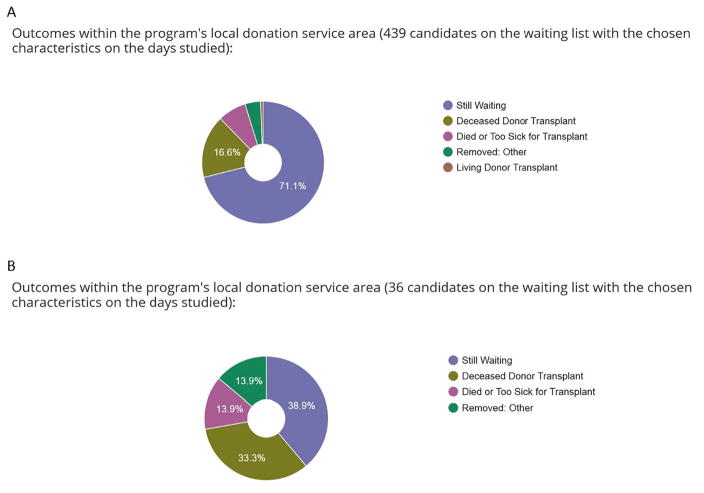
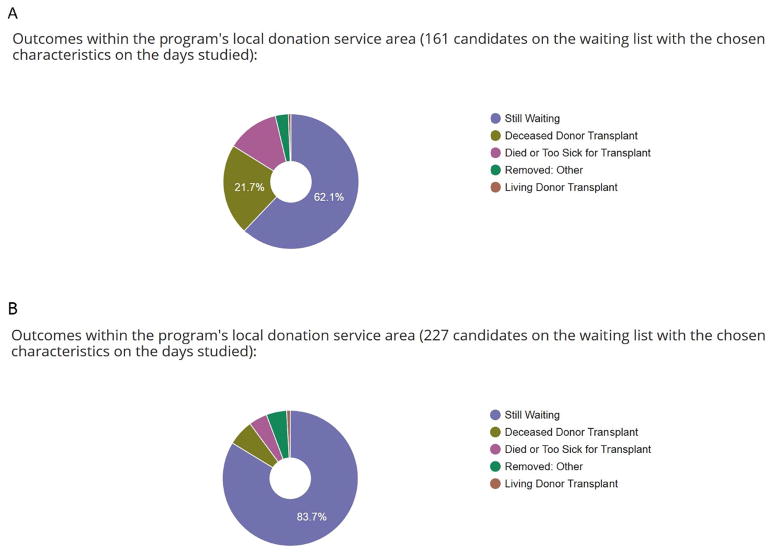
To view outcomes in the calculator, users select a state, a transplant program, and the desired length of follow-up, and they may specify age and blood type. In addition, users select whether to view outcomes for candidates with exceptions or without exceptions, or for all candidates in the allocation MELD score category (Figure 2). Once patient characteristics and length of follow-up have been selected, the calculator’s output can be displayed in graphical or tabular format (counts and percentages for each outcome). Users can change the transplant program selection while leaving other characteristics unchanged to examine regional differences in the probability of different outcomes. Screen shots of the calculator output comparing 2 regions without changing patient variables are shown in Figure 3; output comparing outcomes for patients with a MELD score of 25–29 with versus without exception points, and with blood type O versus blood type A, is shown in Figures 4 and 5, respectively.
Figure 2.
Data entry options.
Figure 3.
Outcomes for an adult transplant candidate in the San Francisco, California, donation service area (panel A) and the Memphis, Tennessee, donation service area (panel B) at 180 days. Data provided by the online calculator based on input of allocation MELD score 15–24, regardless of age or blood type.
Figure 4.
Outcomes for an adult transplant candidate in the San Francisco, California, donation service area with MELD 24–29 at 180 days with (panel A) and without (panel B) exception points, of any age or blood type.
Figure 5.
Outcomes for an adult transplant candidate in the San Francisco, California, donation service area with MELD 24–29 at 180 days of any age with blood type A (panel A) and O (panel B).
The calculator sample size varies depending on the variables and follow-up period selected; for example, for the outcomes for all liver transplant candidates with an allocation MELD score of 25–29 in the US at 30 days, 27,060 candidates are represented in the calculator output; for all candidates in the US with an allocation MELD of 35–40, 1872 candidates are represented. Conversely, for outcomes at a single transplant center, selection of specific age groups, MELD category, and blood type may result in suppressed output due to fewer than 5 such candidates meeting the criteria available during that time period. The number of candidates for each outcome is indicated in the calculator output.
Discussion
We provide a simple online calculator for liver transplant candidates and their providers to predict what may happen in the coming year on the liver transplant waiting list. This calculator reflects all the possible but mutually exclusive (or competing) outcomes on the list, especially as severity of illness as reflected by MELD score increases.17 The calculator will be updated quarterly to reflect the most recent outcomes, ensuring that it remains relevant in a changing clinical landscape. For example, the Share-35 policy implemented in June 2013 decreased waitlist mortality for candidates with MELD scores ≥ 30 by 30%,18 an outcome reflected in the most current version of the calculator.
The profound survival benefit derived from liver transplant, combined with an ongoing organ shortage, makes the communication of likely outcomes and options for liver transplant candidates critical. Communicating risks and benefits to patients is fundamental to patient-centered care and informed decision making. The development of a robust, up-to-date calculator makes truly informed decision making more possible; indeed, the Institute of Medicine has called for the development and dissemination of high-quality patient communication tools to improve engagement in shared decision making.19
In agreement with previous studies, the calculator highlights significant regional differences in outcomes for patients with similar characteristics, such as disease severity; for example, the 90-day outcome of undergoing deceased donor transplant with an allocation MELD score of 25–29 ranged from 7% to 100% across all DSAs. Before 2002, waiting time and many subjective measures of disease severity played a central role in liver allocation, resulting in large regional differences in transplant rates and in candidates with more rapidly progressive disease dying on the list while more stable patients underwent transplant.5 As evidence mounted that waiting time was not associated with waitlist mortality,20 the Department of Health and Human Services adopted the Final Rule in 1998 to establish the guideline that organs should be allocated in order of medical urgency.21 This prompted the adoption of the MELD allocation system, a medical triage system meant to ensure equitable allocation of organs and to minimize the “accident of geography” as a determinant of transplant access.5 However, organs continue to be generally allocated in a local, then regional, then national pattern due to concerns about efficient management of organ placement and ischemia time. After adoption of the MELD allocation system, investigators reported early recognition of ongoing regional disparities, suggesting that while the MELD system may accurately predict pretransplant mortality, it did not ensure equitable organ distribution.8 In 2003, Schaffer et al reviewed data from 1 of the 11 OPTN regions and found significantly different MELD scores at the time of transplant among DSAs.10 The following year, Trotter et al reported differences in MELD scores at the time of transplant between small and large organ procurement organizations; they found that fewer recipients in smaller organ procurement organizations had severe disease as defined by a MELD score greater than 24.11 Later studies reflecting more experience with the MELD allocation system continued to report findings such as higher likelihood of removal from the list due to deteriorating condition in some DSAs in 1 OPTN region,13 and larger follow-up studies using national data confirmed regional differences in MELD scores and waiting times at the time of transplant.14;22 The ability to provide region-specific information is therefore critical for a useful liver transplant waitlist calculator. Use of the SRTR database and incorporation of regional information ensures that this calculator is relevant to candidates throughout the country. By providing data at various geographic levels, we also allow comparisons with outcomes in other regions and in the nation, potentially informing decisions about where to pursue listing if multiple listing is feasible.
By providing the ability to view outcomes for candidates with or without exceptions, this calculator allows users to find the information that is most relevant to a given candidate. Exception points, resulting in a higher allocation MELD score, are associated with both decreased waitlist mortality and increased likelihood of transplant compared with no exception points and a laboratory MELD score identical to the allocation MELD score.15 Massie et al demonstrated that in addition to geographic variations in waitlist mortality and outcomes, large geographic differences exist in the use and allocation of exception points.15 Unfortunately, these differences make it potentially difficult for providers of individual candidates to predict how the allocation MELD score might differ across programs. In addition, the accuracy of these candidates’ laboratory MELD scores is uncertain, as candidates with exception points are not required to recertify their laboratory MELD scores. Given the differences in outcomes between candidates with and without exception points, as well as the geographic variability in the use of exceptions, it is important that any prediction calculator account for these variations.
While this calculator provides valuable information to candidates and providers, it has important limitations. As with any risk predictor, our online calculator can provide information based only on what happened recently to similar candidates; in a clinically useful calculator, the number of variables included is limited. However, because this calculator uses actual patient data from the prior 2 years, adding too many specific variables would increase the chances of data suppression due to an insufficient number of patients similar to the candidate in question. Similarly, data from smaller regions (including programs) are more likely to be insufficient to report in the calculator; increasing the time from which the calculator draws data would decrease this likelihood, but at the expense of relevance to the current era. Alternatively, statistical models could be developed to estimate likely outcomes at a more granular level of candidate characteristics, but the very small sample sizes would produce such large confidence intervals that the accuracy and therefore usefulness of such a prediction would be suspect. In addition, modeled estimates may be difficult to apply at the program or DSA level since not all programs accept all types of candidates and programs may have different listing practices. For these reasons, we believe that a calculator using actual historical data is valuable in this context.
Another important limitation of any calculator to predict waitlist outcomes involves the use of the MELD score as a predictor. This variable is complicated by differences in waitlist outcomes between candidates with and without exception points; we have attempted to improve the transparency of these differences by giving users the option of selecting and comparing outcomes of those with or without exception points, but a discussion between transplant providers and candidates about how the results apply to an individual remains important. For candidates with exception points, the outcomes of other candidates with exception points are likely more relevant, whereas for candidates without exception points the allocation MELD score reflects a greater likelihood of dying on the list, and outcomes of other candidates without exception points are more relevant. Similarly, this calculator is intended only to provide information about outcomes before liver transplant; it provides no information about posttransplant outcomes. SRTR publishes program-specific reports (http://srtr.org/local_stats.aspx) that present posttransplant outcomes.
Finally, the optimal use of such a calculator and the method of communicating risk to liver transplant candidates is unknown; we have attempted to convey the information clearly, including graphical illustrations, but more research is needed regarding how to best convey risk estimates to liver transplant candidates in particular and to patients in general.23 In addition, the effect of providing this information to liver transplant candidates is unknown. While listing at multiple sites is uncommon, it does occur,24 and previous studies have shown that candidates preferentially list at centers with shorter waiting times when this option and information are available to them.25 We also do not know whether providing information about likely outcomes will cause undue distress or improve informed decision making, and further research is needed regarding how patients and providers use this information.
In conclusion, liver transplant candidate outcomes vary substantially by geographic area and use of exceptions, and our outcome calculator provides information that may be valuable in educating and assisting candidates and their providers in making informed decisions.
Acknowledgments
Funding: This work was conducted under the auspices of the Minneapolis Medical Research Foundation, contractor for the Scientific Registry of Transplant Recipients, as a deliverable under contract no. HHSH250201500009C (US Department of Health and Human Services, Health Resources and Services Administration, Healthcare Systems Bureau, Division of Transplantation). As a US Government-sponsored work, there are no restrictions on its use. The views expressed herein are those of the authors and not necessarily those of the US Government. Dr. Hart was also supported by the National Center for Advancing Translational Sciences in the National Institutes of Health Award Number UL1TR000114. Dr. Israni was also supported by R01 HS 24527. The funding agencies had no direct role in the conduct of the study, the collection, management, analyses and interpretation of the data, or preparation or approval of the manuscript. Dr. Roberts is a member of the UCSF Liver Center, supported by P30 DK026743.
The authors thank Scientific Registry of Transplant colleague Nan Booth, MSW, MPH, ELS, for manuscript editing.
Abbreviations
- DSA
donation service area
- HCC
hepatocellular carcinoma
- MELD
model for end-stage renal disease
- OPTN
Organ Procurement and Transplantation Network
- PELD
pediatric end-stage renal disease
- SRTR
Scientific Registry of Transplant Recipients
Footnotes
Author contributions: Allyson Hart: Conception, analysis, or interpretation of data; drafting the manuscript or critical revision for important intellectual content.
David P. Schladt: Conception, analysis, or interpretation of data; drafting the manuscript or critical revision for important intellectual content; data analysis.
Jessica Zeglin: Conception, analysis, or interpretation of data; drafting the manuscript or critical revision for important intellectual content; data analysis.
Joshua Pyke: Conception, analysis, or interpretation of data; drafting the manuscript or critical revision for important intellectual content; data analysis.
W. Ray Kim: Drafting the manuscript or critical revision for important intellectual content.
John R. Lake: Drafting the manuscript or critical revision for important intellectual content.
John P. Roberts: Drafting the manuscript or critical revision for important intellectual content.
Ryutaro Hirose: Drafting the manuscript or critical revision for important intellectual content.
David C. Mulligan: Drafting the manuscript or critical revision for important intellectual content.
Bertram L. Kasiske: Conception, analysis, or interpretation of data; drafting the manuscript or critical revision for important intellectual content.
Jon J. Snyder: Drafting the manuscript or critical revision for important intellectual content; data analysis.
Ajay K. Israni: Conception, analysis, or interpretation of data; drafting the manuscript or critical revision for important intellectual content.
Disclosures: The authors report no conflicts of interest.
References
- 1.Kim W, Lake J, Smith M, et al. OPTN/SRTR 2013 Annual Data Report: Liver. Am J Transplant. 2015;15(Suppl 2):1–28. doi: 10.1111/ajt.13197. [DOI] [PubMed] [Google Scholar]
- 2.Kamath P, Wiesner R, Malinchoc M, et al. A model to predict survival in patients with end-stage liver disease. Hepatology. 2001;33(2):464–470. doi: 10.1053/jhep.2001.22172. [DOI] [PubMed] [Google Scholar]
- 3.Wiesner R, McDiarmid S, Kamath P, et al. MELD and PELD: Application of survival models to liver allocation. Liver Transpl. 2001;7(7):567–580. doi: 10.1053/jlts.2001.25879. [DOI] [PubMed] [Google Scholar]
- 4.Wiesner R, Edwards E, Freeman R, et al. Model for end-stage liver disease (MELD) and allocation of donor livers. Gastroenterology. 2003;124(1):91–96. doi: 10.1053/gast.2003.50016. [DOI] [PubMed] [Google Scholar]
- 5.Freeman R, Wiesner R, Harper A, et al. The new liver allocation system: Moving toward evidence-based transplantation policy. Liver Transpl. 2002;8(9):851–858. doi: 10.1053/jlts.2002.35927. [DOI] [PubMed] [Google Scholar]
- 6.Wiesner R. Patient selection in an era of donor liver shortage: current US policy. Nat Clin Pract Gastroenterol Hepatol. 2005;2(1):24–30. doi: 10.1038/ncpgasthep0070. [DOI] [PubMed] [Google Scholar]
- 7.Austin M, Poulose B, Ray W, Arbogast P, Feurer I, Wright Pinson C. Model for end-stage liver disease. Arch Surg. 2007;142(11):1079–1085. doi: 10.1001/archsurg.142.11.1079. [DOI] [PubMed] [Google Scholar]
- 8.Freeman R, Wiesner R, Edwards E, Harper A, Merion R, Wolfe R. Results of the first year of the new liver allocation plan. Liver Transpl. 2004;10(1):7–15. doi: 10.1002/lt.20024. [DOI] [PubMed] [Google Scholar]
- 9.Kanwal R, Dulai G, Spiegel B, Yee H, Gralnek I. A comparison of liver transplantation outcomes in the pre- vs. post-MELD eras. Aliment Pharmacol Ther. 2005;21:169–177. doi: 10.1111/j.1365-2036.2005.02321.x. [DOI] [PubMed] [Google Scholar]
- 10.Schaffer R, Kulkarni S, Harper A, Millis J, Cronin D. The sickest first? Disparities with model for end-stage liver disease-based organ allocation: One region’s experience. Liver Transpl. 2003;9(11):1211–1215. doi: 10.1053/jlts.2003.50192. [DOI] [PubMed] [Google Scholar]
- 11.Trotter J, Osgood M. MELD scores of liver transplant recipients according to size of waiting list. Impact of organ allocation and patient outcomes. JAMA. 2004;291(15):1871–1874. doi: 10.1001/jama.291.15.1871. [DOI] [PubMed] [Google Scholar]
- 12.Moylan C, Brady C, Johnson J, Smith A, Tuttle-Newhall J, Muir A. Disparities in liver transplantation before and after introduction of the MELD score. JAMA. 2008;300(20):2371–2378. doi: 10.1001/jama.2008.720. [DOI] [PMC free article] [PubMed] [Google Scholar]
- 13.Barshes N, Becker N, Wahsburn W, Halff G, Aloia T, Goss J. Geographic disparities in deceased donor liver transplantation within a single UNOS region. Liver Transpl. 2007;13(5):747–51. doi: 10.1002/lt.21158. [DOI] [PubMed] [Google Scholar]
- 14.Ahmad J, Bryce C, Cacclarelli T, Roberts M. Differences in access to liver transplantation: Disease severity, waiting time, and transplantation center volume. Ann Intern Med. 2007;146(10):707–713. doi: 10.7326/0003-4819-146-10-200705150-00004. [DOI] [PubMed] [Google Scholar]
- 15.Massie A, Caffo B, Gentry S, et al. MELD Exceptions and Rates of Waiting List Outcomes. Am J Transpl. 2011;11(11):2362–2371. doi: 10.1111/j.1600-6143.2011.03735.x. [DOI] [PMC free article] [PubMed] [Google Scholar]
- 16.Leppke S, Leighton T, Zaun D, et al. Scientific Registry of Transplant Recipients: Collecting, analyzing, and reporting data on transplantation in the United States. Transpl Rev. 2013;27(2):50–56. doi: 10.1016/j.trre.2013.01.002. [DOI] [PubMed] [Google Scholar]
- 17.Kim W, Therneau T, Benson J, et al. Deaths on the liver transplant waiting list: An analysis of competing risks. Hepatology. 2006;43(2):345–351. doi: 10.1002/hep.21025. [DOI] [PubMed] [Google Scholar]
- 18.Massie A, Chow E, Wickliffe C, et al. Early Changes in Liver Distribution Following Implementation of Share 35. Am J Transpl. 2015;15(3):659–667. doi: 10.1111/ajt.13099. [DOI] [PMC free article] [PubMed] [Google Scholar]
- 19.Alston C, Paget L, Halvorson G, et al. Communicating with patients on health care evidence. Washington, DC: National Academies Pr; 2012. [Google Scholar]
- 20.Freeman R, Edwards E. Liver transplant waiting time does not correlate with waiting list mortality: Implications for liver allocation policy. Liver Transpl. 2000;6(5):543–552. doi: 10.1053/jlts.2000.9744. [DOI] [PubMed] [Google Scholar]
- 21.Department of Health and Human Services. Organ Procurement and Transplantation Network. Fed Regist. 1998;63:16296–16338. Codified at 42 CFR Part 121. [PubMed] [Google Scholar]
- 22.Washburn W, Pomfret E, Roberts J. Liver allocation and distribution: possible next steps. Liver Transpl. 2011;17(9):1005–1012. doi: 10.1002/lt.22349. [DOI] [PubMed] [Google Scholar]
- 23.Zipkin D, Umscheid C, Keating N, et al. Evidence-based risk communication. A systematic review. Ann Intern Med. 2014;161(4):270–280. doi: 10.7326/M14-0295. [DOI] [PubMed] [Google Scholar]
- 24.Merion R, Guidinger M, Newmann J, Ellison M, Port F, Wolfe R. Prevalence and outcomes of multiple-listing for cadaveric kidney and liver transplantation. Am J Transplant. 2004;4(1):94–100. doi: 10.1046/j.1600-6135.2003.00282.x. [DOI] [PubMed] [Google Scholar]
- 25.Dzebisashvili N, Massie A, Lentine K, et al. Following the organ supply: assessing the benefit of inter-DSA travel in liver transplantation. Transplantation. 2013;95(2):361–371. doi: 10.1097/TP.0b013e3182737cfb. [DOI] [PubMed] [Google Scholar]


