

Abstract
Objectives
Gastrointestinal (GI) blood loss is a recognized complication of the use of non-steroidal anti-inflammatory drugs (NSAIDS) in patients with arthritis. We examined the cross-sectional relationship of patient reported outcomes of overall health, physical function, vitality and quality of life (QoL) to hemoglobin (hgb) levels in post menopausal women with self-reported osteoarthritis to determine whether hgb levels as potential markers of chronic blood loss were associated with these functional outcomes.
Method
Post-menopausal women (N=64,850) with self-reported osteoarthritis (srOA) at baseline in the Women’s Health Initiative study, excluding participants with chronic or hemolytic diseases associated with anemia, had hgb levels measured and completed Short Form Health Surveys (SF-36). General linear models analysis adjusting for potential confounders was performed.
Results
A non-linear plateauing relationship between hgb levels and functional outcomes was found. Participants with srOA had statistically significantly worse overall health, physical function, and vitality, but not QoL, for each gram of hgb below 14 g/dL, compared to those with hgb 14 g/dL (p<0.001.) Participants with srOA taking NSAIDS had worse functional outcomes for each level of Hgb compared to those not reporting NSAIDS use.
Conclusion
In cross-sectional analyses of post-menopausal women with srOA, differences in hgb levels are related to differences in functional outcomes of overall health, physical function and vitality at clinically important levels. Prospective studies evaluating whether changes in hgb levels result in changes in functional outcomes in participants with OA are needed to confirm of our findings and before any changes in therapeutics based upon hemoglogin levels are considered in the care of patients with osteoarthritis.
Introduction
Osteoarthritis (OA) is a leading cause of pain, disability and poorer quality of life in older Americans. [1-4] Treatments for OA seek to relieve patients’ pain and improve their function and quality of life (QoL). Non-steroidal anti-inflammatory drugs (NSAIDS) are often used and are associated with varying degrees of blood loss and anemia due to drug related GI toxicity. The World Health Organization (WHO) has defined anemia for women as a hemoglobin (hgb) <12 gm/dL implying that hgb levels below 12 gm/dL are associated with poor health outcomes and above 12 gm/dL are associated with good health. [5] However hgb levels represent a continuum that may be associated with important differences in overall health, physical functioning, vitality and QoL even for levels above 12 gm/dL. Indeed several studies have suggested a patient’s functional status, cognitive functioning, and QoL may be suboptimal at levels of hemoglobin above the anemic range 6-8 However these studies were of limited sample sizes and categorized hgb levels into discrete categories (e.g,-mild anemia, hgb <12 g/dL) and therefore do not provide a complete understanding of the biological relationship between a range of hgb levels and patients’ functional outcomes.
An understanding of the impact of varying levels of hgb on functional outcomes has potentially important clinical implications. For example, for diseases such as OA, use of differing types of analgesic therapy such as the use of NSAIDS may be associated with varying degrees of blood loss. [9] The resultant differences in hgb levels due to the choice of medications used may effect a patient’s overall health, physical functioning, vitality and quality of life which would be an important mitigating factor used by a clinician when choosing different treatment options.
The Women’s Health Initiative [10-12] is a large cohort of post menopausal women that has measured functional outcomes such as overall health, physical function, vitality, and quality of life, hgb levels, medication use and self-reported OA (srOA) makingit ideal to answer the following questions:
What is the relationship of hgb levels and overall health, physical function, vitality and quality of life for the entire spectrum of hgb levels found in post-menopausal women with srOA?
Does this relationship differ among users of non-selective NSAIDS compared to non-users?
METHODS
Study Population
The Women’s Health Initiative (WHI) is a national study that recruited women through 40 clinical centers during 1993 -1998 as described in detail previously. [10-12] All women provided written informed consent, and the study was approved by the local institutional review boards as well as the Fred Hutchinson Coordinating Center Institutional Review Board and the National Institutes of Health. Briefly, study participants were generally healthy, postmenopausal women aged 50-79 at baseline. Women were excluded if they did not plan to reside in the area for at least 3 years, had medical conditions predictive of less than 3 years of survival or had complicating conditions such as alcoholism, mental illness, or dementia. Those eligible for either the clincal trial or observational arms completed baseline assessments including a complete blood count (CBC), clinical exam, medication inventory, questionaires including self-reported diseases and a Short Form Medical Outcomes (SF-36) questionaire. A standardized written protocol, centralized training of local clinical staff, local quality control, and periodic quality assurance visits by the Clinical Coordinating Center were used to maintain uniform data collection procedures at all study sites. Reproducibility of WHI questionaire data was evaluated in a random sub-sample at 10 weeks with good to excellent reproducibility (weighted kappa- 0.77 to 0.99). [10]
Sample selection
The sampling frame for this analysis is described in the flow diagram in figure 1 below. From the 161,808 women in WHI, we excluded women with missing or out of the physiologic range hgb levels (n=2,152), and those with causes of anemia unrelated to potential blood loss such as lupus, rheumatoid arthritis, sickle cell anemia, chronic kidney disease, cancer or heart failure (N=18,125). This left 141,531 women whose hgb level potentially reflected chronic blood loss of which we only included those with self-reported OA (srOA), resulting in a sample of N=64,850 post menopausal women. Self-reported arthritis was determined using the medical history question: “Did your doctor ever say that you had arthritis? If yes, what type of arthritis?” Rheumatoid arthritis (not including rheumatism)/ other/ don’t know.
Figure 1.
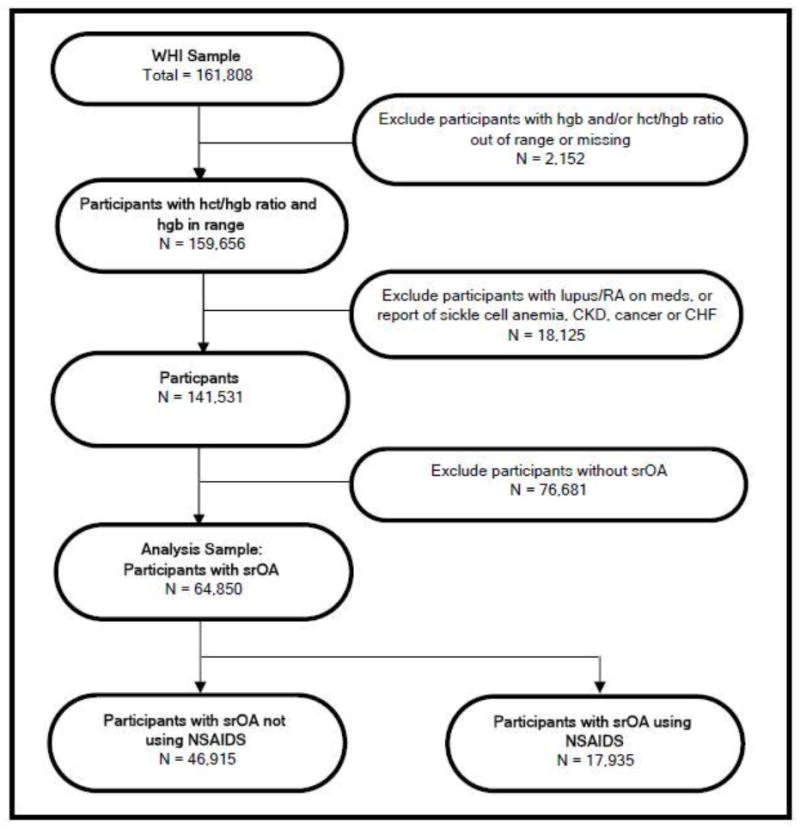
Sample Selection
Self-reported OA was defined as an affirmative response to the arthritis question, not reporting rheumatoid arthritis and not taking a medication associated with rheumatoid arthritis, since self-reported rheumatoid arthritis using the arthritis question alone has a low specificity. [13] Medications associated with rheumatoid arthritis included: gold compounds, methotrexate, ankinara, adalimumab, leflunomide or etanercept.
Exposure assessment
At the required baseline screening clinic visit, participants completed several self-adminstered questionaires including medical history, reproductive and menstrual history, health behavior including physical activity and diet and family history of selected diseases. Staff obtained anthropometric measures including height, weight, and waist circumference.
Determination of the use of NSAIDS and other prescription and over-the counter medication was based upon a medication inventory. Medication use at baseline was ascertained by having the participant bring to the clinic all the containers with medications taken within the 2 weeks prior to the baseline visit. Interviewers entered each medication into the database, which assigned drug codes using Medi-Span software. Information on duration of use but not dose was recorded. All NSAIDS use reported reflects non-selective NSAIDS since Cox-2 inhibitors were not available in the United States during the baseline assessments.
A complete blood count (CBC) was drawn at baseline and analyzed by certified laboratories at each of the 40 clinical centers. Results were entered into the WHI database at each clinical center and viewed by each clinical center staff for accuracy and patient safety. If patients had a hgb < 10 gm/dL they were referred to their personal physician for evaluation but could remain in the study. We excluded laboratory data where the hgb levels were in a non-physiologic range (hgb < 4.95 or 18.75 g/dL) similar to NHANES III (14) or those that were discrepant with respect to their hematocrit (hct) levels (hct/hgb ratio <2 .5 or >3.5) since the ratio of hematocrit to hemoglobin is 3:1; assuming these were data entry or laboratory errors.
Covariates
Sociodemographic factors including age, race/ethnicity, and education were asked at baseline. Disability status was based upon a response to current job status as “disabled, unable to work.” Physical Activity was quantified as a continous variable in metabolic equivalents (METs) per week using a validated questionaire [15] and published database of physical activity and MET intensities. [16] Baseline depressive symptoms were assessed by self-report using Burnam’s 8-item scale for depressive disorders (major depression and dysthymia). [17] This scale combines 6 questions about frequency of depressive symptoms from the Center of Epidemiologic Studies Depression Scale (CES-D), with 2 questions about symptom duration from the Diagnostic Interview Schedule (DIS). The distribution of scores was highly skewed, suggesting a binomial distribution. Therefore, as has been done in other studies, [18] a cut point greater than or equal to 0.06 was used to dichotomize the continuous score.
Cardiovascular disease was based upon an affirmative answer to either of the following two questions: “Did a doctor ever say that you had a stroke?”, “Did a doctor every say that you had a heart attack” ? Liver disease was based upon an affirmative aswer to the following question:” Did a doctor ever say that you had any of the following health problems? Liver disease (chronic active hepatitis, cirrhosis, or yellow jaundice). Diabetes was based upon the question, “Did a doctor ever say that you had sugar diabetes or high blood sugar when you were not pregnant?” Gastro-intestinal surgery was determined based upon an affirmative answer to the following question;” Has a doctor told you that you have any of the following conditions or have you had any of the following procedures ?” part of intestines taken out. “No questions about upper GI surgery such as peptic ulcer surgery, or esophageal surgery were asked. Overnight hospitalizations was determined based upon an affirmative answer to the following question: Have you been hospitalized overnight at any time during the past two years? Body mass index (kg/m2) was calculated and divided into categories: < 25, 25-29.9, 30-34.9, 35-39.9, and 40 or greater.
Outcomes
Self-reported physical functioning (nine items), general health (five items), vitality (four items) were derived from subscales of the Short Form-36. [19] The SF-36 and its subscales are scored form 0 to 100 with a higher score indicating a more favorable state of health. A 5 point difference in scores for each sub-scale is considered the minimal clinically important difference (MCID) between two health states. [20,21] For quality of life assessment, we utilized the SF-6D, a health utility index used in economic analyses. The SF-6D consists of 11 items from the SF-36 and includes six domains (physical, role, social, pain, mental, vitality) to create a health utility index similar to EQ-5D. [21] The SF-6D score ranges from 0.29 to 1, with 1 being excellent health, and 0 approximating death. The MCID for the SF-6D is 0.025. [22]
Statistical Methods
Exploratory graphical techniques using boxplots, histograms, quantile-quantile plots, and stem and leaf plots were used to examine the data. The normality of the distribution was examined for the four outcome variables (SF-36 overall health, physical function sub-scale, vitality sub-scale, and QoL (SF-6D) with a normal probability plot. Associations between the hgb levels and covariates was assessed using correlations, t-tests, and chi-square tests, as appropriate.
Since the relationship between hgb levels and function outcomes was not linear, the relationship was modelled using two different approaches. In the first, three cutpoints where the relationship appeared to be linear were chosen. (See Figure 2). Using linear regression analysis, b-coefficients for interaction term of hgb X hgb category (< 12, 12-14, >14 gm/dL) were computed. Secondly, a semi-parametric generalized additive models were used to uncover the structure of the relationship between the outcome variables and hgb levels based on the cubic smoothing spline method. Then general linear models were evaluated with an appropriate polynomial term for hgb (hgb and hgb2). The b coefficient were computed for each 1 gram of hgb to evaluate the independent association between hgb levels and the four functional outcomes. Both regression methods adjusted for potential confounding of baseline socio-demographic factors, BMI, physical activity, depression, disability, associated disease states and cohort assignment using a backward selection process. The validity of model assumptions were evaluated using analysis of residuals. R-square was used to evaluate the goodness of fit for the model. Because of concerns regarding over-parameterization of the models, all confounders had to change the measure of effect by 10% to be utilized in final adjusted models. Additional analytic models were performed stratified regarding NSAIDS use to address the second research question. All the p values are calculated with two-sided significance level of 0.05. Data analyses were performed using SAS 9.1.3 (SAS Institute, Inc, Cary, North Carolina).Testing for diffences between slopes of the stratified models was performed using a ratio test.
Figure 2.


Multivariate Adjusted Relationship of Functional Outcomes to Hemoglobin Levels in Participants with/without NSAIDS Treatment and All Self-reported OA Participants
Results
The baseline sociodemographic characteristics, cohort assignment, behaviors, comorbid medication conditions, and medications utilized, stratified by hgb category are shown in Table 1. Using hgb of 12-13.9 g/dL as the comparison group, women with WHO-defined anemia (hgb<12 g/dL) were slightly older, more likely African-American, less educated, less likely to be in one of the clinical trials, less likely to be smokers, less physically active, more likely to be disabled, heavier, more frequently hospitalized overnight, more likely to be diabetic, have cardiovascular disease, report taking non-steroidal anti-inflammatory medications, acetaminophen, proton pump inhibitors, H2 blockers and less likely to be taking aspirin. Using the same hgb of 12-13.9 g/dL comparison group, women with hgb ≥14 g/dL were more likely to be older, white, college educated, participate in the clinical trial, be cigarette smokers, be heavier, and have higher rates of cardiovascular disease.
Table 1.
Baseline Characteristics of Women’s Health Initiative Participants with Self-reported Osteoarthritis by Hemoglobin Level
| Variable | Hemoglobin Level | |||
|---|---|---|---|---|
| < 12.0 gm/dL n = 3,712 | 12.0-13.9 gm/dL n = 41,522 | ≥14.0 gm/dL n = 19,616 | ||
| Age, years mean (SD) | 64.7 (7.3) | 64.3 (7.0) | 64.8 (6.9) | |
| Race, N (%) | White | 2,363 (63.7) | 33,954 (81.8) | 17,287 (88.1) |
| African American | 1,071 (28.9) | 4,450 (10.7) | 855 (4.4) | |
| Hispanic | 123 (3.3) | 1,574 (3.8) | 717 (3.7) | |
| Other | 155 (4.1) | 1,544 (3.7) | 757 (3.8) | |
| Education, N (%) | <High School | 90 (2.5) | 813 (2.0) | 338 (1.7) |
| High School | 938 (25.6) | 9,233 (22.4) | 4,606 (23.7) | |
| College | 1,392 (37.9) | 15,834 (38.4) | 7,726 (39.7) | |
| >College | 1,249 (34.0) | 15,327 (37.2) | 6,806 (35.0) | |
| RCT, N (%) | 1,475 (39.7) | 18,067 (43.5) | 9,137 (46.6) | |
| Smoking, N (%) | 157 (4.3) | 1,988 (4.9) | 2,050 (10.6) | |
| Physical activity, METs/wk mean (SD) | 10.7 (12.8) | 11.6 (13.0) | 11.2 (12.8) | |
| BMI, kg/m2 mean (SD) | 28.9 (6.7) | 28.6 (6.2) | 29.4 (6.2) | |
| Disabled, N (%) | 195 (5.5) | 1,078 (2.8) | 487 (2.7) | |
| Hospitalization, N (%) | 777 (21.6) | 6,775 (17.2) | 3,111 (16.8) | |
| Lupus, N (%) | 38 (1.0) | 244 (0.6) | 104 (0.5) | |
| Diabetes, N (%) | 308 (8.3) | 1,934 (4.7) | 1,157 (5.9) | |
| Liver disease, N (%) | 86 (2.3) | 1,037 (2.5) | 530 (2.7) | |
| CVD, N (%) | 183 (4.9) | 1,414 (3.4) | 757 (3.9) | |
| NSAIDS, N (%) | 1,226 (33.0) | 11,753 (28.3) | 4,956 (25.3) | |
| Acetaminophen, N (%) | 452 (12.2) | 4,660 (11.2) | 2,130 (10.9) | |
| PPI, N (%) | 355 (9.6) | 3,385 (8.2) | 1,586 (8.1) | |
| H2 Blocker, N (%) | 167 (4.5) | 1,163 (2.8) | 480 (2.5) | |
| Aspirin, N (%) | 772 (20.8) | 9,372 (22.6) | 4,876 (24.9) | |
(needs footnote with abbreviation descriptions)
The relationship between hemogloblin levels and functional outcomes of overall health, physical functioning, vitality and QoL are reported in Tables 2 and 3 plus Figure 2. As can be seen in Figure 2, the relationship is not linear but demonstrates a plateauing, with higher levels of functional outcomes associated with higher levels of hgb up to 14 g/dL. For hgb levels greater than 14 g/dL, the relationship between hgb and functional outcomes appears to level off for vitality and quality of life and decreases for overall health and physical function. Table 2 gives the β coefficient estimates of the linear slope of the relationship of hemglobin to functional outcomes for three ranges of hgb (<12, 12-13.9, ≥14 g/dL) in women with self-reported osteoarthritis. Differences in slope reach statistical significance (p<.05). for all four functional outcomes for both hgb< 12 g/dL and 12-13.9 g/dL and for three of the four functional outcomes excluding quality of life for the >14 g/dL. However the greatest decrement in functional outcomes was found in the anemic range (hgb<12 g/dL) and in those taking NSAIDS with hgb < 12 g/dL. Using a ratio test, we compared the slopes of the relationship of hgb for each of the functional outcomes for hgb <14 g/dl to hgb ≥ 14 g/dL and found it to be statistically significant (p<.001).
Table 2.
Estimates of the Linear Slope of the Relationship of Hemoglobin to Functional Outcomes in Participants with Self-reported OA with/without NSAIDS Treatment and All Self-reported OA Participants
| Hemoglobin Level | All srOA | srOA w/o NSAIDS | srOA w/NSAIDS | |||||||
|---|---|---|---|---|---|---|---|---|---|---|
| Estimates | SE | p-value | Estimates | SE | p-value | Estimates | SE | p-value | ||
| General Health | < 12.0 gm/dL | 1.591 | 0.544 | 0.003 | 0.930 | 0.647 | 0.151 | 3.219 | 0.996 | 0.001 |
| 12.0-13.9 gm/dL | 0.422 | 0.164 | 0.010 | 0.348 | 0.193 | 0.072 | 0.270 | 0.309 | 0.383 | |
| ≥14.0 gm/dL | -0.578 | 0.235 | 0.014 | -0.875 | 0.268 | 0.001 | 0.197 | 0.480 | 0.682 | |
| Physical Function | < 12.0 gm/dL | 2.922 | 0.611 | <0.001 | 2.717 | 0.704 | <0.001 | 3.719 | 1.183 | 0.002 |
| 12.0-13.9 gm/dL | 1.180 | 0.185 | <0.001 | 0.900 | 0.211 | <0.001 | 1.160 | 0.367 | 0.002 | |
| ≥14.0 gm/dL | -0.857 | 0.264 | 0.001 | -1.267 | 0.292 | <0.001 | 0.065 | 0.570 | 0.909 | |
| Vitality | < 12.0 gm/dL | 1.723 | 0.582 | 0.003 | 0.747 | 0.691 | 0.280 | 3.987 | 1.077 | <0.001 |
| 12.0-13.9 gm/dL | 0.845 | 0.176 | <0.001 | 0.597 | 0.207 | 0.004 | 1.112 | 0.334 | <0.001 | |
| ≥14.0 gm/dL | -0.153 | 0.251 | 0.542 | -0.151 | 0.286 | 0.598 | -0.271 | 0.519 | 0.602 | |
| Quality of Life | < 12.0 gm/dL | 0.009 | 0.003 | 0.005 | 0.010 | 0.004 | 0.013 | 0.008 | 0.006 | 0.167 |
| 12.0-13.9 gm/dL | 0.004 | 0.010 | <0.001 | 0.003 | 0.001 | 0.008 | 0.005 | 0.002 | 0.003 | |
| ≥14.0 gm/dL | -0.001 | 0.001 | 0.461 | -0.002 | 0.002 | 0.126 | 0.002 | 0.003 | 0.424 | |
Adjusted for age, race, education, BMI, physical activity, depression, disability, CVD, diabetes, liver disease, hospitalization, and cohort assignment
Table 3.
Polynomial Estimates of the Relationship of Hemoglobin to Functional Outcomes in Women with Self-reported OA (Based on multivariable adjusted models N=64,850)
| Hemoglobin Parameter | All srOA | srOA w/o NSAIDS | srOA w/NSAIDS | |||||||
|---|---|---|---|---|---|---|---|---|---|---|
| Estimates | SE | p-value | Estimates | SE | p-value | Estimates | SE | p-value | ||
| General Health | hgb | 8.464 | 1.164 | <0.001 | 7.805 | 1.356 | <0.001 | 9.104 | 2.271 | <0.001 |
| hgb*hgb | -0.309 | 0.043 | <0.001 | -0.289 | 0.050 | <0.001 | -0.329 | 0.085 | <0.001 | |
| Physical Function | hgb | 13.813 | 1.309 | <0.001 | 12.975 | 1.474 | <0.001 | 14.160 | 2.696 | <0.001 |
| hgb*hgb | -0.496 | 0.049 | <0.001 | -0.474 | 0.055 | <0.001 | -0.507 | 0.101 | <0.001 | |
| Vitality | hgb | 8.259 | 1.247 | <0.001 | 5.950 | 1.448 | <0.001 | 12.500 | 2.450 | <0.001 |
| hgb*hgb | 0.288 | 0.046 | <0.001 | -0.211 | 0.054 | <0.001 | -0.436 | 0.092 | <0.001 | |
| Quality of Life | hgb | 0.0355 | 0.007 | <0.001 | 0.031 | 0.008 | <0.001 | 0.038 | 0.0131 | 0.004 |
| hgb*hgb | -0.001 | 0.0003 | <0.001 | -0.001 | 0.0003 | <0.001 | -0.001 | 0.000 | 0.009 | |
The cutpoints to evaluate the linear relationship between hgb levels and functional outcomes were based upon the review of the graphs in Figure 2, and the WHO definition of anemia. However, to better understand the continuous relationship between all levels of hgb and functional outcomes, a second analysis modelling hgb as a polynomial is shown in Table 3. This analysis reveals a statistically significant relationship between hgb levels and all functional outcomes for the full spectrum of hemoglobin levels.
Discussion
This study confirms the findings from other studies showing that lower hgb levels, even in the non-anemic range, are associated with lower functional outcome scores for overall health, physical function, vitality, and perhaps quality of life. [6-8]
Most previous studies have investigated anemia or mild anemia and have not evaluated the relationship of the full spectrum of hgb levels to functional outcomes. [6-8,23-25] In addition, most previous studies evaluated hgb levels in diseases associated with anemia of chronic disease, such as chronic kidney disease, cancer, rheumatoid arthritis, heart failure. [23-25] With our large study population, we were able to exclude these disease states and have focused on OA where the treatment using NSAIDS via GI toxicity may cause chronic blood loss. We focused this analysis on functional outcomes because of the increasing importance of understanding patient centered outcomes that have a profound impact on disabling diseases such OA in an aging population.
The relative uniformity in the shape of the relationship of hgb levels to each of the functional outcomes is not surprising as overall health, physical functioning, vitality and quality of life, while distinct, are inter-correlated. The finding that the optimal functional outcomes appear to be at a hgb of 14 gm/dL warrants further analysis in longitudinal studies and in other disease states.
The relationship of hgb levels and functional outcomes in community dwelling older adults with OA is under researched with few studies available for comparison. In a recent study, Strand et al evaluated the relationship of the loss of 2 gm/dL hgb versus no change (1 to -1 gm/dL change) on physical functioning in subjects with OA and rheumatoid arthritis, in a meta-analysis of 14 randomized clinical trials. [27] They found improvement in physical functioning in those trial participants with no change in hgb but no improvement in those with 2 grams or more hgb loss. Strand et al also found that for physical functioning, differences in changes from baseline between subjects with blood loss ≥ 2 grams hgb and those with minimal to no changes in hgb were even more pronounced in the subgroups of females with baseline hgb ≤14 gm/dL.
Using the 2 gm/dL threshold of hgb change similar to that found by Strand et al as being clinically meanignful, we evaluated our cross-sectional data. The threshold for “minimally important clinical difference” for general health, vitality, physical function is 5 units. 21,22 In our study, a difference of 2 grams of hgb in the anemic range is associated with greater than 6 unit difference for general health, and vitality in women with srOA and using NSAIDS, and similarly a 6 unit difference for physical function in women with srOA whether or not they are using NSAIDS. For quality of life, statistically significant differences in hgb levels and quality of life were found in for hgb levels in the anemic range and for hgb measurement between 12-13.9 g/dL for women with srOA both using NSAIDS or not using NSAIDS. However while these associations reached statistically signficance, the 2 gram hgb difference, did not reach the clinical threshold of minimally important differences for the SF-6D utility index (0.025) in this analysis. This analysis demonstrates that for post-menopausal women with self-reported osteoarthritis for each 2 gram increment of hgb up to a hgb of 14 gm/dL, there was better general health, vitality, and physical function after adjusting for age, sociodemographic factors, chronic medical conditions, medication use, physical activity and depression. This analysis also demonstrates that post-menopausal women with srOA taking NSAIDS have worse functional outcomes compared to those not taking NSAIDS at each level of hgb.
Our analysis is prone to several potential biases that should be considered in interpreting our results. We performed a cross-sectional analysis rather than a longitudinal analysis, so the relationship between different hgb levels to functional outcomes, as characterized in the Figure 2, while intriguing may not reflect changes that might occur if blood loss was prevented by differing therapies. Evaluation in prospective studies or clinical trials are needed to confirm or refute these findings. The definition used for OA is based upon participant self-report of physician diagnosis and the exclusion of rheumatoid arthritis rather than radiographic criteria or a physician examination or medical record review. While this definition may misclassify participants as having osteoathritis when they have other rheumatological diseases, this bias is likely randomly distributed across all levels of hgb and functional outcomes, thus biasing toward the null. Functional outcomes of overall health, vitality, physical functioning and quality of life are associated with co-morbid conditions such as depression, diabetes, liver disease, heart disease, chronic kidney disease, cancer and rheumatoid arthritis, many of which cause anemia of chronic disease and thus could contribute to confounding bias. We therefore excluded participants with rheumatoid arthritis, heart failure, cancer, chronic kidney disease and adjusted using multiple variable modeling for coronary heart disease, diabetes, liver disease and depression as well as additional sociodemographic variables. Thus known confounding has been adjusted for but unrecognized confounding may still affect our results.
Conclusion
In this cross-sectional analyses of post-menopausal women with self-reported OA, hgb levels below 14 gm/L were associated with worse functional outcomes of overall health, physical function and vitality at clinically important levels. For each 2 grams of hemogloblin a clinical important difference in functional outcomes was noted. Participants with srOA taking NSAIDS had worse functional outcomes for each level of hgb compared to those not reporting NSAIDS use. While our findings are interesting, they should be considered preliminary and not used to make clinical recommendations without verfication in longitudinal settings and clinical trials. Future clinical trials of OA and NSAIDS should evaluate changes in hgb levels and functional outcomes, as well as, pain control to more robustly address this issue.
Acknowledgments
The Women’s Health Initiative is funded by the National Heart, Lung and Blood Institute, US Department of Health and Human Services. Clinical trial registration NCT00000611. The data analysis performed for this paper was sponsored by Pfizer, Inc. Some of the authors are paid consultants of Pfizer, Inc. Special acknowledgement to Mary Roberts MS as statistical programmer for this work.
List of Abbreviations
- GI
Gastrointestinal
- NSAIDS
non-steroidal anti-inflammatory drugs
- Hgb
Hemoglobin
- QoL
quality of life
- MCID
minimal clincally important differences
- OA
osteoarthritis
- SF-36
Short Form Health Surveys
- CBC
complete blood count
- Hct
hematocrit
- METs
metabolic equivalents
- CES-D
Center of Epidemiologic Studies Depression Scale
- kg/m2
Body mass index
- DIS
Diagnostic Interview Schedule
- SAS Institute, Inc, Cary, North Carolina
SAS 9.1.3
Footnotes
All authors have made substantial intellectual contributions to this paper, have read and approved the final manuscript. CBE is the lead author, he participated in the acquisition of the data, developed the hypotheses and analytic plan, reviewed the statistical analysis, interpreted the data, wrote the draft article. MH helped develop the analytic plan, interpret the data, and helped revise the manuscript for important intellectual content. AA helped collect the data, interpret the data, and helped revise the manuscript for important intellectual content. BC helped develop the analytic plan, helped interpret the data, and helped revise the manuscript for important intellectual content. BL paricipated in the study design, performed the statistical analysis, and helped draft the manuscript. GS helped develop the analytic plan, interpret the data, and helped revise the manuscript for important intellectual content. BR helped collect the data, develop the analytic plan, interpret the data, and helped revise the manuscript for important intellectual content. AL helped collected the data, develop the analytic plan, interpret the data, and helped revise the manuscript for important intellectual content. LL helped collect the data, develop the analytic plan, interpret the data and helped revise the manuscript for important intellectual content., MLhelped collected the data, develop the analytic plan, interpret the data, and helped revise the manuscript for important intellectual content. NW helped collect the data, develop the analytic plan, interpret the data, and helped revise the manuscript for important intellectual content. SC helped collect the data, develop the analytic plan, interpret the data, and helped revise the manuscript for important intellectual content. ZC helped collect the data, develop the analytic plan, interpret the data, and helped revise the manuscript for important intellectual content
Competing Interests: Drs. Eaton, Hochberg, Cryer, Lu were paid consultants to Pfizer in connection with the development of this manuscript. No employees of Pfizer had access to the WHI dataset, nor did any member of the Pfizer team have control over the analysis plan, decisions to publish the results or in anyway interfere with the academic freedom of any of the authors.
Publisher's Disclaimer: This is a PDF file of an unedited manuscript that has been accepted for publication. As a service to our customers we are providing this early version of the manuscript. The manuscript will undergo copyediting, typesetting, and review of the resulting proof before it is published in its final citable form. Please note that during the production process errors may be discovered which could affect the content, and all legal disclaimers that apply to the journal pertain.
Contributor Information
Charles B. Eaton, Professor of Family Medicine and Community Health (Epidemiology), Alpert Medical School of Brown University, Director, Center for Primary Care and Prevention, Memorial Hospital of Rhode Island.
Marc C. Hochberg, Professor of Medicine and Epidemiology and Preventive Medicine, Head, Division of Rheumatology & Clinical Immunology, University of Maryland School of Medicine.
Annlouise Assaf, Senior Director, Therapeutic Area Lead, CNS and Pain, Health Economics and Outcomes Research, Global Market Access, Primary Care Business Unit, Pfizer Inc..
Byron L. Cryer, Professor, Division of Digestive and Liver Diseases, University of Texas, Southwestern Medical Center at Dallas.
Bing Lu, Biostatistician, Brigham and Women’s Hospital.
George Sands, Medical Director, Neuroscience, Pain & Inflammation, COX-2 Global Medical Team.
Beatriz Rodriguez, Professor of Epidemiology and Public Health, University of Hawaii.
Andrea LaCroix, Fred Hutchinson Cancer Research Center.
Lawrence Lessin, MedStar Research Institute/Howard University.
Marian C. Limacher, Professor of Medicine, Division of Cardiovascular Medicine.
Nancy Fugate Woods, Professor, Family and Child Nursing and Dean Emeritus, University of Washington School of Nursing.
Stephanie Connelly, Assistant Professor of Preventive Medicine, University of Tennesee health Science Center.
Zhao Chen, Professor, Division Director, Epi/Biostats, University of Arizona.
References
- 1.Prevalence of disabilities and associated health conditions among adults-United States, 1999. MMWR - Morbidity & Mortality Weekly Report. 2001;50(7):120–125. erratum appears in MMWR Morb Mortal Wkly Rep 2001 Mar 2;50(8):149. [PubMed] [Google Scholar]
- 2.Lawrence RC, Helmick CG, Arnett FC, Deyo RA, Felson DT, Giannini EH, et al. Estimates of the prevalence of arthritis and selected musculoskeletal disorders in the United States. Arthritis Rheum. 1998;41(5):778–799. doi: 10.1002/1529-0131(199805)41:5<778::AID-ART4>3.0.CO;2-V. [see comments] [DOI] [PubMed] [Google Scholar]
- 3.Felson DT, Lawrence RC, Dieppe PA, Hirsch R, Helmick CG, Jordan JM, et al. Osteoarthritis: new insights. Part 1: the disease and its risk factors. Ann Intern Med. 2000;133(8):635–646. doi: 10.7326/0003-4819-133-8-200010170-00016. Review. [DOI] [PubMed] [Google Scholar]
- 4.Dunlop DD, Manheim LM, Song J, Chang RW. Arthritis prevalence and activity limitations in older adults. Arthritis Rheum. 2001;44(1):212–221. doi: 10.1002/1529-0131(200101)44:1<212::AID-ANR28>3.0.CO;2-Q. [DOI] [PubMed] [Google Scholar]
- 5.Nutritional anemias. Report of a WHO scientific group. World Health Organ Tech Rep Ser. 1968;405:5–37. [PubMed] [Google Scholar]
- 6.Chaves PH, Xue QL, Guralnik JM, Ferrucci L, Volpato S, Fried LP. What constitutes normal Hgb concentration in community-dwelling disabled older women? J Am Geriatr Soc. 2004;52:1811–1816. doi: 10.1111/j.1532-5415.2004.52502.x. [DOI] [PubMed] [Google Scholar]
- 7.Chaves PHM. Functional Outcomes of Anemia in Older Adults. Semin Hematol. 2008;45:255–60. doi: 10.1053/j.seminhematol.2008.06.005. [DOI] [PubMed] [Google Scholar]
- 8.Lucca U, Tettamanti M, Mosconi P, Apolone G, Gandini F, Nobili A, et al. Association of Mild Anemia in Cognitive, Functional, Mood, and Quality of Life Outcomes in the Elderly: The “Health and Anemia” Study. PLoS One. 2008;3(4):e1920. doi: 10.1371/journal.pone.0001920. [DOI] [PMC free article] [PubMed] [Google Scholar]
- 9.Lanas A, Sopena F. Non-steroidal anti-inflammatory drugs and lower GI complications. Gastroenterol Clinic North Am. 2009;38(2):333–352. doi: 10.1016/j.gtc.2009.03.007. [DOI] [PubMed] [Google Scholar]
- 10.Langer R, White E, Lewis C, Kotchen J, Hendrix S, Trevisan M. The Women’s Health Initiative observational study: baseline characteristics of participants and reliability of baseline measures. Ann Epidemiol. 2003;13:S 107–21. doi: 10.1016/s1047-2797(03)00047-4. [DOI] [PubMed] [Google Scholar]
- 11.The Women’s Health Initiative Study Group. Design of the Women’s Health Initiative Clinical Trial and Observational Study. Controlled Clin Trials. 1998;19:61–109. doi: 10.1016/s0197-2456(97)00078-0. [DOI] [PubMed] [Google Scholar]
- 12.Fouad MN, Corbie-Smith G. Special populations recruitment for the Women’s Health Initiative: successes and limitations. Controlled Clin Trials. 2004;25:335–352. doi: 10.1016/j.cct.2004.03.005. [DOI] [PubMed] [Google Scholar]
- 13.Walitt BT, Constantinescu F, Katz JD, Weinstein A, Wang H, Hernandez RK, et al. Validation of Self-Report of Rheumatoid Arthritis and Systemic Lupus Erythematosus: The Women’s Health Initiative. J Rheumatol. 2008;35(5):811–8. [PMC free article] [PubMed] [Google Scholar]
- 14.Johnson-Kozlow M, Rock CL, Gilpin EA, Hollenbach KA, Pierce JP. Validation of the WHI brief physical activity questionnaire among women diagnosed with breast cancer. Am J Health Behav. 2007;31(2):193–202. doi: 10.5555/ajhb.2007.31.2.193. [DOI] [PubMed] [Google Scholar]
- 15.Vial Health Stat. 32. Vol. 1. National Center for Heaith Statistics; 1994. Plan and operation of the Third National Heaith and Nutrition Examination Survey, 1988-94. [PubMed] [Google Scholar]
- 16.Ainsworth BE, Haskell WL, Whitt MC, Irwin ML, Swartz AM, Strath SJ, et al. Compendium of physical activities: an update of activity codes and MET intensities. Med Sci Sports Exerc. 2000;32(suppl):S498–S504. doi: 10.1097/00005768-200009001-00009. [DOI] [PubMed] [Google Scholar]
- 17.Burnam MA, Wells KB, Leake B, Landsverk J. Development of a brief screening instrument for detecting depressive disorders. Med Care. 1988;26:775–89. doi: 10.1097/00005650-198808000-00004. [DOI] [PubMed] [Google Scholar]
- 18.Tuunainen A, Langer RD, Klauber MR, Kripke DF. Short version of the CES-D (Burnam screen) for depression in reference to the structured psychiatric interview. Psychiatry Res. 2001;103:261–70. doi: 10.1016/s0165-1781(01)00278-5. [DOI] [PubMed] [Google Scholar]
- 19.Hays RD, Sherbourne CD, Mazel RM. The RAND 36-Item Health Survey 1.0. Health Econ. 1993;2:217–227. doi: 10.1002/hec.4730020305. [DOI] [PubMed] [Google Scholar]
- 20.Kosinski M, Zhao SZ, Dedhiya S, Osterhaus JT, Ware JE., Jr Determining Minimally Important Changes in Generic and Disease-Specific Health Related Quality of Life Questionnaires in Clinical Trials of Rheumatoid Arthritis. Arthritis Rheum. 2000;43:1478–87. doi: 10.1002/1529-0131(200007)43:7<1478::AID-ANR10>3.0.CO;2-M. [DOI] [PubMed] [Google Scholar]
- 21.Brazier J, Roberts J, Deverill M. The estimation of a preference-based measure of health from the SF-36. J Health Econ. 2002;21:271–292. doi: 10.1016/s0167-6296(01)00130-8. [DOI] [PubMed] [Google Scholar]
- 22.Walters S, Brazier JE. Comparison of the minimally important difference for two health state measures: EQ-5D and SF-6D. Qual Life Res. 2005;14(6):1523–1532. doi: 10.1007/s11136-004-7713-0. [DOI] [PubMed] [Google Scholar]
- 23.Association between mild anemia and executive function impairment in community-dwelling older women: The Women’s Health and Aging Study II. JAGS. 2006;54:1429–1435. doi: 10.1111/j.1532-5415.2006.00863.x. [DOI] [PMC free article] [PubMed] [Google Scholar]
- 24.Lloyd A, Van Hanswijck de Jonge P, Doyle S, Cornes P. Health State Utility Scores for Cancer-Related Anemia through Societal and Patient Valuations. Value in Health. 2008;11(7):1178–1185. doi: 10.1111/j.1524-4733.2008.00394.x. [DOI] [PubMed] [Google Scholar]
- 25.Sabbatini P. The relationship between anemia and quality of life in cancer patients. Oncologist. 2000;5(suppl 2):19–23. doi: 10.1634/theoncologist.5-suppl_2-19. [DOI] [PubMed] [Google Scholar]
- 26.Strand V, Luo X, Bushmakin AG, Cappelleri J, Assaf AR, Cuffel B, et al. Effect of Blood Loss On Physical Functioning: Pooled Analysis of Patients with Osteoarthritis or Rheumatoid Arthritis. Arthritis Rheum; ACR/ARHP Annual Scientific Meeting; 2009. p. S318. [Google Scholar]