Abstract
To evaluate thin-section computed tomography (CT) (TSCT) features that differentiate adenocarcinoma in situ (AIS), minimally invasive adenocarcinoma (MIA), and invasive adenocarcinoma (IVA), and to determine the size of solid portion on CT that correlates to pathological invasive components. Forty-eight patients were included. Nodules were classified into ground-glass nodule (GGN), part-solid, solid, and heterogeneous. Visual density of GGNs was subjectively evaluated using reference standard images: faint GGN (Ga), <−700 Hounsfield unit (HU); intermediate GGN (Gb), from −700 to −400 HU; dense GGN (Gc), >−400 HU; and mixed (Ga + Gb, Ga + Gc, and Gb + Gc). The evaluated TSCT findings included margin of nodule, distribution of solid portion, distribution of air bronchiologram, and pleural indentation. The longest diameters of the solid portion and the entire tumor were measured. Invasive diameters were measured in pathological specimens. Twenty-two AISs (16 GGNs [7 Ga, 5 Gb, 2 Gc, 1 Ga + Gc, 1 Gb + Gc], 4 part-solids, and 2 heterogeneous), 6 MIAs (1 GGN [Gb + Gc], 3 part-solids, and 2 solids), and 20 IVAs (1 GGN [Gb], 3 part-solids, and 16 solid) were found. The longest diameter (mean ± standard deviation) of the solid portion and total tumor were 9.7 ± 9.7 and 18.9 ± 5.6 mm, respectively. Significant differences in TSCT findings between AIS and IVA were margin of nodule (Pearson chi-squared test, P = 0.004), distribution of air bronchiologram (P = 0.0148), and pleural indentation (P = 0.0067). A solid portion >5.3 mm on TSCT indicated MIA or IVA, and >7.3 mm indicated IVA (receiver operating characteristic analysis, P < 0.0001). Irregular margin, air bronchiologram with disruption and/or irregular dilatation, and pleural indentation may distinguish IVA from AIS. A 5.3 to 7.3 mm solid portion on TSCT indicates MIA/IVA, and a solid portion >7.3 mm on TSCT indicates IVA.
Keywords: lung adenocarcinoma, pathological invasiveness, radiological prediction, thin-section CT
1. Introduction
Several years have passed since the multidisciplinary classification of lung adenocarcinoma was proposed.[1] The concepts of noninvasiveness and invasiveness of lung adenocarcinoma have been newly added in this classification, which included 4 major categories based on the presence or absence of pathological invasiveness: preinvasive lesions, minimally invasive adenocarcinoma (MIA), invasive adenocarcinoma (IVA), and variants.[1] Considering treatments for lung cancer, early detection of the invasiveness using computed tomography (CT) may alter the course of treatment of adenocarcinomas and subsequently improve the prognosis because the size of the invasive components was an independent predictor of survival.[2] For example, limited resection can be selected for preinvasive lesions including atypical adenomatous hyperplasia and adenocarcinoma in situ (AIS).
Although some papers about CT findings of lung adenocarcinoma based on the multidisciplinary classification have been reported,[3–10] it is very difficult to differentiate between noninvasiveness and invasiveness on CT. Moreover, although cutoff value of 5-mm pathological invasiveness was decided on the basis of previous reports,[2,11,12] the optimized size of solid portion on CT that correlates to pathological invasive components have not yet been fully elucidated as far as we know. There is no generally accepted CT criterion for predicting the pathological invasive component >5 mm. The purposes of our study were to evaluate thin-section CT (TSCT) features differentiating AIS, MIA, and IVA and to determine the size of a solid portion on CT that correlates to pathological invasive components.
2. Materials and methods
2.1. Patients
We obtained approval from our internal Ethics Review Board for this study. Informed consent was waived for retrospective review of patient records and images. The study population consisted of 48 consecutive patients (29 men and 19 women; mean age, 67 years [range, 40–83 years]) who had undergone surgery at our institution. All patients underwent preoperative thin-section chest CT examination. Forty-eight nodules were included in this study. Patients who had previous treatments in the lungs or other organs and who did not subsequently undergo surgery after CT were excluded from the study. Moreover, patients with histologic subtypes, except for adenocarcinoma, were also excluded.
2.2. CT protocols
Chest CT scans were performed on a 64-channel Discovery CT750 HD (GE Healthcare, Milwaukee, WI). CT protocol was as follows: detector collimation, 0.625 mm; detector pitch, 0.984; gantry rotation period, 0.4 seconds; matrix size, 512 × 512 pixel; X-ray voltage, 120 kVp; tube current, auto exposure control (mA); field of view, 35 cm for full lung and 20 cm for targeted lung; high-resolution mode with 2496 views per rotation. All TSCT image data were reconstructed with a high spatial frequency algorithm at 0.625 mm thicknesses using adaptive statistical iterative reconstruction 30%.
2.3. Evaluated pathological factors
Pathological diagnoses were performed by 2 independent pathologists (EM and MN, with 24 and 34 years of experience, respectively) according to the multidisciplinary adenocarcinoma criteria.[1] MIA was defined as nodules ≤30 mm with predominantly lepidic growth and invasive component ≤5 mm. IVA was defined as nodules with invasive component >5 mm or the following conditions: histological subtypes other than a lepidic pattern (i.e., acinar, papillary, micropapillary, and/or solid) or myofibroblastic stroma associated with invasive tumor cells, or lymphatic invasion and/or blood vessel invasion and/or pleural invasion, and/or necrosis. Histological diagnoses of AIS, MIA, and IVA were confirmed in consensus. The diameter of invasive component was measured on each pathological specimen. If multiple microinvasive areas are found in 1 tumor, the largest invasive area was selected and its size of was recorded (Fig. 1).
Figure 1.
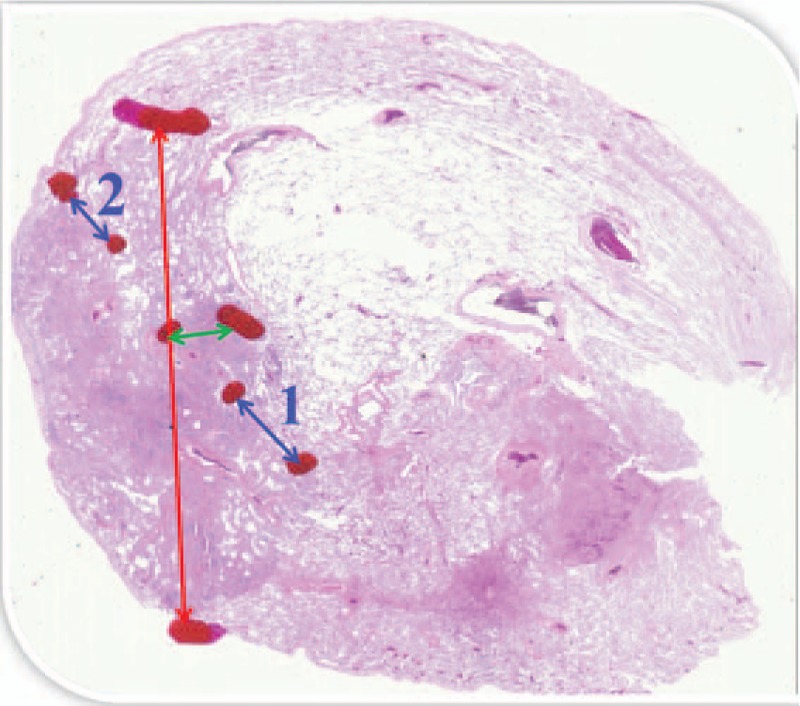
Tumor diameter (red arrow) was 15 mm, and collapse diameter (green arrow) was 1.5 mm. As seen in this case, if multiple microinvasive areas (blue arrow-1, 3 mm; and blue arrow-2, 1.5 mm) are found in 1 tumor, the largest invasive diameter (blue arrow-1) was selected and the size was recorded. The diameter of invasive component in this case was 3 mm.
2.4. Image analysis
Two independent chest radiologists (NT and TJ, with 28 and 29 years of experience, respectively) without prior knowledge of the pathological diagnoses visually classified tumors into 4 subgroups: ground-glass nodule (GGN), part-solid, solid, and heterogeneous with complicated distribution of solid-like portions (Fig. 2). GGN was defined as an area exhibiting a slight, homogeneous increase in density, which did not obscure underlying vascular markings. Moreover, GGNs were classified into the following patterns according to the reference standard images (Fig. 3): faint GGN (Ga), <−700 Hounsfield unit (HU); intermediate GGN (Gb), −700 to −400 HU; and dense GGN (Gc), >−400 HU. If a nodule included 2 densities out of Ga, Gb, and Gc, it was regarded as follows: Ga + Gb, Ga + Gc, and Gb + Gc. Nodules with 3 types of density (Ga + Gb + Gc) was regarded as the heterogeneous. Before starting this study, nodule density was assessed in another 32 homogeneous nodules with various CT density (−812 to −313 HU) by 2 chest radiologists. They could discriminate among GGNs by above 3 ranges of HU. Thus, we decided each threshold in Ga, Gb, and Gc. Solid was defined as an area of increased opacity that completely obscured underlying vascular markings. Part-solid was defined as nodules containing both GGN and solid.
Figure 2.
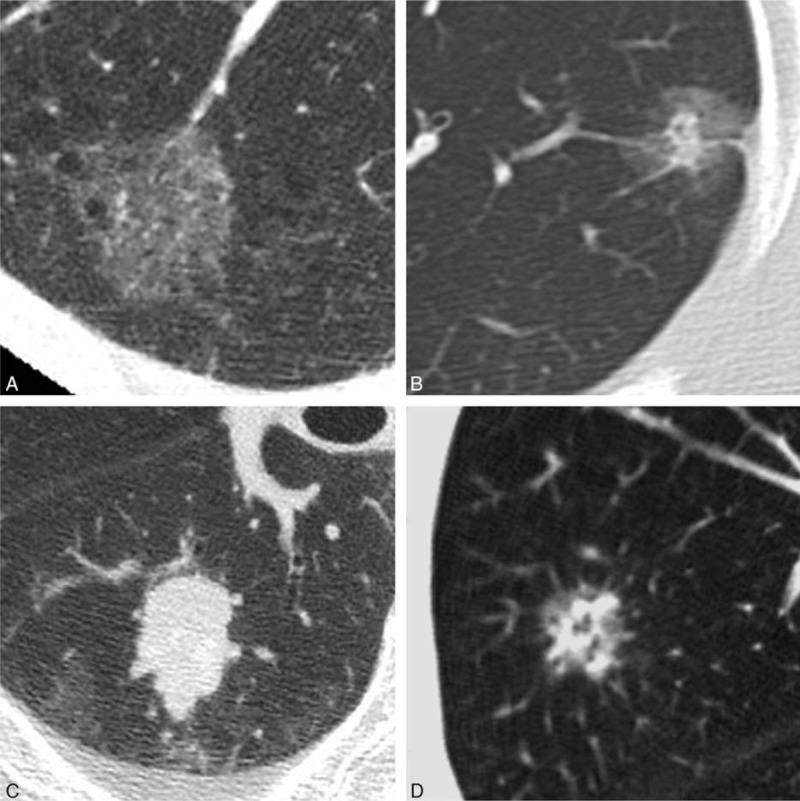
Visual classification of nodules. (A) Ground-glass nodule (GGN), (B) part-solid nodule, (C) solid nodule, (D) heterogeneous nodule: this type of nodule indicates GGN with complicated distribution of solid-like portions.
Figure 3.
Classification of ground-glass nodule (GGN) by 3 ranges of Hounsfield unit (HU). Faint GGN (Ga): CT value is <−700 HU. Intermediate GGN (Gb): CT value is from −700 HU to −400 HU. Dense GGN (Gc): CT value is >400 HU.
The 2 independent radiologists measured the longest diameter of each tumor and the maximum diameter of the solid portion of each tumor using electronic calipers and evaluated the following TSCT findings according to the reference standard images: margin of nodule (faint, external convex, internal convex, and polygonal), distribution of solid portion in part-solid nodules (peripheral and nonperipheral), distribution of air bronchiologram (with or without disruption and/or irregular dilatation), and pleural indentation (absence or presence). Measured size average of the 2 radiologists was used for analysis. Final evaluations of TSCT findings were decided by consensus.
2.5. Statistical analysis
All statistical analyses were performed using commercially available software (MedCalc Version 13.1.2.0—64 bit; Frank Schoonjans, Mariakerke, Belgium). Agreement between 2 radiologists in each evaluated category of TSCT findings was evaluated using the κ statistic: poor (κ = 0.00–0.20), fair (κ = 0.21–0.40), moderate (κ = 0.41–0.60), good (κ = 0.61–0.80), or excellent (κ = 0.81–1.00).[13] Data of the subjective TSCT image analysis were statistically analyzed using the Pearson chi-squared test, which was conducted with Bonferroni correction applied for multiple comparisons. Receiver operating characteristic (ROC) analysis was used to determine a cutoff value of the maximum diameter of the solid portion on TSCT for predicting the pathological invasive component. A P value of less than 0.05 was considered significant. On the Bonferroni correction, P∗ value of less than 0.017 (=0.05/3) was considered significant.
3. Results
3.1. Interobserver agreement
Interobserver agreement for each evaluated category of TSCT findings was good or excellent: margin of nodule (κ = 1.00), distribution of solid portion (κ = 0.70), distribution of air bronchogram (κ = 0.96), and pleural indentation (κ = 0.94).
3.2. Classification of nodules according to histology
Pathological diagnoses based on the multidisciplinary adenocarcinoma criteria were as follows: 22 cases of AIS, 6 cases of MIA, and 20 cases of IVA. Nodules classification of each histology was summarized in Table 1. With distribution of nodules with GGN patterns, 16 GGNs in AIS included 7 Ga, 5 Gb, 2 Gc, 1 Ga + Gc, and 1 Gb + Gc, 1 GGN in MIA was Gb + Gc, and 1 GGN in IVA was Gb. There were no significant differences of GGN patterns among AIS, MIA, and IVA (P = 0.23).
Table 1.
Nodules classification according to their visual characteristics on TSCT imaging.

3.3. Evaluation for thin-section CT findings
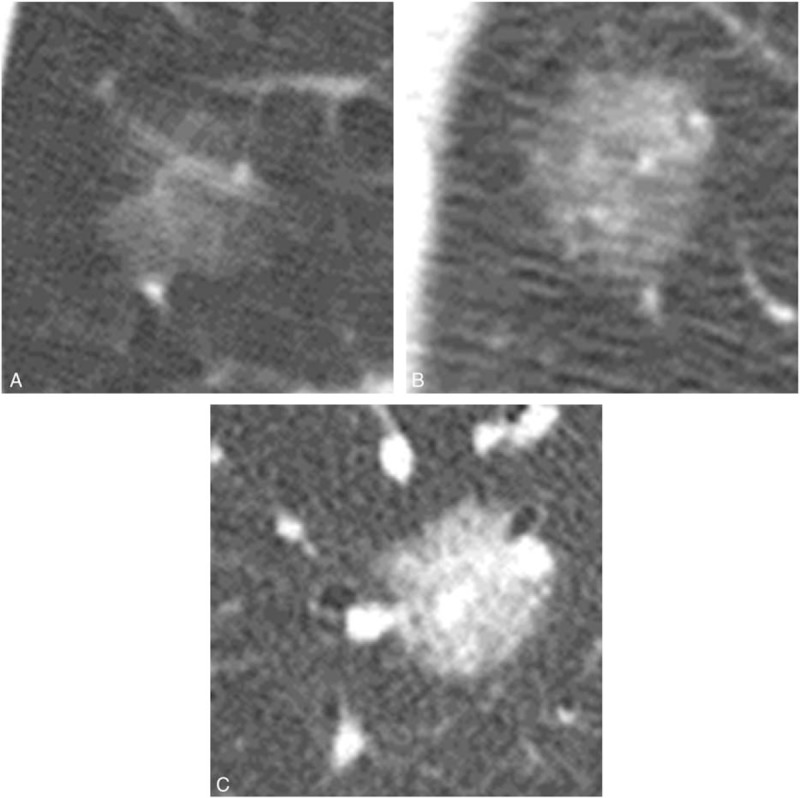
TSCT findings of each histology are summarized in Table 2. Comparing TSCT findings among AIS, MIA, and IVA, only the following differences were found to be significant between AIS and IVA: margin of nodule (P = 0.004), distribution of air bronchiologram (P = 0.0148), and pleural indentation (P = 0.0067) (Fig. 4). With regard to margin of nodule, IVA significantly has nonfaint 1 (P = 0.0028). Sixteen of 20 cases with IVA had external or internal convex (i.e., irregular margin). The distribution of solid portion in part-solid nodules was not a significant finding in order to differentiate between AIS and IVA (P = 0.386). There was no significant TSCT finding that differentiates AIS and MIA, nor was there any that differentiates MIA and IVA.
Table 2.
TSCT findings of each histology.
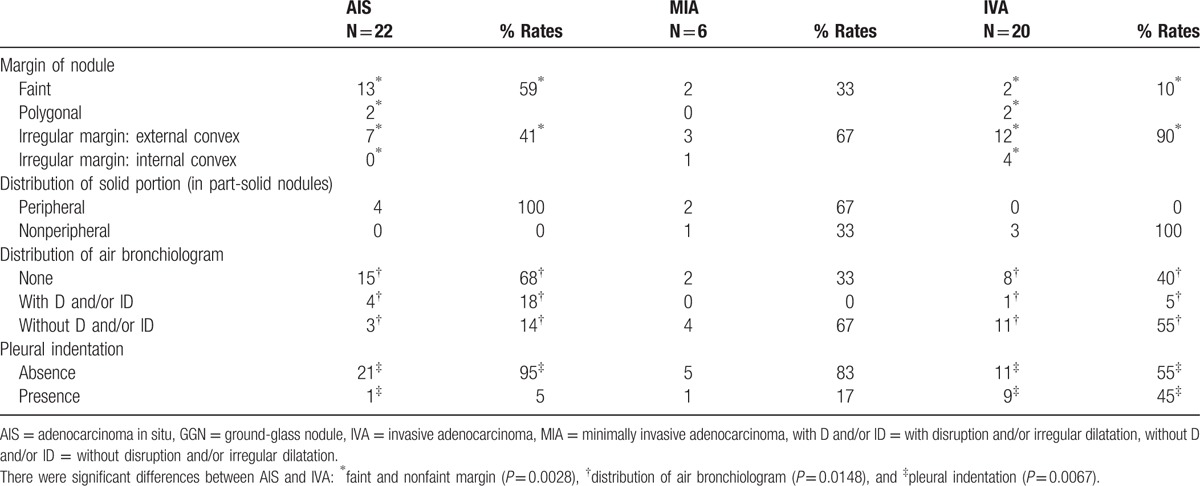
Figure 4.
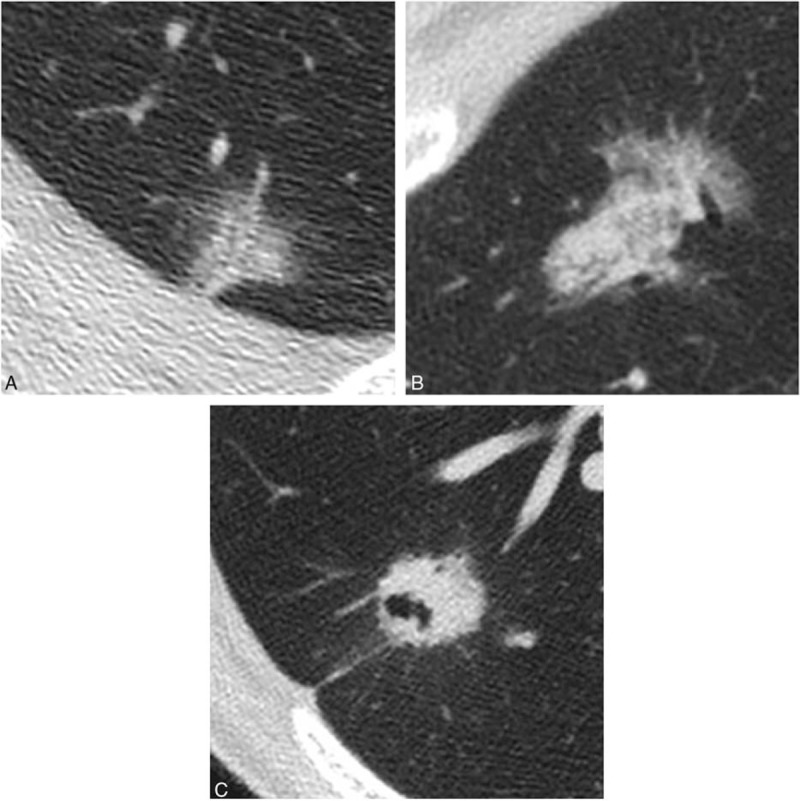
Each thin-section CT finding in 2 cases of adenocarcinoma in situ (AIS) and in 1 case of invasive adenocarcinoma (IVA). This nodule was histopathologically confirmed as AIS. CT image showed ground-glass nodule, which consisted of 2 kinds of ground-glass densities (Ga + Gc). (B) This nodule was histopathologically confirmed as AIS. CT image showed part-solid nodule, in which solid portion included air bronchiologram without any disruptions and irregular dilatations. Solid portion correlated to the pathological collapse area. (C) This nodule was histopathologically confirmed as IVA with acinar, papillary, and micropapillary cells. CT image showed irregular solid nodule including air bronchiologram with disruptions and irregular dilatations. Pleural indentation can be seen.
3.4. Correlation of solid portion on thin-section CT with pathological invasiveness
The longest diameters (mean ± standard deviation) of the solid portion and total tumor were 9.7 ± 9.7 (range, 0–30.0) and 18.9 ± 5.6 mm (range, 7.2–30.0), respectively. The diameter of pathological invasive component was 4.3 ± 5.7 mm (range, 0–22.0). Based upon ROC analysis, 48 cases were classified into 2 groups: nodules with pathological invasiveness ≤5 mm (n = 33) and >5 mm (n = 15). The solid portion of more than 7.3 mm on CT was the significant indicator of pathological invasiveness >5 mm (i.e., IVA) (P < 0.0001; 95% confidence interval [CI], 0.681–0.915) (Fig. 5). Based upon ROC analysis, 48 cases were classified into 2 more groups: nodules with AIS (n = 22) and nodules with MIA or IVA (n = 26). The solid portion of more than 5.3 mm on CT was the significant indicator of pathological invasiveness (i.e., MIA or IVA) (P < 0.0001; 95% CI, 0.818–0.984) (Fig. 6).
Figure 5.
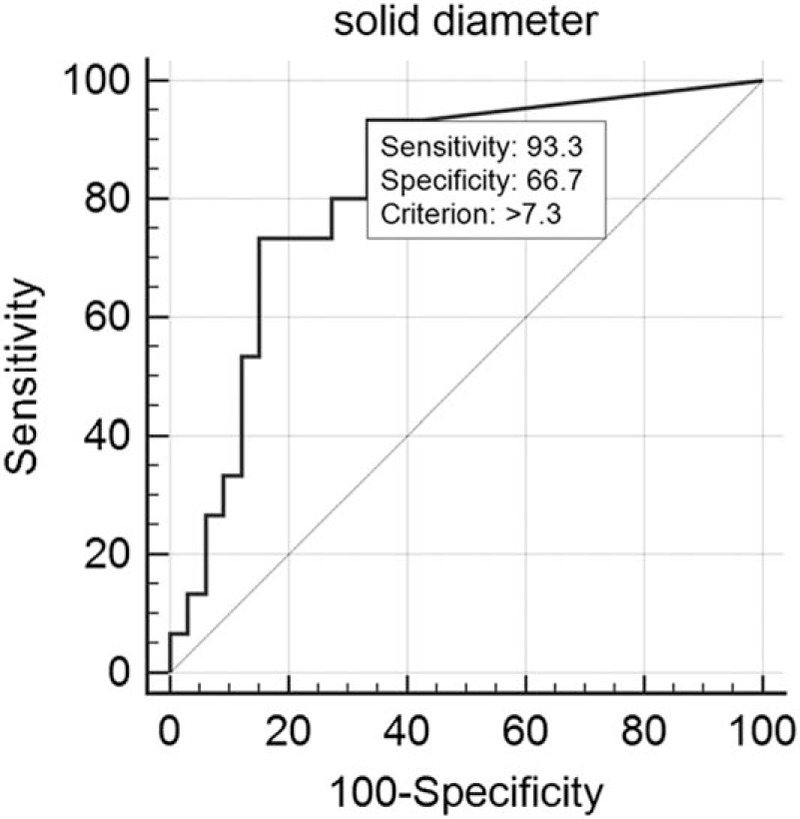
Receiver operating characteristic analysis for 2 groups: nodules with pathological invasiveness ≤5 mm (n = 33) and >5 mm (n = 15). Cutoff value of solid portion on thin-section CT was more than 7.3 mm to predict the pathological invasiveness >5 mm (P < 0.0001): sensitivity, 93.3%; specificity, 66.7%.
Figure 6.
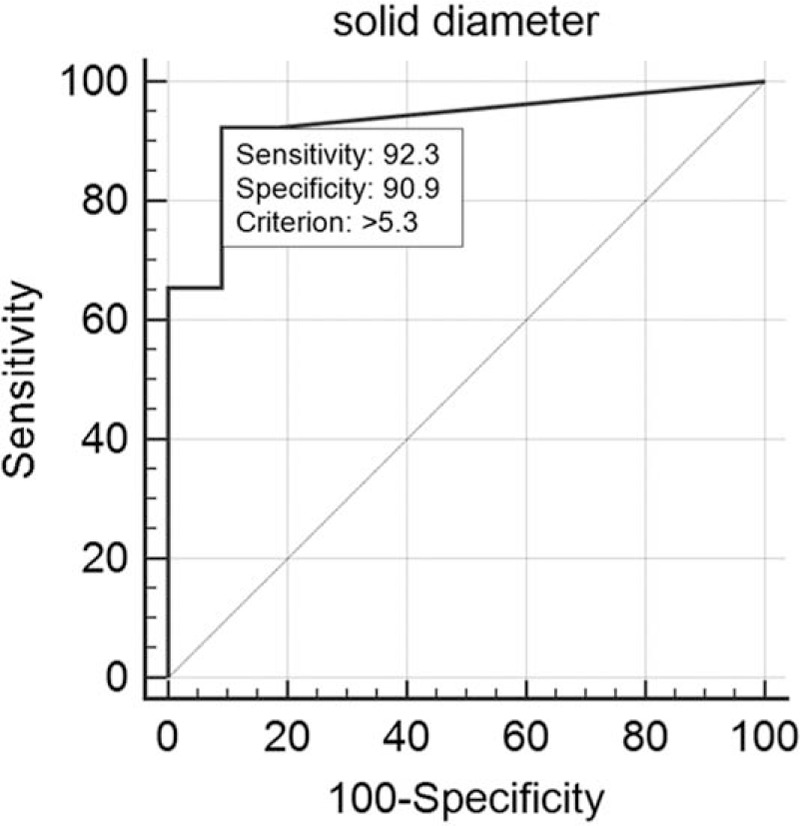
Receiver operating characteristic analysis for 2 groups: nodules with adenocarcinoma in situ (n = 22) and nodules with minimally invasive adenocarcinoma (MIA) or invasive adenocarcinoma (IVA) (n = 26). Cutoff value of solid portion on thin-section CT was more than 5.3 mm to predict the histological diagnosis (MIA or IVA) based on the pathological invasiveness (P < 0.0001): sensitivity, 92.3%; specificity, 90.9%.
4. Discussion
The current study demonstrated that significant TSCT findings of IVA to differentiate from AIS were irregular margin, air bronchiologram with disruption and/or irregular dilatation, and pleural indentation. Moreover, when the solid portion of nodule was evaluated on TSCT, the longest solid portion from 5.3 to 7.3 mm might be the indicator to predict MIA or IVA. The longest solid portion >7.3 mm might be the indicator to predict IVA.
In this study, significant TSCT morphologic differentiators of AIS from IVA were proved. First, nonfaint margin was an important predictive finding of the pathological invasiveness. Most cases of IVA in the present study had external or internal convex (i.e., irregular margin). Generally, nodule margins in lung cancer could become lobulated because of the desmoplastic reaction.[14] Lee et al[6] demonstrated that nonlobulated border was significantly more frequent in preinvasive lesions. However, scrupulous attention is required to evaluate margins of nodules with mucinous components. Miyata et al[15] demonstrated that it was difficult to differentiate some mucinous AIS and MIA from inflammatory nodules because of their lobulated margins or poorly margined ground glass shadows. In the present study, both mucinous AIS and IVA showed polygonal margin like an inflammatory nodule because of a mucin pooling in the surrounding normal alveolar spaces. Second, air bronchogram is an important radiologic sign, which shows high suspicion of malignancy in a small peripheral lung nodule[16]: an air bronchogram and/or bronchiologram was seen in 78% of patients with adenocarcinomas. In our study, air bronchiologram with disruption and/or irregular dilatation was significantly more prominent in IVA than AIS. Conversely, characteristics of air bronchogram in AIS may be without any disruptions and irregular dilatations. Kuhlman et al[17] showed that bubble-like areas of low attenuation due to small air-containing bronchi within mass was characteristic enough to suggest the diagnosis of adenocarcinoma with lepidic growth. The evaluation of air bronchiologram in nodules might be useful for predicting pathological invasiveness. Third, pleural indentation was the important factor to differentiate IVA from preinvasive cancerous lesions, which was in accordance with previous studies.[6,16]
Malignant behavior and prognosis of lung cancer can be predicted by the invasive component size.[2,11,12,18,19] The determination of the optimized size of solid portion on CT which correlates to pathological invasive components will be desired. In this study, the cutoff of the solid portion on TSCT correlated to the pathological invasiveness >5 mm itself was more than 7.3 mm. Moreover, the cutoff of the solid portion on TSCT correlated to the histological diagnosis based on the pathological invasiveness (i.e., MIA or IVA) was more than 5.3 mm. These cutoff sizes on TSCT might have the possibility of being larger than the size of the actual invasive component because solid components on CT include not only cancer cells but also myofibroblastic stroma, alveolar collapse, fibrosis, inflammatory cells, and mucus pathologically.[20,21] Further analyses need to be performed in a different patient cohort. Prediction of pathological invasiveness using CT might be useful for selecting patients for limited surgery and adjuvant chemotherapy. Tsutani et al[18] reported that candidates for adjuvant chemotherapy in Stage I lung adenocarcinoma have to be selected on the basis of the pathological invasive component size. Adjuvant chemotherapy would not be beneficial for patients with AIS or MIA and those with an invasive component size of 5 to 20 mm.
Our study had several limitations. First, our study was of retrospective nature; therefore, selection bias might have existed in this study. Second, only a small number of patients were included. Especially, only 6 cases of MIA were included in this study. This sample size might have been too small to get a reliable result. A study involving a larger number of patients is needed to validate our results. Third, we evaluated data using a multidetector CT manufactured by only 1 company. It is then possible that results may vary using similar multidetectors developed by other companies. Fourth, some cases with mucinous component were included in our study. As genetic factors of lung cancers with and without mucinous components differ, only cases without any mucinous components would have been evaluated. Finally, the comparison of each of the maximum tumor dimensions in CT images and resectable lung cancers was not always accurate because lung specimens tended to collapse after resection. This is particularly noted in cases of GGN on CT. However, preventing alveolar collapse after resection would have been difficult.
In conclusion, IVA may be distinguished from AIS by irregular margin, air bronchiologram with disruption and/or irregular dilatation, and pleural indentation. A solid portion of the size of 5.3 to 7.3 mm on TSCT indicates MIA or IVA, and a solid portion >7.3 mm on TSCT indicates IVA. TSCT features may predict the pathological invasiveness. Validation of our findings with a larger number of patients is required.
Footnotes
Abbreviations: AIS = adenocarcinoma in situ, Ga = faint GGN, Gb = intermediate GGN, Gc = dense GGN, GGN = ground-glass nodule, IVA = invasive adenocarcinoma, MIA = minimally invasive adenocarcinoma, TSCT = thin-section CT.
The authors have no funding and conflicts of interest to disclose.
References
- [1].Travis WD, Brambilla E, Noguchi M, et al. International Association for the Study of Lung Cancer/American Thoracic Society/European Respiratory Society international multidisciplinary classification of lung adenocarcinoma. J Thorac Oncol 2011;6:244–85. [DOI] [PMC free article] [PubMed] [Google Scholar]
- [2].Borczuk AC, Qian F, Kazeros A, et al. Invasive size is an independent predictor of survival in pulmonary adenocarcinoma. Am J Surg Pathol 2009;33:462–9. [DOI] [PMC free article] [PubMed] [Google Scholar]
- [3].Lee HJ, Lee CH, Jeong YJ, et al. IASLC/ATS/ERS International Multidisciplinary Classification of Lung Adenocarcinoma: novel concepts and radiologic implications. J Thorac Imaging 2012;27:340–53. [DOI] [PubMed] [Google Scholar]
- [4].Travis WD, Brambilla E, Noguchi M, et al. Diagnosis of lung adenocarcinoma in resected specimens: implications of the 2011 International Association for the Study of Lung Cancer/American Thoracic Society/European Respiratory Society classification. Arch Pathol Lab Med 2013;137:685–705. [DOI] [PubMed] [Google Scholar]
- [5].Naidich DP, Bankier AA, MacMahon H, et al. Recommendations for the management of subsolid pulmonary nodules detected at CT: a statement from the Fleischner Society. Radiology 2013;266:304–17. [DOI] [PubMed] [Google Scholar]
- [6].Lee SM, Park CM, Goo JM, et al. Invasive pulmonary adenocarcinomas versus preinvasive lesions appearing as ground-glass nodules: differentiation by using CT features. Radiology 2013;268:265–73. [DOI] [PubMed] [Google Scholar]
- [7].Zhang Y, Qiang JW, Ye JD, et al. High resolution CT in differentiating minimally invasive component in early lung adenocarcinoma. Lung Cancer 2014;84:236–41. [DOI] [PubMed] [Google Scholar]
- [8].Wilshire CL, Louie BE, Manning KA, et al. Radiologic evaluation of small lepidic adenocarcinomas to guide decision making in surgical resection. Ann Thorac Surg 2015;100:979–88. [DOI] [PubMed] [Google Scholar]
- [9].Austin JHM, Grag K, Aberle D, et al. Radiologic implications of the 2011 classification of adenocarcinoma of the lung. Radiology 2013;266:62–71. [DOI] [PubMed] [Google Scholar]
- [10].Lee SM, Goo JM, Lee KH, et al. CT findings of minimally invasive adenocarcinoma (MIA) of the lung and comparison of solid portion measurement methods at CT in 52 patients. Eur Radiol 2015;25:2318–25. [DOI] [PubMed] [Google Scholar]
- [11].Yim J, Zhu LC, Chiriboga L, et al. Histologic features are important prognostic indicators in early stages lung adenocarcinomas. Mod Pathol 2007;20:233–41. [DOI] [PubMed] [Google Scholar]
- [12].Maeshima AM, Tochigi N, Yoshida A, et al. Histological scoring for small lung adenocarcinomas 2 cm or less in diameter: a reliable prognostic indicator. J Thorac Oncol 2010;5:333–9. [DOI] [PubMed] [Google Scholar]
- [13].Maclure M, Willett WC. Misinterpretation and misuse of the kappa statistic. Am J Epidemiol 1987;126:161–9. [DOI] [PubMed] [Google Scholar]
- [14].Colby TV, Noguchi M, Henschke H. Travis WD, Brambilla HK, Muller-Hermelink K, et al. Adenocarcinoma. World Health Organization Classification of Tumours. Tumors of the Lung, Pleura, Thymus and Heart 1st ed.Lyon: IARC Press; 2004. 35–44. [Google Scholar]
- [15].Miyata N, Endo M, Nakajima T, et al. High-resolution computed tomography findings of early mucinous adenocarcinomas and their pathologic characteristics in 22 surgically resected cases. Eur J Radiol 2015;84:993–7. [DOI] [PubMed] [Google Scholar]
- [16].Kuriyama K, Tateishi R, Doi O, et al. Prevalence of air bronchograms in small peripheral carcinomas of the lung on thin-section CT: comparison with benign tumors. AJR Am J Roentgenol 1991;156:921–4. [DOI] [PubMed] [Google Scholar]
- [17].Kuhlman JE, Fishman EK, Kuhajda FP, et al. Solitary bronchioloalveolar carcinoma: CT criteria. Radiology 1988;167:379–82. [DOI] [PubMed] [Google Scholar]
- [18].Tsutani Y, Miyata Y, Mimae T, et al. The prognostic role of pathologic The prognostic role of pathologic invasive component size, excluding lepidic growth, in stage I lung adenocarcinoma. J Thorac Cardiovasc Surg 2013;146:580–5. [DOI] [PubMed] [Google Scholar]
- [19].Lee KH, Goo JM, Park SJ, et al. Correlation between the size of the solid component on thin-section CT and the invasive component on pathology in small lung adenocarcinomas manifesting as ground-glass nodules. J Thorac Oncol 2014;9:74–82. [DOI] [PubMed] [Google Scholar]
- [20].Noguchi M. Stepwise progression of pulmonary adenocarcinoma—clinical and molecular implications. Cancer Metastasis Rev 2010;29:15–21. [DOI] [PubMed] [Google Scholar]
- [21].Noguchi M, Morikawa A, Kawasaki M, et al. Small adenocarcinoma of the lung. Histologic characteristics and prognosis. Cancer 1995;75:2844–52. [DOI] [PubMed] [Google Scholar]


