Abstract
Rheumatoid arthritis (RA) is a chronic and systemic inflammatory disorder. Conventional radiography, a widely available and cost-effective examination method, remains the standard of reference for the detection and quantification of joint involvement in RA. Fractal dimension (FD) of the trabecular bone structure has been proven to correlate with the bone's physical properties. The present study was designed to use fractal analysis to validate radiograph changes in the hand of RA patients.
This study retrospectively evaluated the hand radiographs of 108 subjects. Fifty-four patients were suffering from RA, of which 18 were men and 36 were women. Their ages ranged from 25 to 90 years. The hand radiographs of 54 healthy patients, 18 men and 36 women (age range 23–88 years), were used as the control group. Bone structure value (BSV) is a critical parameter for the assessment and analysis of bone microarchitecture. The BSVs were calculated over the fractal dimension using the Brownian motion.
The BSV calculated for ROI showed a significant difference in ROI5 (0.210 ± 0.045), ROI6 (0.186 ± 0.066), and ROI11 (0.201 ± 0.056) in patients with RA, in comparison to the CG (P < 0.05). A significant correlation was observed between anti-CCP and ROI4, ROI5, ROI6, ROI9, and ROI12 in seropositive RA patients (post hoc test (Bonferroni) P <0.001).
This study demonstrates that the bone textural image analysis technique can be used to quantify the radiographic changes in RA hands, based on comparisons of FDs.
Keywords: bone structure value, conventional radiography, fractal dimension, rheumatoid arthritis
1. Introduction
Rheumatoid arthritis (RA) is a chronic systemic inflammatory disorder. In RA, structural damage to the joints often occurs during the first years, and early progression is associated with poor outcome.[1] In about 80% of patients, the small joints of the hand are affected, leading to the destruction of periarticular tissue. RA can affect any joint, but it is usually commonly involved in metacarpophalangeal, proximal interphalangeal, and metatarsophalangeal joints.
The radiographic features of the hand joints in the early stages of the disease are characterized by soft tissue swelling duo to synovialitis, periarticular osteoporosis, and possibly already bone erosions.[2] Plain radiographs continue to have an important role in diagnosing and following up of joint involvement in RA. Early therapeutic intervention to prevent joint destruction may improve the course of the disease,[3] so the precise evaluation of joint involvement at its onset is warranted for monitoring and guiding treatment.
The findings of plain radiography, the gold standard for analyzing joint destruction, are normal in the majority of patients at the time of diagnosis, and radiographic changes are often delayed by up to 12 months after the onset of RA.[4] Because periarticular osteoporosis in RA is also the first disease-related morphological sign in plain radiographs before erosions and joint space narrowing occur, it has been proposed that assessment of periarticular osteoporosis could be useful in the early diagnosis of RA and that it could be efficient for predicting the progression of disease. The disadvantage of conventional radiography is its limited sensitivity in detecting early joint space narrowing and periarticular osteoporosis, the latter of which is highly prevalent in metacarpal bones,[5] and, generally, demineralization is only very imprecisely verified using radiographs at a reduction of 35%.
Radiographic assessment of progression is accomplished by scoring bone and soft tissue changes at each joint and using the methods of either Larsen et al[6] or Sharp et al.[7] These methods, as well as their subsequent modifications, are semiquantitative. The disadvantages of these methods are limitations including the assumption that changes in radiographic features are linear and constant during the course of the disease and that the relationship between these features is constant.
Fractal dimension (FD) of the trabecular bone structure has been proven to have evident correlation with the physical property of the bone.[8] Bone structural value (BSV) is a critical parameter for the assessment and analysis of bone microarchitecture. BSV delivers information about bone status by means of a texture analysis over the FD of the high-resolution radiograph. The present study was designed to use the fractal analysis technique to validate radiograph changes in the metacarpophalangeal (MCP) finger joints (I–III), which are the joints that are primarily involved in RA's course.
2. Methods
2.1. Patients
This study retrospectively evaluated the hand radiographs of 108 subjects. Fifty-four patients suffered from RA, of whom 18 were men and 36 were women (age range: 25–90 years; mean age ± standard deviation, 63 ± 13 years). All RA patients fulfilled the 1987 American College of Rheumatology (ACR) revised criteria for RA. The hand radiographs of 54 age- and sex-matched healthy patients, 18 men and 36 women, were used for the control group (CG). These patients had an age range of 23 to 88 years (mean age ± standard deviation = 55 ± 22 years).
Clinical data of RA patients were retrieved from patients’ records, including age, gender, disease duration, presence of rheumatoid factor (RF) and anti-cyclic citrullinated peptide (anti-CCP) antibodies, presence of bone erosions, disease activity at the time of radiographic assessment, and radiographic assessment with Steinbrocker Staging System (SBS) (Table 1).[9] The local ethics committee approved the study and informed consent was not necessary.
Table 1.
Mean BSV and standard deviation values of ROI1 to 12 in Control group, seronegative, seropositive RA and RA patients.

2.2. Bone texture analysis
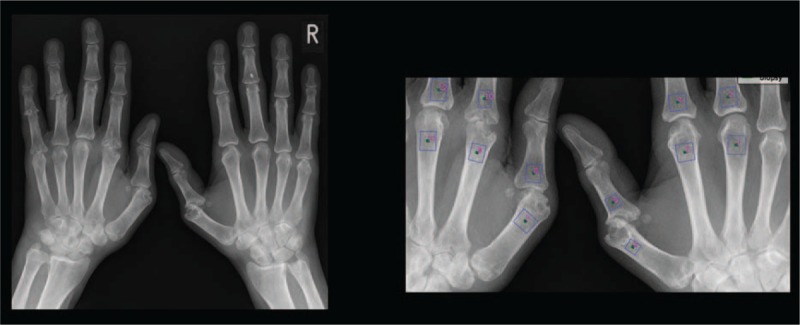
High-resolution x-ray images of the hands of 54 patients and 54 controls were used in the study. The selectable measurement region (ROI) has been placed on the area to be examined. In order to standardize the measurement technique, ROI was chosen in the proximal and distal subchondral region of the first, second, and third metacarpophalangeal joints (Fig. 1). The region of interest is about 65 mm2.
Figure 1.

Boxes with numerals indicate the sites of the ROI in MCP I, II, and III. MCP = metacarpophalangeal joint, ROI = region of interest.
The algorithm evaluates, by pixel line, the change in gray values, calculating the BSV over the FD using the Brownian motion. The FD is a two-dimensional construct and also contains information on the third dimension. The results for all lines are averaged for each ROI field. The change in the gray values in the horizontal and vertical directions delivers information on the entropy and self-similarity, thus describing the quality of the bone microarchitecture. Every selected region delivers a value between 0 (completely chaotic structure) and 1 (perfect self-similarity). Therefore, this method evaluates the entropy status of the bone.
The position of the ROI depends on that of the 2 points selected by the operator. The selection of the ROIs was done according to anatomical landmarks to be reproducible. The parameter given by the i3A software (Version 2.0, BRAINCON Technologies, Vienna, Austria) for each ROI is BSV. BSV is a critical parameter for the assessment and analysis of bone microarchitecture. BSV delivers information about bone status by means of a texture analysis over the FD of the high-resolution radiograph.
2.3. Statistical analysis
The data obtained from the patients were recorded in a Microsoft Excel file, and the statistical analysis was conducted using SPSS (Version 23, IBM, USA). Spearman correlation coefficients were calculated between BSV, RF, and SFS. For quantitative analysis, we performed ANOVA tests to assess the differences in the BSV values of the patients with RA and those of the CG. The Bonferroni correction was used to correct for multiple comparisons. Probability values of less than 0.05 were considered significant.
3. Results
Twenty-four patients (44%) were both anti-CCP positive and RF positive. Two patients (4%) were anti-CCP negative. Twenty-eight patients (52%) were anti-CCP and RF negative. According to Steinbrocker's staging classification, 26 patients (48%) with RA had advanced stage (stage 3 and stage 4) RA and 28 patients (52%) had stages 0, 1, and 2. BSV measurements were obtained from patients with seropositive RA, seronegative RA, and also from the CG (Table 2).
Table 2.
Clinical and demographic characteristics of the subjects.

The BSV calculated for the ROIs showed a significant difference in ROI5, ROI6, and ROI11 in RA patients compared with the CG (P < 0.05). No significant differences were found in the other ROIs in RA patients compared with the CG.
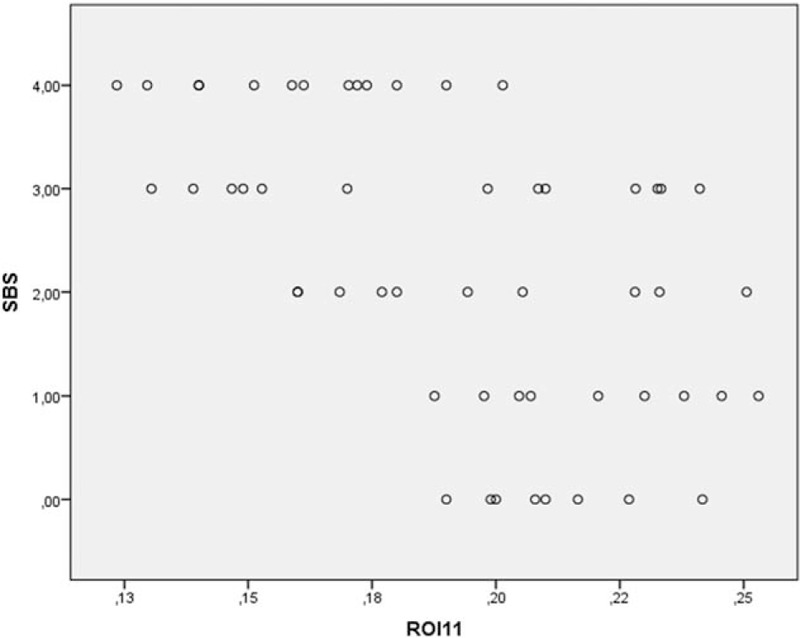
The multiple regression analysis found a significant correlation between the BSV of ROI11 and SBS in seronegative RA patients (R = 0.58 (post hoc test (Bonferroni) P < 0.001)) (Fig. 2).
Figure 2.

BSV of ROI 11 in patients with seronegative RA versus SBS. BSV = bone structure value, RA = rheumatoid arthritis, ROI = region of interest, SBS = Steinbrocker functional state.
The multiple regression analysis confirmed the presence of a significant correlation between anti-CCP and ROI4, RO5 and RO6 in seropositive RA patients. A significant correlation was found between anti-CCP and ROI9 (Fig. 3) and ROI12 in seropositive RA patients (R = 0.88 (post hoc test (Bonferroni) P < 0.001)). A significant correlation was observed between anti-CCP and sex in seropositive RA patients (R = 0.88 (post hoc test (Bonferroni) P < 0.001)).
Figure 3.

Correlation between anti-CCP in patients with seropositive RA was plotted against the corresponding SBS. The image shows the correlation between anti-CCP and ROI 5, 6, and 9 in patients with seropositive RA. anti-CCP = anti-cyclic citrullinated peptide, RA = rheumatoid arthritis, ROI = region of interest, SBS = Steinbrocker functional state.
A significant correlation was found between ROI2 and SBS in seropositive RA patients.
The multiple regression analysis confirmed the presence of a significant correlation between SBS and age and sex in seropositive RA patients (R = 0.83 (post hoc test (Bonferroni) P < 0.001)).
No correlation was found between SBS and RF in seropositive RA patients.
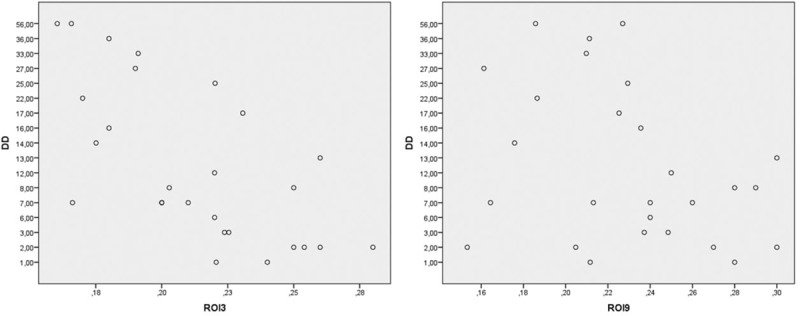
The multiple regression analysis showed that the disease duration may have contributed to the BSV value of ROI3 and ROI9 (R = 0.42 (post hoc test (Bonferroni) P < 0.001)) in both RA groups (Fig. 4).
Figure 4.

BSV for ROI 3 and 9 was plotted against the corresponding DD in patients with seropositive RA. BSV = bone structure value, DD = disease duration, ROI = region of interest.
4. Discussion
Rheumatoid arthritis is characterized by the inflammation and damage of the synovial membrane, cartilage, and subchondral bone of the joints, leading to loss of joint space and functionality. Periarticular osteopenia is an early and common feature of RA and could be the first disease associated morphological change. Deal reported the inflammation in the bone marrow compartment as a cause of periarticular osteopenia.[10] Accurate identification and standardized quantification may therefore be essential to improve clinical intervention and assess the response to treatment.
FD is a sensitive method of image texture analysis, which can predict the quality of trabecular bone from radiographs with low radiation exposure.[8]
Differences in FD have previously been observed between groups having normal and abnormal trabecular bones. De Molon et al[11] evaluated for the first time the pattern of bone remodeling in sinus lifting in human biopsies using autogenous bone graft by means of FD and histological analysis. Zeytinoğlu et al[12] reported that trabecular bone around successful dental implants exhibits lower FD values 6 months after prosthodontic loading and displays stable bony microstructure at the 12-month follow-up point. Bianciardi et al[13] found that parameters based on a combination of ultrasonic examination and fractal analysis on radiographic images may add useful structural information regarding the patient's skeleton using noninvasive procedures. Koh et al evaluated in his study the trabecular pattern on panoramic radiographs to predict age-related osteoporosis in postmenopausal women. He showed that the lower premolar region was the most appropriate site for evaluating the FD value.[14]
BSV contains information on bone status by means of a texture analysis over the FD.
The study presents an analysis of the BSV of the subchondral region of bone in MCP I–III in patients with seropositive and seronegative RA. We sought to assess the feasibility of this method as well as find correlations between the clinical findings and the BSV. The results indicated that the BSV of the patients with seropositive and seronegative RA of the finger joint are significantly different from that of the CG in certain ROI.
Our results suggest a significant correlation between the BSV of the subchondral region in seronegative RA patients, in SBS and ROI11. We found a correlation between the anti-CCP and age and sex in patients with seropositive RA.
In the ROI4, 5, 6, 9, and 12, the BSV of seropositive RA patients was significantly correlated with anti-CCP values. These results were consistent with the study done by Glasnovic et al. They reported a correlation between variables representing anti-CCP and radiological changes degree after the Steinbrocker score.[15] Additionally, a significant correlation between ROI2 and SBS was obtained in seropositive patients in our study. The study's limitation was that not all the hand joints were analyzed. Further, the processus styloideus ulnae region could not be evaluated as a very small ROI was needed. This study has demonstrated that the bone textural image analysis technique can be used to quantify the radiographic changes in RA hands, based on comparisons of FD between a reference CG and an RA group. Because this is the first study evaluating the effectiveness of FD in determining changes in the finger joints in patients with RA in this manner, it is not possible to compare the study's results directly with previous scientific literature. However, given further study, this method could eventually help to improve clinical management, and to assess responses to therapy in patients with seropositive and seronegative RA.
5. Conclusion
We investigated the fractal analysis technique to validate radiograph changes in the metacarpophalangeal (MCP) finger joints (I–III). These are the joints that are primarily involved in the RA course. In our study, the BSV calculated for ROI showed a significant difference in ROI5, ROI6, and ROI11 in patients with RA, in comparison to the CG. Based on FD comparisons between a reference CG and an RA group, this study demonstrates that the technique can be used to quantify the radiographic changes in RA hands.
Acknowledgment
The authors thank Jochen Zwerina, MD, from 1st Medical Department, Hanusch Hospital, Vienna, Austria for his clinical support.
Footnotes
Abbreviations: anti-CCP = anti-cyclic citrullinated peptide, BSV = bone structure value, CG = control group, FD = fractal dimension, MCP = metacarpophalangeal, RA = rheumatoid arthritis, RF = rheumatoid factor, ROI = region of interest, SBS = Steinbrocker Staging System.
The authors agree that the material presented in this paper has not been published before, nor has it been submitted for publication to another scientific journal or considered for publication elsewhere.
I attest that this work has been approved by all co-authors.
Authors’ contributions, SZ conceived the study. SZ and ER undertook the acquisition of data. SZ, RB, and JH analyzed and interpreted the data and drafted the manuscript. JH and KH performed the critical revision of the manuscript. All authors read and approved the final manuscript.
The authors have no conflicts of interest to disclose.
References
- [1].Aletaha D. New insights into the measurement of disease activity in rheumatoid arthritis. Curr Opin Rheumatol 2015;27:268–72. [DOI] [PubMed] [Google Scholar]
- [2].Gravallese EM. Bone destruction in arthritis. Ann Rheum Dis 2002;61:84–6. [DOI] [PMC free article] [PubMed] [Google Scholar]
- [3].Emery P, Solem C, Majer I, et al. A European chart review study on early rheumatoid arthritis treatment patterns, clinical outcomes, and healthcare utilization. Rheumatol Int 2015;35:1837–49. [DOI] [PubMed] [Google Scholar]
- [4].Kilic G, Ozgocmen S. Hand bone mass in rheumatoid arthritis: a review of the literature. World J Orthop. 2015;6:106–116. [DOI] [PMC free article] [PubMed] [Google Scholar]
- [5].Wick MC, Klauser AS. Radiological differential diagnosis of rheumatoid arthritis. Radiologe 2012;52:116–23. [DOI] [PubMed] [Google Scholar]
- [6].Larsen A, Dale K, Eek M. Radiographic evaluation of rheumatoid arthritis and related conditions by standard reference films. Acta Radiol Diagn (Stockh) 1977;18:481–91. [DOI] [PubMed] [Google Scholar]
- [7].Sharp JT, Young DY, Bluhm GB. How many joints in the hands and wrists should be included in a score of radiologic abnormalities used to assess rheumatoid arthritis? Arthritis Rheum 1985;28:1326–35. [DOI] [PubMed] [Google Scholar]
- [8].Jolley L, Majumdar S, Kapila S. Technical factors in fractal analysis of periapical radiographs. Dentomaxillofac Radiol 2006;35:393–7. [DOI] [PubMed] [Google Scholar]
- [9].Steinbrocker 0, Traeger CH, Batterman RC. Therapeutic criteria in rheumatoid arthritis. JAMA 1949;140:659–62. [DOI] [PubMed] [Google Scholar]
- [10].Deal C. Bone loss in rheumatoid arthritis: systemic, periarticular, and focal. Curr Rheumatol Rep. 2012;14:231–237. [DOI] [PubMed] [Google Scholar]
- [11].de Molon RS, de Paula WN, Spin-Neto R, et al. Correlation of fractal dimension with histomorphometry in maxillary sinus lifting using autogenous bone graft. Braz Dent J 2015;26:11–8. [DOI] [PubMed] [Google Scholar]
- [12].Zeytinoğlu M, İlhan B, Dündar N, et al. Fractal analysis for the assessment of trabecular peri-implant alveolar bone using panoramic radiographs. Clin Oral Investig 2015;19:519–24. [DOI] [PubMed] [Google Scholar]
- [13].Bianciardi G, Bisogno S, Bertoldi I, et al. Fractal dimension of bone texture in radiographs correlates to ultrasound broadband attenuation T-score. Clin Exp Rheumatol 2013;31:389–93. [PubMed] [Google Scholar]
- [14].Koh K-J, Park H-N, Kim K-A. Prediction of age-related osteoporosis using fractal analysis on panoramic radiographs. Imaging Sci Dent 2012;42:231–5. [DOI] [PMC free article] [PubMed] [Google Scholar]
- [15].Glasnović M, Bosnjak I, Vcev A, et al. Anti-citrullinated antibodies, radiological joint damages and their correlations with disease activity score (DAS28). Coll Antropol 2007;31:345–8. [PubMed] [Google Scholar]


