Abstract
Visualization of structural biology data uses color to categorize or separate dense structures into particular semantic units. In multiscale models of viruses or bacteria, there are atoms on the finest level of detail, then amino-acids, secondary structures, macromolecules, up to the compartment level and, in all these levels, elements can be visually distinguished by color. However, currently only single scale coloring schemes are utilized that show information for one particular scale only. We present a novel technology which adaptively, based on the current scale level, adjusts the color scheme to depict or distinguish the currently best visible structural information. We treat the color as a visual resource that is distributed given a particular demand. The changes of the color scheme are seamlessly interpolated between the color scheme from the previous views into a given new one. With such dynamic multi-scale color mapping we ensure that the viewer is able to distinguish structural detail that is shown on any given scale. This technique has been tested by users with an expertise in structural biology and has been overall well received.
Keywords: Categories and Subject Descriptors (according to ACM CCS): Visualization [Human-centered computing]: Visualization application domains, Scientific visualization
1. Introduction
With improving technology, more and more data across all levels—from atomic to compartment—is being gathered on viruses and cells. Today it is possible to display an ever increasing amount of this data at once, up to and beyond an entire human immunodeficiency virus (HIV) [LMAPV15], with its complete macromolecular composition. All levels can be present; we can start at the compartment level and zoom in past the proteins, their domains and secondary structures, all the way to the amino acids and atoms (see Figure 1). Visualizations of HIV are not only used for research purposes, but also to communicate its basic properties to a broader audience, as in Figure 2, which is what we are interested in.
Figure 1.
Interactive multi-scale visualization of HIV using “Chameleon” for dynamic color coding of protein and atom properties: Zooming from an overview of the entire virus (a) to the capsid (b), the capsid interior (c), a single integrase protein in the capsid (d), and its atomic structure (e). Mind how protein colors become more differentiated as we zoom in (a–b), and how protein domains (c), secondary structures (d), and individual atoms (e) are being progressively revealed through dynamic color adaptations.
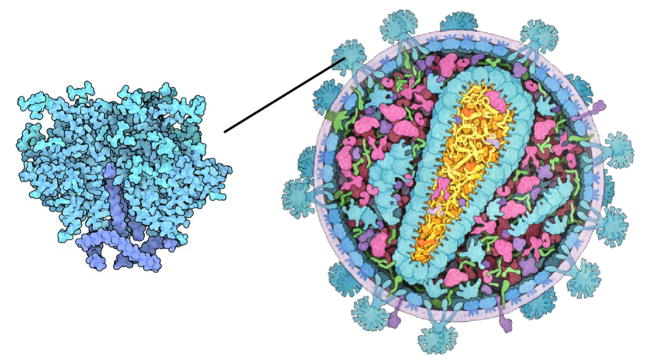
Figure 2.
Multi-scale illustration of HIV [RCS11]: overview of the virus on the right and close-up on the envelope protein on the left. In the close-up different shades of blue are used to discriminate between protein domains, and carbon atoms are slightly darker.
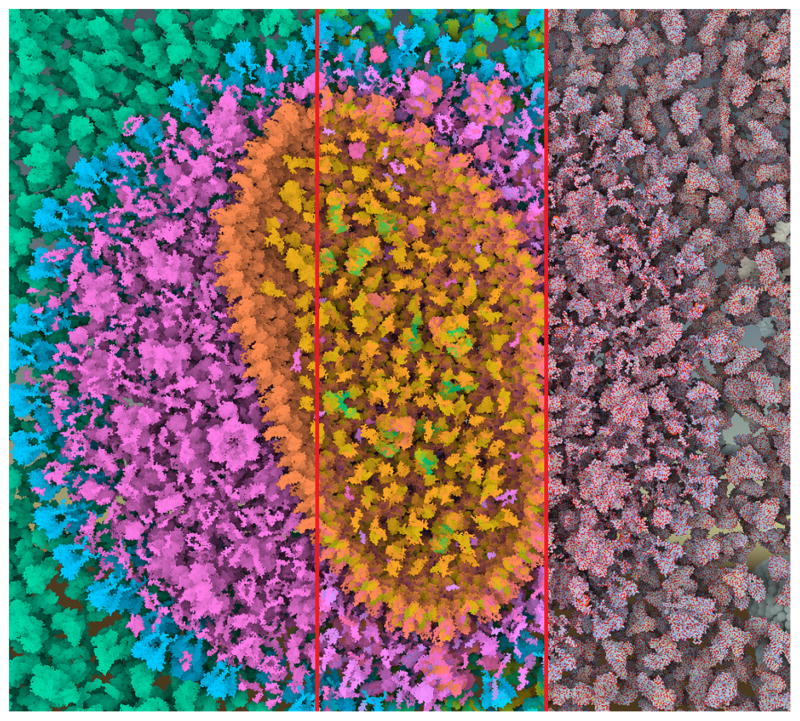
Illustrators carefully select color assignments for each detail level of their illustrations. In Figure 2, the illustrator depicts different protein types by color in the overview on the right. In the close-up on the left, he uses different shades of blue to distinguish between the protein domains, which are not indicated in the overview. In interactively zoomable visualizations, such a static single-scale color assignment will either lead to a loss or excess of information. For example, if we apply categorical color coding to protein groups, then proteins can be easily discriminated, but secondary structures or atoms are not visually depicted (Figure 3, left). On the other hand, when color-coding individual atoms, the visualization is prone to salt-and-pepper noise in the overview levels (Figure 3, right).
Figure 3.
Comparison image of HIV with coloring based on compartments (left), secondary structures (middle), and atoms (right). All different levels can be seen in Figure 10.
A naive approach to multi-scale color mapping would be to independently define colors for each zoom level and then blend them while zooming. However, several issues can occur: First, with independent color assignments for each zoom level, colors may change significantly when zooming. This may not only cause disorientation when zooming due to considerable color changes, but may also cause artificial hues or grayed out colors when blending between levels [CWM09]. Second, there is a loss of hierarchy information when transitioning from one level to the next. For example, when looking at two neighboring compartments and zooming in, it may be hard to maintain an overview of which compartment certain proteins belong to. To take the data hierarchy into account, Tennekes and de Jonge [TdJ14] proposed a color space for hierarchical visualizations. Their approach was targeted towards static visualizations and therefore assigns unique hues to each child node in a tree. However, this leads to poor scalability with respect to color discriminability. The HIV consists of 46 protein types, each divided further into multiple protein domains, secondary structures, amino acids, and atoms. However, this scalability issue can be resolved by exploiting the interactive navigation capabilities – and thereby caused dynamic visibility changes – of our system.
We propose the semantic color zooming method Chameleon for multi-scale visualizations of cell or virus-like structures, based on a view-dependent, hierarchical color scheme. Starting from the highest hierarchy level, we progressively free up unused color space and redistribute it to visible elements defined by the current zoom level and item visibility. Our contributions are:
A view-dependent, hierarchical hue palette for expressive color mapping of multi-scale structural biology models,
Usage of chroma and luminance to minimize visual clutter and encode structural properties across multiple zoom levels, and
Results from a small expert user study, showing that users can distinguish structures on multiple scales through dynamic color mapping, while rating the visualization as highly appealing.
2. Related Work
The selection of a color map for data depends heavily on the visualization goal. Not only clear visibility, but also harmonious and appealing colors can be important [Iha03], as well as the assignment and mixing of colors [WGM*08]. There are many points to consider, and as a result guidelines have been published on how to decide which color scheme is most appropriate [BRT95], [Hea96]. There have also been guides aimed at two dimensional color maps, such as by Bernard et al. [BSM*15] and the software ColorMap-Explorer by Steiger et al. [SBT*15]. Furthermore, several tools have been developed to assist users select appropriate colors for maps, such as Colorbrewer [HB03], and color maps for clusters of data, such as “i want hue” [Med16] and XCluSim [LKS*15]. Such clustering can, however, cause perceptual issues, either due to the large number of clusters or their layout. In cases such as colored maps, visually dominant structures may visually suppress small groups or areas [LSS13]. Visualization of information such as can be found on maps can lead to small areas being next to much larger ones. In this case, it may be difficult to spot the small areas, and lowering the saturation of the larger areas allows the small ones to stand out more. Recognition may also be affected by contrast effects which may need to be dealt with [MSK14]. Particular care needs to be taken when dealing with higher dimensional data [MBS*14], so the distances between the clusters do not become distorted.
While there has been intense research on color mapping in visualization in the past, there have been only very few works related to multiscale visualization. Tree Colors use a tree-based method [TdJ14] that attempts to overcome the above issues in the case of hierarchical structures. The tree method uses HCL space (a cylindrical coordinate version of CIELab with Hue, Chroma (Saturation), and Luminance and gives each cluster a different hue. The root of the tree has no saturation, i.e. grey, and the hue is divided up into different wedges. A hue wedge is assigned to each branch, with some space cut out between branches, in order for there to be a jump in color from one wedge to another. As the tree spreads out, the saturation of the nodes increases, and each level gets its own smaller wedge. Essentially, each level has its own hue ring with a defined chroma. However, the technique was designed for static visualizations, where all colors are visible at the same time. Therefore, the number of possible colors, for example in a close-up, is severely limited, leading to discriminability problems. In contrast, our method allows for dynamic shrinking and growing of wedges based on visibility. In addition, we also allow for overlapping wedges if a clear structural separation is available. This supports discriminability of items through color and shape.
The development of new modeling techniques for three dimensional molecular structures led to a rapid increase in size of the studied datasets. To keep up with the progress, new visualization methods were specifically developed to address this challenge, such as by Lampe et al. [LVRH07] or Falk et al. [FKE13]. An overview of the state-of-the-art in visualization of biomolecular structures is given by Kozlikova et al. [KKL*15].
To support seamless zooming in molecular visualizations, Parulek et al. [PJR*14] introduced seamless transitions between different levels of coarseness for the representation of the molecular surface based on the distance from the camera. Their goal was not only to reduce the computation cost, but also to utilize the shape as a means to reduce high-level details and noise when observing the structure in its entirety. Le Muzic et al. [LMPSV14] extended this approach to allow for real-time rendering of structures with up to tens of billion atoms. cellVIEW [LMAPV15] renders such large-scale molecular scenes using Unity3D, a popular 3D engine. It showcases large molecular structures generated with cellPACK [JAAA*15], a tool developed to procedurally generate accurate and multi-scale models of entire viruses and cells. While these tools provide the foundation to interactively navigate massively packed molecular landscapes, they currently do not have sufficient visual expressiveness to effectively reveal structural information beyond the protein level. Chameleon is built upon cellVIEW, and is an attempt to improve understanding during exploration of multi-scale molecular scenes generated with cellPACK.
3. Chameleon Overview
Mesoscale datasets feature many relevant properties which are present at different scale levels. The molecular properties that we provide are, from the largest to the smallest scale level: compartment (or protein group), protein type, protein domain, secondary structure, and atom type. According to domain experts, these are the most relevant properties. Scientific illustrators are using these properties to modulate the color palette when generating static visualizations of proteins at different levels, as shown in Figure 2. However, this requires manually setting up the color palette for each level, which can be extremely tedious for an interactively zoomable visualization of an entire virus. Our goal is to provide a dynamic coloring mechanism that automatically visualizes the most relevant information for any given zoom level, thereby fulfilling the following requirements:
On each zoom level, associated main structures (i.e., those structures that result in the best visibility in terms of screen size) should be clearly discriminable from each other.
When navigating, the transitions between the zoom levels should be smooth to avoid abrupt appearance changes of the visualization or orientation loss.
The inherent hierarchy of the structures should be reflected in the color coding.
The visualization should be aesthetically pleasing to engage a broad audience.
We manipulate all three color components of the HCL color space to fulfill these requirements: We use the hue to distinguish between structures at the respective zoom levels, as described in Section 4. The chroma is used to increase color discriminability for elements in the focus against the context (Section 5). Finally, we indicate structures from lower hierarchies in the luminance channel to mimic illustrator techniques (see Figure 2) and to smoothen color transitions (Section 6). All objects in the scene must be fully opaque, as transparency for densely packed molecular data can lead to unpredictable and confusing color mixtures. We use CIELab and HCL color palettes, which are perceptually linear. This means we can quantify the dissimilarity between colors by their Euclidean distance. We describe how we dynamically adapt the hues as the user is panning the scene to ensure color discriminability even in a scene with dozens of different entities (Section 4.1), and how hues are sub-divided hierarchically as the user zooms further into the scene (Section 4.2). Finally, we demonstrate the effectiveness of our technique in a user study with professionals and students from the field of molecular biology (Section 8).
4. Dynamic Hue Palette
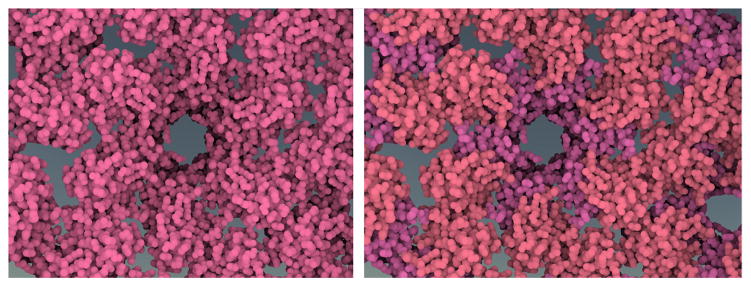
At the highest hierarchy level (compartment, as illustrated in Figure 1a), our task is to find colors for each individual protein type that allow users to discriminate the proteins, but also understand their hierarchical grouping into the compartments. To visually categorize the protein types, we initially assign each protein type within each compartment a unique hue value. Hues are selected from an iso-luminant hue ring, centered in the gray spot, such as shown in Figure 4. To maintain good contrast for encoding shape properties through shading, we fixed the luminance value to 75. With this luminance value, we also can use a wide radius to fit the hue ring within the sRGB gamut, leading to a maximum chroma of 40. Figure 5 shows a comparison between a hue palette picked from an HSL ring (left) and an iso-luminant HCL ring (right). Mind how the structural properties are better visible in the iso-luminant pastel color palette on the right.
Figure 4.

Iso-luminant hue ring with 21 distinct colors, with luminance 75 and chroma 40 in HCL color space.
Figure 5.
Comparison between two color palettes with varying hues and constant saturation/lightness using HSL (left), and constant chroma/luminance using HCL (right). Unlike HSL, the HCL color space provides true isoluminant colors when varying the hue with constant chroma/luminance values.
For the initial color assignment of protein types associated with individual compartments, we allocate hues from the hue ring to protein types with respect to four parameters: 1) the number of compartments n, 2) the number of protein types mi within each compartment 1 ≤ i ≤ n, 3) the optimal color distance d between structures, which will be elaborated below, and 4) the minimum color spacing s between compartments. The first parameter defines the number of “wedges” that are overlaid on the hue ring, where each wedge represents the color range of a compartment, as illustrated in Figure 6, top row. The second parameter controls the relative angular width of the wedges. The third and fourth parameter control the actual angular width of the wedges: Given the chroma C* (i.e., radius) of the hue ring and the optimal Euclidean color distance d, the optimal angular distance between neighboring proteins within the same compartment is defined as:
| (1) |
Figure 6.
Overview of Chameleon’s dynamic and hierarchical hue selection scheme for (a) an exemplary two-level hierarchy of four protein groups (A,B,C,D) and a total number of 20 different protein types: For the current viewport (b), visibility information is extracted (c) and the color palette is updated. Zooming further towards protein type 10 splits up the protein type hue to three different domain colors (x,y,z).
In CIELab color space the ”just noticeable difference” (jnd) is assumed to be 2.3 [LSS13]. Using the jnd would of course lead to poor discernibility. We discovered that roughly 5 jnd steps were needed to allow for easy discernibility. With this setting and a chroma radius of C* = 40, αopt is 16.7°, which allows for a maximum of 21 distinct hues. However, in the HIV, we have 46 distinct protein types Σi mi distributed to five compartments n = 5. We use a minimum spacing s = 5°, so that our angular distance α between protein type colors is therefore below the minimum αopt:
| (2) |
This means that in the initial overview zoom-level protein colors can be very similar and hard to distinguish. In the overview zoom level, this effect is actually desirable to avoid salt and pepper noise. However, as we zoom in, we want increasing discriminability. We therefore introduce a view-dependent color adaptation approach to increase α dynamically, based on the current visibility.
4.1. View-Dependent Color Adjustment
As the user zooms in and explores the scene, large parts of the scene may not actually be visible in the current viewport, as is illustrated in the lower row of Figure 6 (a–c). In this configuration the color palette becomes underexploited. We therefore re-compute and optimize the color palette on-the-fly as proteins appear and disappear. An overview of the mechanism is illustrated in Figure 6.
To determine which protein groups occupy unnecessary space in the color palette, we extract visibility information by analyzing the previously rendered frame. For each protein group, we determine the number of visible protein types mi. A protein type is visible, if at least one screen pixel is occupied by a protein of type i. According to Equation 2, the angular distance α between the hues increases as the number of visible protein types across all protein groups Σi mi decreases.
As visualized in Figure 6d, the hue ring is divided proportionally to the protein groups’ numbers of visible proteins. As the number of visible protein types can be potentially small, we allow the user to determine a maximum angular distance of a protein group to avoid excessive color changes while panning.
4.1.1. Extracting Visibility Information
We leverage GPU computing in a post-processing operation, in order to compute the visibility of each protein type efficiently. Upon rendering, we generate an additional offline texture which contains, for each pixel, the unique identifier of the rendered protein. We priorly declare two GPU buffers which will, for each protein type, store the occupied pixel count and the total number of visible proteins, respectively. Subsequently, in a dedicated compute shader, we iterate through all the pixels, and we increment the pixel counter corresponding to the protein type stored in the video memory. At the same time, we also flag in a dedicated GPU buffer the proteins whose unique IDs are present in the generated texture. This information will allow us to determine the number of visible instances for each protein type. In a second pass and in a dedicated compute shader we then iterate through all the protein instances. For each protein which was flagged as visible in the previous pass, we increase the number of visible instances corresponding to the protein type. Since the computation is done in parallel it is important to use atomic intrinsic functions to increment the counters, in order to avoid concurrent access to the same value from two different threads.
4.1.2. Force-Based Hue Assignment
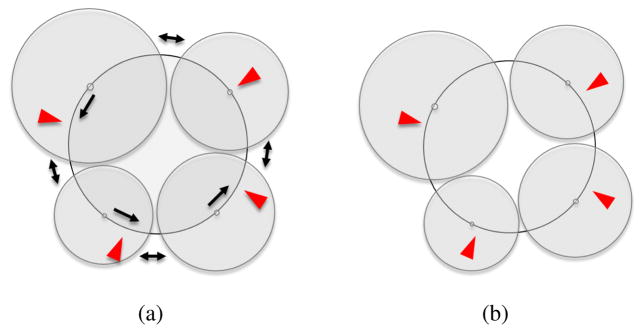
As we move the camera and affect the visibility of the proteins, the angles of the protein-group wedges on the hue ring are dynamically growing and shrinking. To determine the optimal location of the protein-group wedges on the hue ring, we use a force-based method to reposition the wedge centroids on the ring. We start by positioning a first wedge on the circle, and then place the remaining wedges subsequently on the circle, as illustrated in Figure 7a. While the position of the first wedge on the hue ring can be arbitrarily defined with this approach, the other wedges are not guaranteed to be located as near as possible to their default centroid (i.e., the initially assigned wedge centroid with all visible protein types). This could lead to unnecessarily large hue shifts for some protein groups while navigating, as shown in Figure 7a.
Figure 7.
Force-based hue assignment: Initial wedge placement (a) and resulting force-based placement (b). Red arrows indicate the default hues for the wedge centroids, and black arrows represent the forces.
To avoid this issue, we use a force-based layout for the positioning of the group centroids on the hue ring. The forces are applied in a single dimension, i.e, along the hue ring, and include distance constraints between the groups as well as attraction forces between groups and their default positions. We then integrate the forces, using Euler Integration to compute the new positions of the groups until reaching a state of equilibrium. For a given group i, the distance-constraint response-force with another group j is computed as follows:
| (3) |
where l corresponds to the direction of the response, i.e., whether the hue angle should increase or decrease, g is the position of the group centroid, and r is the radius of the distance constraint and corresponds to the protein group’s wedge radius plus the spacing between group wedges. In other words, the force-based hue assignments aims to keep the resized wedges close to their default centroids, while avoiding overlaps between neighboring wedges. For a single group, the overall forces – comprising of attraction and repulsion forces – are computed as follows:
| (4) |
The first part of the right side of this equation corresponds to the attraction forces, where I corresponds to the initial group position. The second part is the sum of repulsion forces between the given group and the other ones. Additionally we also include a damping value of 0.2 (reduce velocity by 20% per time step) in the integration calculus to smooth-out the motion of the group centroids when the viewport and visibility configuration abruptly change. This does not affect the final color assignment for a view, merely the transition.
4.2. Hierarchical Colors
As we zoom further into the details of the proteins, we begin to reveal the colors corresponding to the following levels (domains, secondary structures, atoms). To ensure logical transitions between levels and to maintain hierarchical information, we introduce a hierarchical hue picking method. For each protein type, the hue ring is further sub-divided into wedges to color-code protein domains, and individual protein-domain hues can further be sub-divided to secondary-structure wedges.
To select hues for m protein domains, the angular distances γ between the domain hues are calculated as follows:
where β is the maximum size of the domain wedge and αopt is the optimal angular distance, as defined in Section 4. This means that the wedge will grow linearly with the number of domains until it reaches the angle β, at which point the angle between domains will start to shrink. We set β to 180 so that a single protein would not cover more than half of the hues. A larger β could lead to a loss of hierarchical information. Choosing a lower β may cause domains within a single protein to be hardly distinguishable. The domain hue wedge is centered around the protein hue value, as illustrated in Figure 8. Mind that domain hue wedges can overlap across proteins. This is another major difference to the hierarchical coloring technique introduced by Tennekes and de Jonge [TdJ14], who assigned unique, yet hardly distinguishable colors on all zoom levels for static tree visualizations. In our case, being able to clearly distinguish domains is an important task in structural biology, which is difficult without clearly distinguishable colors. To overcome misinterpretation caused by overlapping hue wedges between proteins, we added context-de-saturation on demand.
Figure 8.
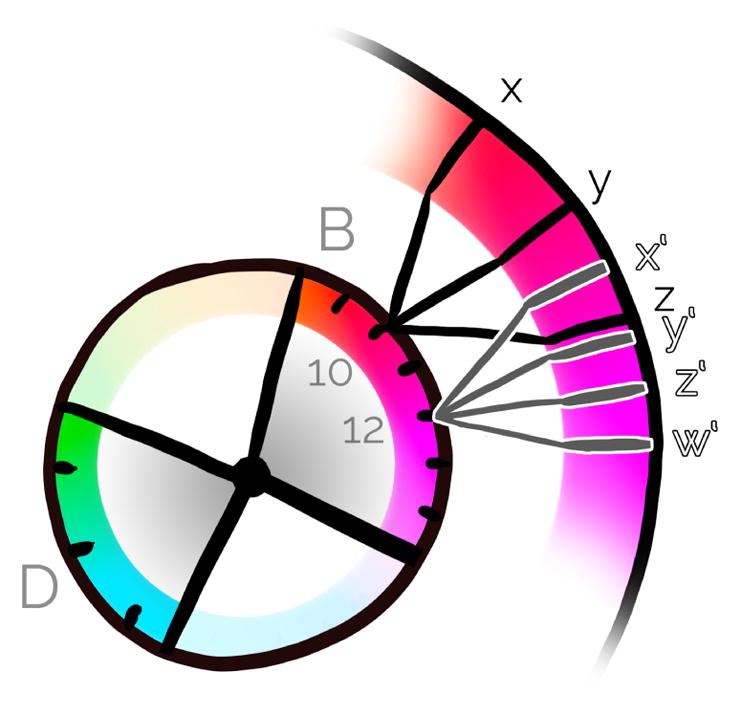
Hierarchical color assignment for the protein chains. The spacing between the protein domains (x,y,z) and (x’,y’,z’,w’) is predetermined based on the number of domains, and domain-hue wedges can also overlap.
4.2.1. Interpolating Between Levels
The individual zoom levels (compartment, proteins, domains, etc.) are associated with specific distances of the camera to the scene. In our HIV example, distance values were chosen so that the structures associated with the zoom levels were optimally visible. Assigning zoom levels to camera distances is task-dependent. Some items, like atoms and amino acids, have very similar sizes (see Figure 9) and would therefore occupy similar zoom ranges, i.e. it is not possible to uniquely determine what information a user would be interested in for some camera distances. Thus, it depends on the users’ priorities to select or omit certain levels for color coding.
Figure 9.
Illustration of the scales of HIV. Note that some items have very similar sizes, like atoms and amino acids.
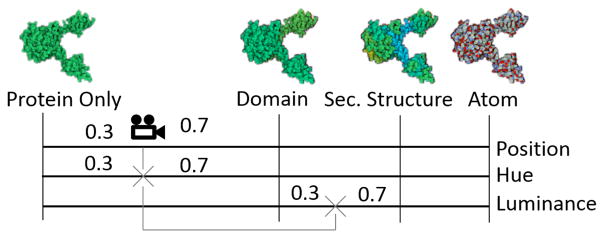
To smoothen the transition between zoom levels, we interpolate the hue values in between the levels. This transition is performed in post-processing on the GPU, in a dedicated shader program. In addition to the unique protein identifier texture mentioned in Section 4.1.1, we also generate an additional offline texture upon rendering, which contains the unique identifier of each rendered atom. While iterating through all the pixels, we fetch their unique atom identifiers from the offline texture. The identifiers allow us to collect, directly from the shader program, all the needed information concerning the rendered atoms, and the identifiers were priorly uploaded to the video memory (group, protein type, domain, secondary structure, and atom type). We also use the previously rendered depth texture to retrieve the world-space position of a pixel in the shader. Then, from the world position of each pixel, we compute the world space distance to the camera. From the camera distance we are able to compute the current degree of transition between the closest levels, as well as the hue values associated with the two closest zoom levels. Finally, the hue of a fragment is computed by performing a linear interpolation of the hue value of the two levels, as illustrated in Figure 10.
Figure 10.
Interpolation of hue and luminance values for a fragment: based on the world space distance to the camera, the interpolation factor between the two closest levels (protein and domain) is computed and used as blending factor between protein and domain hue, as well as domain and secondary structure luminance offset.
In our current implementation, users have to define the camera distances for the zoom levels manually. In the future, we plan to investigate automatic camera-distance settings, based on the screen size of the structures associated with the zoom levels.
4.2.2. Pre-Defined Color Palettes
In some cases, it can be desirable to use pre-defined color palettes instead of automatically calculated categorical colors. In our HIV showcase, we use pre-defined atom color codes for the highest zoom level (see Figure 1e), to support domain knowledge, such as CPK coloring for atoms. In this case, Chameleon simply blends to those pre-defined colors when zooming to the atomic level.
5. Context Desaturation
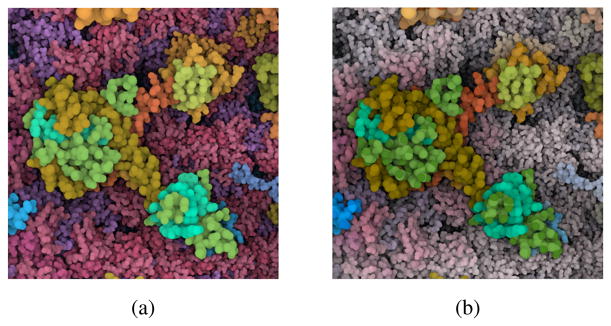
Due to our hierarchical color assignment, domain colors of neighboring proteins or secondary structures of neighboring domains may be assigned identical colors (Figure 8). To increase color discriminability, and reduce occurrence of similar colors, we modulate the chroma to generate a focus+context effect. By clicking on a protein of interest, we define a spherical 3D region around the protein, which constitutes the focus region. Outside this region, we progressively decrease the chroma value down to 0 as we zoom towards the focused protein, to ensure optimal color discriminability of the focus protein’s colors with respect to all other colors in the scene, as can be seen in Figure 11.
Figure 11.
Without (a) and with (b) desaturated peripheral colors.
6. Luminance Modulation
So far, we used the hue channel to discriminate structures on different zoom levels and the chroma to distinguish focus proteins from the context. The final color channel we manipulate is luminance. Molecular illustrators sometimes use the luminance channel to indicate structural properties in lower hierarchy levels, as shown in the close up in Figure 2 or in the "Molecule of the Month" [Goo13]. This is a reasonable choice, given that hue is known to be an effective channel to encode low-frequency information, while luminance is more effective to encode high-frequency information [BRT95]. In addition, encoding information from an additional zoom level can support orientation when blending between zoom levels.
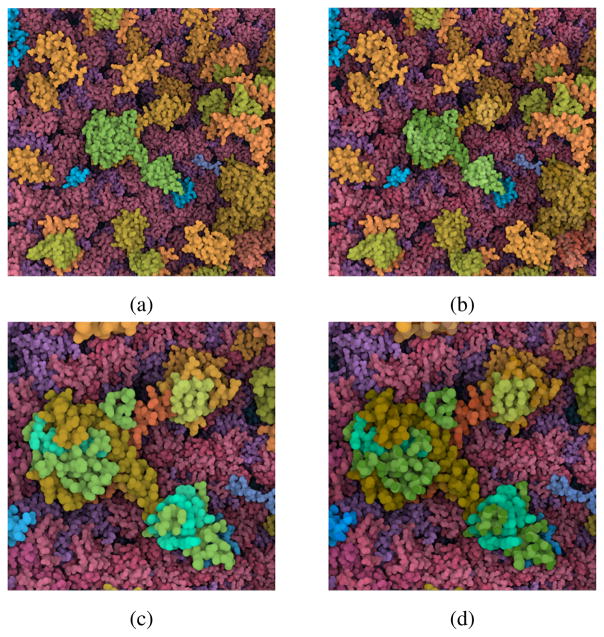
For each hierarchy level, we therefore not only assign unique hues, but also unique luminance values. We modulate our base luminance value of 75 by up to a value of 15, as illustrated in Figure 12. With this small modulation, the luminance channel serves only as a subtle indication of lower-level structural properties, to avoid extensive visual clutter and not to interfere with shading cues.
Figure 12.
Comparison of domain level (top) and secondary structures level (bottom) without (left column) and with (right column) luminance modulation.
Like the hue, the luminance value is defined by the distance of the camera to the respective structures. Given an interpolation factor derived from the zooming distance to the pre-defined zoom levels (see Figure 10), luminance values are interpolated between the next two hierarchy levels with the current interpolation factor, as illustrated in Figure 10, bottom line. This way, the hue and the luminance encode different hierarchy levels and thereby generate an effect similar as shown in the close up in Figure 2.
7. Results
To showcase the capabilities of the Chameleon, we applied it to a mesoscale molecular scene. The dataset was provided by domain experts and modeled with cellPACK [JAAA*15], a tool for the procedural generation of large biomolecular structures, incorporating the most recent knowledge from structural and systems biology. We use cellVIEW [LMAPV15] for the rendering part, which is a tool designed to efficiently render large molecular scenes on the GPU and is implemented in Unity3D.
The dataset which we showcase is a model of an HIV particle in the blood serum which contains 20502 instances of 46 different protein types including two lipid membrane layers. The protein types are grouped together based on their location. There are 6 different protein groups in the dataset; the blood plasma proteins (18 types), the lipids (2 types), the envelope surface (5 types) and interior proteins (15 types), the capsid surface (1 type) and proteins inside the capsid (5 types). Figure 1 shows progressive zooming from the entire virus to single atoms. Initially, the blood plasma proteins in green, and the matrix protein in purple, dominate the color palette because they have more protein types than other compartments, like the orange capsid proteins. As we get closer to the capsid proteins, we observe that the colors become more distinguishable. To visualize the results of the view-dependent color-palette optimization more precisely, we also developed a palette widget, shown in Figure 13, bottom left.
Figure 13.
Various snapshots from the Chameleon system. As the camera position changes, the discriminability between protein types is optimized. The color palette widget at the bottom left allows us to visualize the distribution of the groups along the hue ring. The hue ring is not intended to be directly interpreted. It is a technical complement to support intuitive understanding.
Chameleon relies on GPU computing to provide a smooth and responsive user experience. Since we perform all the coloring operations in post-processing, the size of the dataset has only little impact on the performance. We benchmarked the computation speed at HD resolution (1920×1080) on a machine equipped with an Intel Core i7-3930 CPU 3.20 GHz machine coupled with a GeForce GTX Titan X graphics card with 12 GB of video RAM. We measured 0.5 ms on average to count the visible instances when zooming out on the entire dataset, which is the most extreme case since a very large number of proteins are visible. It took 1.2 ms to compute the screen pixel coverage of the protein types with the same configuration. The last stage of the pipeline, in which we assign the final hue, chroma, and saturation values to each pixel, took 1.3 ms on average. This also includes the cost of reading back the visibility information to the CPU for the force-based hue assignment.
8. User Study
Since interactively explorable multi-scale visualizations of biology models have only become available very recently, there is no comparable approach how to represent biological structures across multiple scales. Dynamic visual discrimination, apart from geometric levels of detail [PJR*14], have not been studied so far in the biological field. We therefore decided for a qualitative evaluation since there is no clear baseline for a comparative lab experiment, in order to answer two research questions:
Does Chameleon color mapping support discrimination of structures on multiple scales?
Are the dynamic color changes by Chameleon distracting / unpleasant in the exploration process?
To answer these two research questions, we asked five students and professionals in the field of biology to perform two tasks. In the first task (structure identification task), users were asked to identify structures on multiple levels of detail. We based our task description on the a previous publicly available description of the HIV capsid at PDB-101 [Goo13] Based on this description of the HIV capsid, users were asked to identify the following structures:
one of the 12 pentamer capsid proteins,
the N-terminal and C-terminal domain of the capsid protein,
the alpha helix in the N-terminal domain stabilizing the hexamers / pentamers,
the binding site of Cyclophilin A, which is a loop on the surface of the capsid protein with several proline amino acids, and
one methionine amino acid within the alpha helix.
The last item was not included in the expert’s task description, but was added as a representative task on the amino acid and atom level, respectively. Since we did not color-code the amino acid level explicitly, users were given the hint to identify methionine based on the coloring of its sulfur atom. To assess the performance in the structure identification task, we recorded whether users were able to correctly identify the above listed structures. In the subsequent free exploration task, users could freely navigate through the visualization, while thinking aloud. All reported insights were noted. Both tasks were video-taped and followed by a questionnaire and a semi-structured interview. Before the study, users could play around with the tool to get familiar with the navigation, and were also instructed how to toggle the visibility of the protein groups.
With the structure identification task, we could assess whether experts with sufficient knowledge to understand molecular structures without additional text labels are able to identify the above structures using our system. While our color mapping provided the necessary discrimination of individual structures in the respective zoom levels, the identification of the structures was only possible through their structural properties. Through the free exploration task, our goal was to assess whether users would notice and be distracted by our dynamic color mapping.
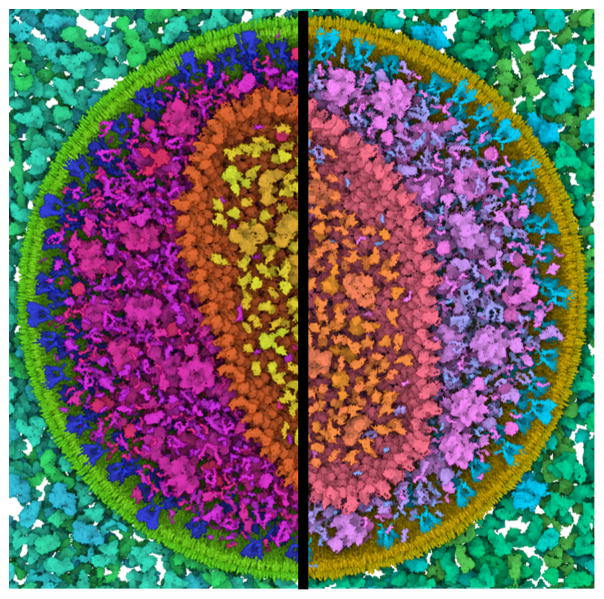
Mind that structural information alone is not sufficient to identify structures below the protein level, as shown in Figure 14. In addition, performance measures of such complex tasks are rather hard to compare with only a small number of expert users performing the study.
Figure 14.
Comparison between static protein coloring (left) and hierarchical color coding using Chameleon (right) for viewing a capsid protein hexamer on the protein domain level.
We report observations, questionnaire results, and feedback from five experts or students in the field of molecular biology (2 PhD students, one Post-Doc, one pharmacist, and one master student; one female, aged 24 to 31, all with normal or corrected-to-normal vision). While the method is also aimed at the general audience, no such users were involved in the study. The task description for such users would have to be rather long and detailed, leading likely to issues with text comprehension or revealing too much information.
8.1. Results
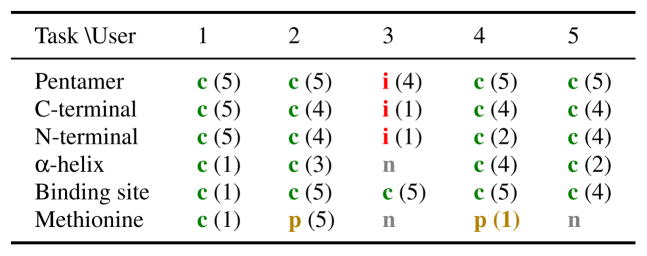
Table 1 summarizes the performance of users in the structure identification task. Except for user 3 (the pharmacist), all users were able to correctly identify all structures down to the secondary structure level. User 3 mixed up the N and C terminals of the capsid protein, and the rest of the tasks are to some degree based on finding them. With regards to the amino acid, there was more than one kind of amino acid with a sulfur atom, and two users mistook it for the correct one.
Table 1.
Structure identification task:
 identified correct item,
 partially correctly identified item,
 identified incorrect item,
 nothing found. User-reported certainty shown on a scale of 1 (lowest) to 5 (highest).
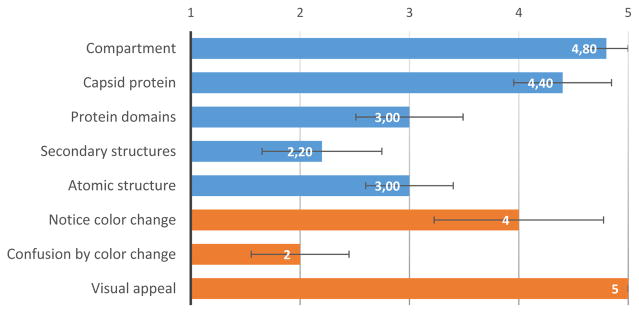
In the questionnaire, users assessed the identification of compartments, but also the proteins, as very easy (see Figure 15). However, the domain and secondary structure identification was rated as much more difficult. This is also reflected in the users’ self-reported certainty of the identified structures (Table 1). While the users were quite certain about the identity of a pentamer capsid, once they spotted it, they were least certain about the alpha helices stabilizing the hexamers and pentamers. All users, except for user 3, were able to identify the C- and N-terminal domains of the capsid proteins. All those users verbally referred to the domains by color. Two users also referred to the alpha helices by color.
Figure 15.
Average and standard error of responses on five-point Likert scale for questions concerning the ease of identification of structures (blue), as well as color changes and visual appeal (orange).
In the free exploration task, all except for user 3 explored the virus. On average, they spent 10 minutes for exploration. Some users reported that they learned something new when exploring the visualization, such as that “HIV uses [the] host membrane” and “how crowded everything is”. The four users focused on different parts of the virus during their free exploration, such as the membrane (user 1 and 5), the proteins in the matrix (user 1 and 4), and the amino acids of the Cyclophilin A binding site (user 2).
In the questionnaire, most users indicated that they the color change (see Figure 15), but the confusion caused by these color changes were rated fairly low. When asked about the changing colors in the post-experiment interview, all users reported that they noticed changing colors when zooming to the atomic level. However, only one user noticed it on all levels, while a second one thought “something odd” was occurring on the secondary structure level.
In general, our users all issued the highest possible grade for visual appeal in our questionnaire. In the post-experiment interview, they explained that they considered the tool useful for presenting their research and educating students – which is in line with our research goals. However, they also had suggestions for improvement, such as adding text labels, visually marking the termini of the protein domains, and providing a cartoon representation for secondary structures.
8.2. Summary and Discussion of Results
The performance and feedback of the molecular biologists in our study indicate that Chameleon supports users in identifying molecular structures on multiple scales. Users were equally successful identifying one of the capsid proteins forming a pentamer, and identifying the two domains of the capsid protein. The pentamer capsid protein differed only in shape from the more frequent hexamer capsid proteins, while the two different domains of the capsid proteins were encoded by color. However, the users reported lower certainty and higher task difficulty for the identification of the domains. This is an indication that identification by structure is easier than identification by color alone – yet, color can be used if no strong structural cues are available, as in our protein domain example.
On the secondary structures level, the identification rate was similarly high, but users were quite uncertain about their findings and reported a high task difficulty. On this level, alpha helices and beta sheets were discriminated by color, similar to Figure 12. However, the particular alpha helix mentioned in the task description could only be identified as a helix by shape. The request for an alternative cartoon representation for identifying structures on this level shows the limits of multi-scale color mapping without adapting the structural representation. In the future, it will be important to explore combinations of semantic zooming comprising both, structural and color information.
User feedback shows that our system’s dynamic color changes do not interfere with the users’ workflow. While protein domains and secondary structures were mainly referred to by their color, only few users noticed the color changes (except at the atomic level) and none found them confusing. All users found the visualization highly appealing and useful for presentation and education purposes. We therefore conclude that Chameleon is a valuable extension to multi-scale molecular visualization and does not cause any notable distraction, but allows for efficient and pleasing visual encoding of protein sub-structures.
9. Conclusion and Future Work
The work presented here is a method that is capable of visualizing a hierarchical, cell-like structure on different levels in a coherent and cohesive manner using color. The hierarchical structure of the coloring technique, along with the visibility based subtle variation in color allows users to navigate and inspect parts of the visualization without getting disorientated, while being subtle. Altering the color based on semantic zooming changes the meaning of color coding. Instead of discriminability for any situation, semantic color changes allow structures to be clustered or seperated as necessary. This is achieved while maintaining the connection between structures on different levels in a logical manner via the hierarchical nature of the coloring. Furthermore the coloring scheme is capable of showing structures on each level in a visually distinct manner. The user study performed with our research prototype shows that experts can find information in an HIV dataset on each level, while not being distracted by the dynamic color mapping.
While we demonstrated Chameleon on our HIV showcase with five zoom levels, we plan to extend our approach to more general use cases in the future – in the biology domain and beyond. Currently, the hues of the overview level are initially assigned using a force-based layout and are sub-divided at lower hierarchy levels. In the future, we plan to investigate methods with consistent hue assignments across all levels.
Supplementary Material
Acknowledgments
The first two authors contributed equally. This project has been funded by the Vienna Science and Technology Fund (WWTF) through project VRG11-010 and supported by EC Marie Curie Career Integration Grant through project PCIG13-GA-2013-618680 and the Austrian Science Fund FWF trough project T 752-N30.
References
- [BRT95].Bergman LD, Rogowitz BE, Treinish LA. A rule-based tool for assisting colormap selection. Proceedings of the 6th conference on Visualization’95; 1995; IEEE Computer Society; p. 118. [Google Scholar]
- [BSM*15].Bernard J, Steiger M, Mittelstädt S, Thum S, Keim D, Kohlhammer J. IS&T/SPIE Electronic Imaging. International Society for Optics and Photonics; 2015. A survey and task-based quality assessment of static 2d colormaps; pp. 93970M–93970M. [Google Scholar]
- [CWM09].Chuang J, Weiskopf D, Möller T. Hue-preserving color blending. Visualization and Computer Graphics, IEEE Transactions on 15. 2009;6:1275–1282. doi: 10.1109/TVCG.2009.150. [DOI] [PubMed] [Google Scholar]
- [FKE13].Falk M, Krone M, Ertl T. Computer Graphics Forum. Vol. 32. Wiley Online Library; 2013. Atomistic visualization of mesoscopic whole-cell simulations using ray-casted instancing; pp. 195–206. [Google Scholar]
- [Goo13].Goodsell D. Pdb-101 molecule of the month: Hiv capsid. 2013 http://pdb101.rcsb.org/motm/163. [Online]
- [HB03].Harrower M, Brewer CA. Colorbrewer.org: an online tool for selecting colour schemes for maps. The Cartographic Journal. 2003;40(1):27–37. [Google Scholar]
- [Hea96].Healey CG. Visualization’96. Proceedings. IEEE; 1996. Choosing effective colours for data visualization; pp. 263–270. [Google Scholar]
- [Iha03].Ihaka R. Colour for presentation graphics. Proceedings of DSC. 2003:2. [Google Scholar]
- [JAAA*15].Johnson GT, Autin L, Al-Alusi M, Goodsell DS, Sanner MF, Olson AJ. cellpack: a virtual mesoscope to model and visualize structural systems biology. Nature methods. 2015;121:85–91. doi: 10.1038/nmeth.3204. [DOI] [PMC free article] [PubMed] [Google Scholar]
- [KKL*15].Kozlikova B, Krone M, Lindow N, Falk M, Baaden M, Baum D, Viola I, Parulek J, Hege H-C, et al. Visualization of biomolecular structures: state of the art. Eurographics Conference on Visualization (EuroVis)-STARs; 2015; The Eurographics Association; [Google Scholar]
- [LKS*15].L’Yi S, Ko B, Shin D, Cho Y-J, Lee J, Kim B, Seo J. Xclusim: a visual analytics tool for interactively comparing multiple clustering results of bioinformatics data. BMC bioinformatics. 2015;16(Suppl 11):S5. doi: 10.1186/1471-2105-16-S11-S5. [DOI] [PMC free article] [PubMed] [Google Scholar]
- [LMAPV15].Le Muzic M, Autin L, Parulek J, Viola I. cellview: A tool for illustrative and multi-scale rendering of large biomolecular datasets. Proceedings of the Eurographics Workshop on Visual Computing for Biology and Medicine; 2015; Eurographics Association; pp. 61–70. VCBM ’15. [DOI] [PMC free article] [PubMed] [Google Scholar]
- [LMPSV14].Le Muzic M, Parulek J, Stavrum A-K, Viola I. Computer Graphics Forum. Vol. 33. Wiley Online Library; 2014. Illustrative visualization of molecular reactions using omniscient intelligence and passive agents; pp. 141–150. [Google Scholar]
- [LSS13].Lee S, Sips M, Seidel H-P. Perceptually driven visibility optimization for categorical data visualization. Visualization and Computer Graphics, IEEE Transactions on. 2013;19(10):1746–1757. doi: 10.1109/TVCG.2012.315. [DOI] [PubMed] [Google Scholar]
- [LVRH07].Lampe OD, Viola I, Reuter N, Hauser H. Two-level approach to efficient visualization of protein dynamics. Visualization and Computer Graphics, IEEE Transactions on. 2007;13(6):1616–1623. doi: 10.1109/TVCG.2007.70517. [DOI] [PubMed] [Google Scholar]
- [MBS*14].MittelstÃďdt S, Bernard J, Schreck T, Steiger M, Kohlhammer J, Keim DA. EuroVis - Short Papers. The Eurographics Association; 2014. Revisiting Perceptually Optimized Color Mapping for High-Dimensional Data Analysis. [Google Scholar]
- [Med16].Medialab: i want hue. 2016 http://tools.medialab.sciences-po.fr/iwanthue/ [Online]
- [MSK14].Mittelstädt S, Stoffel A, Keim DA. Computer Graphics Forum. Vol. 33. Wiley Online Library; 2014. Methods for compensating contrast effects in information visualization; pp. 231–240. [Google Scholar]
- [PJR*14].Parulek J, Jönsson D, Ropinski T, Bruckner S, Ynnerman A, Viola I. Computer Graphics Forum. Vol. 33. Wiley Online Library; 2014. Continuous levels-of-detail and visual abstraction for seamless molecular visualization; pp. 276–287. [Google Scholar]
- [RCS11].RCSB PDB: The structural biology of hiv. 2011 http://pdb101.rcsb.org/learn/resource/the-structural-biology-of-hiv-flash. [Online]
- [SBT*15].Steiger M, Bernard J, Thum S, Mittelstädt S, Hutter M, Keim DA, Kohlhammer J. Explorative analysis of 2d color maps. International Conference in Central Europe on Computer Graphics, Visualization and Computer Vision (WSCG 2015); 2015; pp. 151–160. [Google Scholar]
- [TdJ14].Tennekes M, de Jonge E. Tree colors: Color schemes for tree-structured data. Visualization and Computer Graphics, IEEE Transactions on. 2014;20(12):2072–2081. doi: 10.1109/TVCG.2014.2346277. [DOI] [PubMed] [Google Scholar]
- [WGM*08].Wang L, Giesen J, McDonnell KT, Zolliker P, Mueller K. Color design for illustrative visualization. Visualization and Computer Graphics, IEEE Transactions on. 2008;14(6):1739–1754. doi: 10.1109/TVCG.2008.118. [DOI] [PubMed] [Google Scholar]
Associated Data
This section collects any data citations, data availability statements, or supplementary materials included in this article.


