Abstract
Metoprolol tartrate is rapidly absorbed from both gastric and intestinal regions, after oral administration. To retard the release rate of the metoprolol tartrate, microspheres were prepared with varying concentrations of a mixture containing ethylcellulose and polyethylene glycol-6000. The prepared microspheres were evaluated for various physicochemical characteristics and in vitro drug release. The percent yield of microspheres was in the range of 75.2–87.3%. The particle size of microspheres was found to be in the range of 73.2–85.5 μm. Fourier transform-infrared spectral analysis and differential scanning calorimetry concluded the absence of any interaction between the drug and the carriers. The release time profile of metoprolol tartrate from microspheres in 0.1 N hydrochloric acid solution was to the extent of 33.4–60.2%. The complete release of metoprolol tartrate occurred from MPT-3 and MPT-4 in phosphate buffer solution (pH 7.4) within 8 and 7 h, respectively, whereas the incomplete release (72.3%) occurred from MPT-1. Nearly, the complete release (98.5%) of metoprolol occurred from MPT-2 in 10 h. Formulation MPT-2 would be a preferred formulation. The release of metoprolol involves diffusion rate limited (R2 = 0.9865) as a mechanism from drug release. The prepared microspheres of metoprolol tartrate eliminate the need for multiple dosing and provide patient compliance.
Keywords: metoprolol tartrate, microspheres, solvent evaporation, controlled drug delivery, antihypertensive drugs
Introduction
Antihypertensive drugs were currently available in the market largely in the form of conventional dosage forms. Due to limitations in the use of conventional dosage forms, alternative dosage forms such as sustained release products were developed. There was a need to develop controlled release drug delivery systems for these categories, so as to optimize the therapy and accrue the benefits enumerated in the controlled release drug delivery systems. One such approach is using polymeric microspheres as drug carriers [1, 2].
Metoprolol tartrate is a selective β-adrenergic receptor blocking agent and commonly used for the treatment of mild to moderate hypertension and stable angina. It is beneficial in postinfarction patients. It is freely soluble in water, acidic, and alkaline solutions. Hence, the drug is rapidly absorbed from both gastric and intestinal regions after oral administration. To retard the release rate of the drug, microspheres were prepared with varying concentrations of a mixture of two polymers: a water-insoluble polymer, ethylcellulose (EC), and a water-soluble polymer, polyethylene glycol-6000 (PEG-6000).
EC, if used alone, a hydrophobic water-impermeable matrix would be formed around the drug particles. Then, the release of the metoprolol tartrate would be very slow. To enhance the release rate of the drug, a second polymer PEG-6000 was incorporated into the formulation such that the drug particles are surrounded with both EC and PEG. These microspherical particles when come in contact with gastrointestinal fluid, the fluid permeates into the particles, solubilizes the PEG, and makes the matrix permeable. The drug then becomes soluble and passes through the channels made by the dissolution of PEG. The rate of release of the drug from the microspheres can be controlled by varying the concentration of EC and PEG.
Materials and Methods
Metoprolol tartrate (Astra-IDL, Bangalore, India), ethyl cellulose (Loba Chemie Pvt Ltd., Mumbai, India), and PEG-6000 (Central Drug House, Mumbai, India) of commercial purity grade were used. All other chemicals used were of analytical reagent grade.
Preparation of microspheres of metoprolol tartrate
Microspheres were prepared by the solvent evaporation method [3, 4]. EC (200 mg) was dissolved in chloroform (10 ml) to make a 2% solution. Weighed quantity of PEG-6000 (Table I) was dissolved in the above dispersion. Metoprolol tartrate was dissolved in the above polymer solution by stirring at about 500 rpm. This mixture was added slowly with continuous stirring into liquid paraffin. Stirring was continued for 2 h at about 2,000 rpm. Then, the solvent was removed by heating the mixture at 60–70 °C for 2 h. Microspheres were separated by filtration and washed several times with n-hexane. These were dried at 50 °C for 4 h. The dried microspheres were passed through #100 (150 μm) and stored in a desiccator under anhydrous calcium chloride. Using the same method, microspheres were prepared with different concentration of polymers as shown in Table I.
Table I.
Composition of polymers and metoprolol tartrate for microspheres
| Formulation code | Volume of 2% w/v EC solution, ml (mg)a | Amount of PEG (mg) | Amount of MT (mg) | EC:PEG:MT (w/w) |
|---|---|---|---|---|
| MPT-1 | 10 (200) | 100 | 500 | 1:0.5:2.5 |
| MPT-2 | 10 (200) | 200 | 500 | 1:1:2.5 |
| MPT-3 | 10 (200) | 300 | 500 | 1:1.5:2.5 |
| MPT-4 | 10 (200) | 400 | 500 | 1:2:2.5 |
Values in parenthesis represent weight of EC (mg)
Characterization of microspheres
Percent yield
Weight of the microspheres obtained for each batch was determined [3, 5]. The percentage yield of microspheres was calculated on the dry weight basis (drug and carriers), and the final weight of microspheres was obtained. The percent yield was calculated using the equation given below.
Particle size analysis
The microscopic method was used for particle size analysis. The microspheres were dispersed in liquid paraffin, mounted on a slide, and placed on the mechanical stage of microscope. The microscope eyepiece was fitted with an ocular micrometer, which was calibrated with a stage micrometer under 10 × 45 magnification. The size of about 200 particles was measured and the average particle size was calculated [3, 6].
Drug content
The drug content in microspheres was estimated by the UV spectrophotometric method. The absorbance of the solutions of metoprolol tartrate prepared with polymers did not show shift in the λmax, and the absorbance was found to be the same in both the presence and the absence of polymers. Microspheres (100 mg) were accurately weighed and dissolved in 100 ml of water. The solution was filtered and suitably diluted. The absorbance was measured at 274 nm. The drug content and the percent drug entrapment were calculated using respective regression equations [3, 5].
In vitro release studies
Microspheres equivalent to 100 mg of pure drug were taken for release studies. Release studies were carried out in 900 ml of 0.1 N hydrochloric acid solution (pH 1.2) for 2 h and in 900 ml of phosphate buffer (pH 7.4) for 8 h at 50 rpm and 37 ± 0.5 °C. The 5 ml sample of the dissolution medium was withdrawn at different time intervals. After each withdrawal, an equal volume of dissolution medium was replaced. The absorbance was measured at 274 nm, and the percent drug released was calculated using respective regression equations [3, 5, 7, 8].
Kinetic analysis of drug release
The in vitro release data were subjected to the kinetic analysis to establish the drug-release mechanism. The release data were fitted to zero-order (Equation 1), first-order (Equation 2), matrix (Higuchi model) (Equation 3), and Hixson–Crowell equations (Equation 4) to ascertain the kinetic modeling of drug release.
| (1) |
| (2) |
| (3) |
| (4) |
where Qt is the amount of drug released at time t, Q0 is the initial amount of drug in the formulation, and k0, k1, kH, and kHC are release rate constants for zero-order, first-order, Higuchi model, and Hixson–Crowell rate equations, respectively [9–14].
Results
The results data for the percent yield, drug content, and average particle size of microspheres (MPT-1 to MPT-4) were reported in Table II. A perusal to Table II indicated that percent yield of microspheres was in the range of 75.2–87.3%. A considerable amount of materials went into the microspheres (91.0–95.7%). This is quite common with the solvent evaporation method. The particle size of microspheres ranged from 3.27 to 163.5 μm, and the average diameter was found to be in the range of 73.2 to 85.5 μm (Table II).
Table II.
Characteristics of microspheres of metoprolol tartrate
| Formulation code | Percent yield | Percent drug content found (theoretical)a (mg) | Drug content/100 mg of microspheres (mg) | Percent drug entrapped (%) | Average particle size (μm) |
|---|---|---|---|---|---|
| MPT-1 | 87.3 | 59.4 (63) | 58.9 (62.5) | 94.2 | 76.8 |
| MPT-2 | 75.2 | 60.3 (63) | 53.1 (55.5) | 95.7 | 73.2 |
| MPT-3 | 82.4 | 58.2 (63) | 46.2 (50.0) | 92.4 | 81.2 |
| MPT-4 | 79.2 | 57.3 (63) | 41.4 (45.5) | 91.0 | 85.5 |
Values in parenthesis indicate theoretical amount of metoprolol (mg)
FT-IR analysis
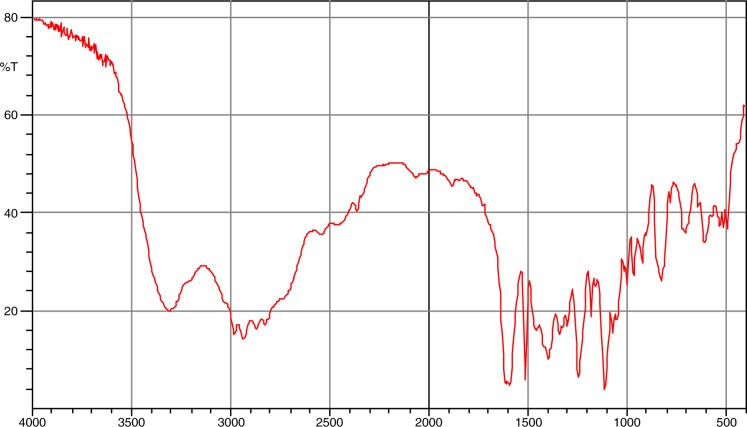
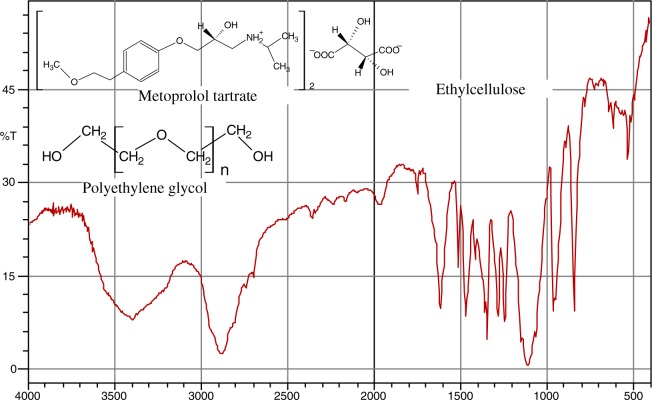
The Fourier transform-infrared (FT-IR) spectra of metoprolol and the mixture of metoprolol tartrate with polymers (EC and PEG-6000) are given in Figs 1 and 2, respectively. From these figures, the characteristic bands of metoprolol were identified and shown in Table III. All the characteristic bands of drug were observed. To a certain extent, broadening of bands was observed in the mixture.
Fig. 1.
FT-IR spectrum of metoprolol tartrate
Fig. 2.
FT-IR spectrum of 6-month-old metoprolol microspheres with EC and PEG-6000
Table III.
FT-IR characteristic bands of metoprolol tartrate
| Assignment of band | Metoprolol, cm−1 | Metoprolol in mixture of polymers, cm−1 |
|---|---|---|
| −NH2+, −OH Aliphatic and aromatic-CH | 3461–2452 | 3500–2800 |
| Carboxylic acid salt | 1573 | 1600 |
| Aromatic ring | 1573, 1512 | 1510 |
| Aromatic ether | 1249, 1109 | 1100 |
| Isopropyl group | 1249 | 1200 |
| Aliphatic ether (sec. alcohol) | 1109 | 1110 |
| 1,4-disubstituted benzene | 820 | 820 |
DSC analysis
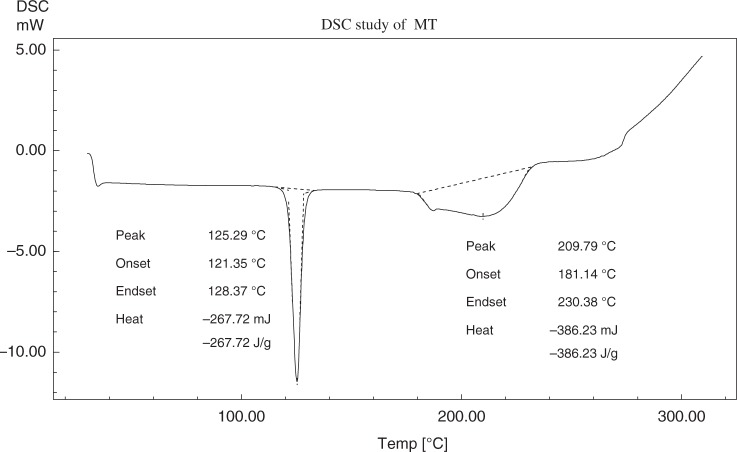
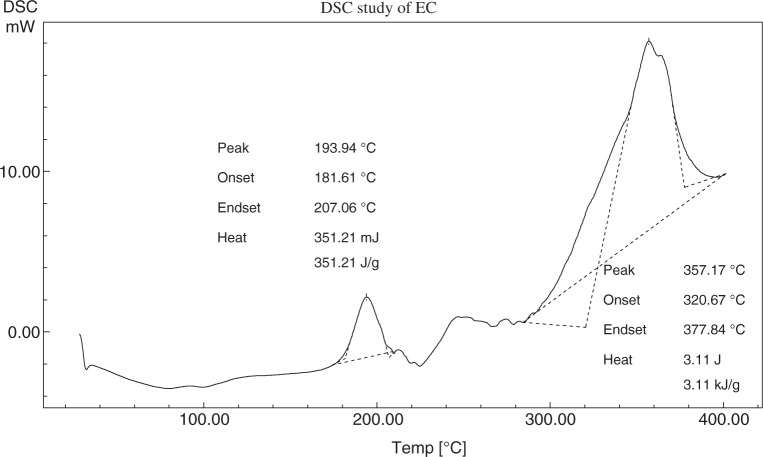
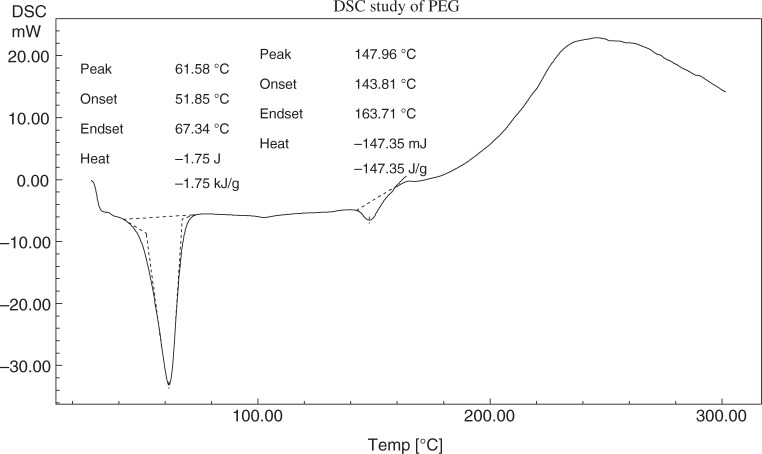
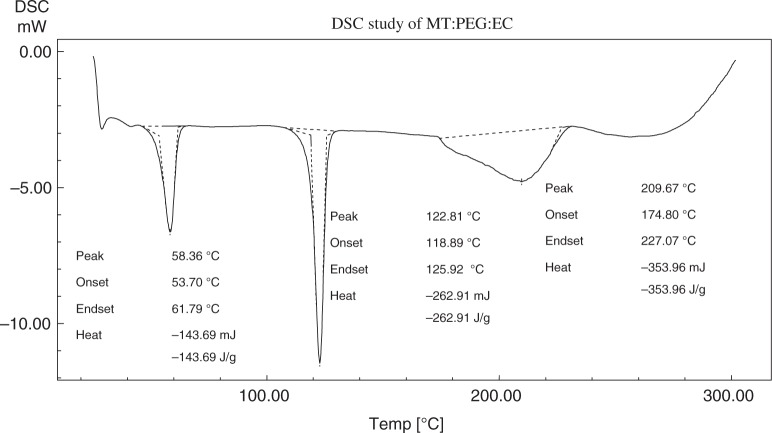
The differential scanning calorimetry (DSC) thermograms of metoprolol tartrate, EC, PEG-6000 (PEG), and the physical mixture of the above three components are shown in Figs 3–6, respectively. Metoprolol had shown the melting endotherm at 125.29 °C. This endotherm was reported at 122.81 °C in the mixture. There must be a depression in the fusion temperature on the account of other components. The melting endotherm of PEG was reported at 61.58 °C and a corresponding endotherm at 58.36 °C in the mixture. Again, there was a depression of fusion point PEG. EC did not exhibit characteristic melting endotherm due to melting with decomposition.
Fig. 3.
DSC thermogram of metoprolol tartrate
Fig. 4.
DSC thermogram of EC
Fig. 5.
DSC thermogram of PEG-6000
Fig. 6.
DSC thermogram of mixture of metoprolol tartrate, EC, and PEG
In vitro release studies
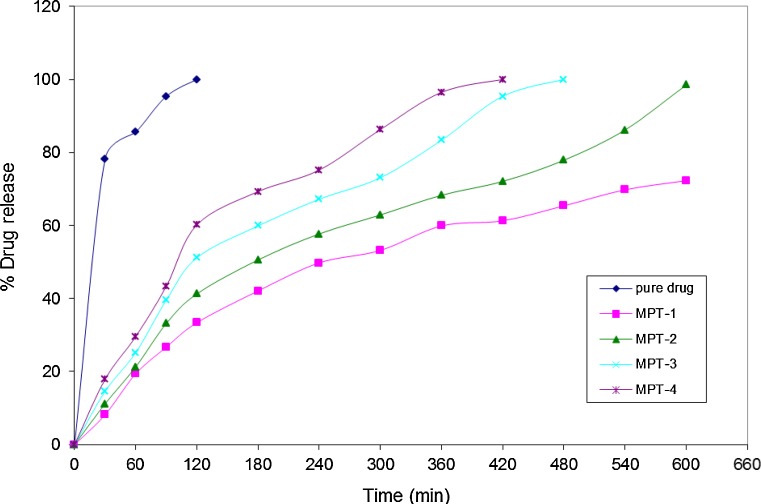
In vitro release studies of pure drug, metoprolol tartrate, and microspheres of metoprolol tartrate (MPT-1 to MPT-4) were conducted in 0.1 N hydrochloric acid solution (for 2 h) and phosphate buffer solution (for the next 8 h). In vitro drug release studies with pure metoprolol tartrate indicated that about 80% of the drug was released within first 30 min and complete release of the drug occurred in 2 h. The release time profile of metoprolol tartrate from microspheres in 0.1 N hydrochloric acid solution was to the extent of 33.4–60.2%. (Table IV and Fig. 7). The complete release of metoprolol tartrate from MPT-3 and MPT-4 occurred in phosphate buffer solution (pH 7.4) within 8 and 7 h, respectively, whereas incomplete release (72.3%) occurred from MPT-1. Nearly, complete release (98.5%) of metoprolol occurred from MPT-2 in 10 h. Hence, the formulation MPT-2 would be a preferred formulation, which contained metoprolol (500 mg), EC (200 mg), and PEG-6000 (200 mg).
Table IV.
Dissolution profile of microspheres of metoprolol tartrate
| Dissolution medium | Time (hr) | Percent drug released | ||||
|---|---|---|---|---|---|---|
| MT (pure drug) | MPT-1 | MPT-2 | MPT-3 | MPT-4 | ||
| 0.1 N HCl solution, pH 1.2 | 0 | 0 | 0 | 0 | 0 | 0 |
| 0.5 | 78.3 | 8.2 | 11.2 | 14.6 | 17.9 | |
| 1.0 | 85.6 | 19.4 | 21.3 | 25.2 | 29.6 | |
| 1.5 | 95.4 | 26.7 | 28.2 | 39.6 | 43.4 | |
| 2.0 | 100 | 33.4 | 35.0 | 51.2 | 60.2 | |
| Phosphate buffer solution, pH 7.4 | 3.0 | 42.1 | 45.1 | 59.9 | 69.3 | |
| 4.0 | 49.8 | 53.8 | 67.2 | 75.2 | ||
| 5.0 | 53.2 | 62.9 | 73.1 | 86.3 | ||
| 6.0 | 59.9 | 68.3 | 83.4 | 96.5 | ||
| 7.0 | 61.3 | 72.6 | 95.4 | 100 | ||
| 8.0 | 65.4 | 79.0 | 100 | |||
| 9.0 | 69.8 | 86.1 | ||||
| 10.0 | 72.3 | 98.5 | ||||
Fig. 7.
Dissolution profile of metoprolol from microspheres (MPT-1 to MPT-4)
The release of metoprolol followed the zero-order kinetics, as the R2 value was higher for the zeroth order (R2 = 0.9642) than for the first order (R2 = 0.8260), and the release mechanism of metoprolol was diffusion rate limited (R2 = 0.9865) from microspheres. In diffusion, the rate of drug dissolution within the matrix must be much higher than that of the diffusion rate of the drug leaving the matrix.
Discussion
Percent drug content in metoprolol microspheres was found to be approximately equal to the theoretical value (Table II), which proved that there was no significant degradation or loss of the drug during the heating process for evaporation of the solvent.
From these observations obtained from FT-IR spectral analysis, it can be concluded that the absence of any significant change in the IR spectral pattern in the formulations containing the drug and carriers indicated the absence of interaction between the drug and the carriers employed for the preparation of microspheres. DSC studies further supported that there was no incompatibility between metoprolol tartrate, EC, and PEG-6000 [12].
The in vitro results revealed that using a combination of EC and PEG-6000, the release rate of metoprolol tartrate can be controlled. As the proportion of PEG-6000 increases, the release of metoprolol increases. This is due to the water-soluble nature of PEG-6000. As the concentration of PEG increases, the matrix becomes more permeable and thereby a higher amount of drug comes out of the matrix.
Conclusions
Metoprolol tartrate microspheres were prepared successfully by the solvent evaporation method using EC and PEG-6000. It was found that particles were free flowing with the percent yield ranged from 75.2% to 87.3%, the drug content ranged from 91.2% to 95.7%, and the average particle size ranged from 73 to 85 μm. FT-IR and DSC studies indicated that there was no incompatibility of metoprolol tartrate with the polymers, EC, and PEG-6000. The in vitro studies revealed extended release of drug by 10 h compared with plain metoprolol. The mechanism of release was found to be diffusion rate controlled (R2 ranged from 0.9257 to 0.9789). Therefore, from these studies, it can be concluded that the prepared microspheres of metoprolol tartarte eliminate the need for multiple dosing, increasing patient compliance and decreasing the occurrence of adverse effects by providing a prolonged release of drug.
Authors’ contribution
The work presented was performed in collaboration with all the authors. VRM participated in the study’s conception and design. VRM and KD performed all the formulation development, physicochemical characterization and in vitro experiments. RA carried out the statistical analysis and figure design. All the authors participated in the interpretation of data, preparation and editing of manuscript for intellectual content. All the authors read and approved the final manuscript.
Conflict of interest
Authors declare no conflict of interest.
Acknowledgement
The authors are very thankful to Astra-IDL, Bangalore, India for their generous gift sample of metoprolol tartrate.
Funding Statement
Funding sources: None declared.
References
- 1.Siepmann J, Lecomte F, Bodmeier R: Diffusion-controlled drug delivery systems: Calculation of the required composition to achieve desired release profile. J Control Rel 60, 379–389 (1999) [DOI] [PubMed] [Google Scholar]
- 2.Jayakrishnan A, Latha MS. (2004): Biodegradable polymeric microspheres as drug carriers. In: Controlled Novel Drug Delivery Systems, ed Jain NK, CBS Publishers, New Delhi, pp. 236–242 [Google Scholar]
- 3.McGinity JW, O’Donnell PB: Preparation of microspheres by the solvent evaporation technique. Adv Drug Deliv Rev 13, 25–42 (1997) [DOI] [PubMed] [Google Scholar]
- 4.Arica B, Kas HS, Orman MN, Hincal AA: Biodegradable bromocryptine mesylate microspheres prepared by a solvent evaporation technique. I: Evaluation of formulation variables on microspheres characteristics for brain delivery. J Microencapsul 19, 473–484 (2002) [DOI] [PubMed] [Google Scholar]
- 5.Sato T, Kanke M, Schroeder HG, DeLuca PP: Porous biodegradable microspheres for controlling drug delivery; assessment, processing conditions and solvent removal techniques. Pharm Res 5, 21–30 (1988) [DOI] [PubMed] [Google Scholar]
- 6.Dhawan S, Singla AK: Nifedipine loaded chitosan microspheres prepared by emulsification phase-separation. Biotech Histochem 78, 243–254 (2003) [PubMed] [Google Scholar]
- 7.Thakkara H, Rakesh KS, Anil KM, Krishna C, Murthy RSR: Albumin microspheres as carriers for the anti-arthritic drug celecoxib. AAPS Pharm Sci Technol 25, E65–E73 (2004) [Google Scholar]
- 8.Wang FJ, Wang CH: Effects of fabrication conditions on the characteristics of etanidazole spray-dried microspheres. J Microencaps 19, 495–510 (2002) [DOI] [PubMed] [Google Scholar]
- 9.Murali Mohan Babu GV, Himasankar K, Narayan CPS, Ramana Murthy KV: Controlled release of diclofenac sodium by gum karaya-chitosan complex coacervate: In vivo evaluation. India J Pharm Sci 63, 408–412 (2001) [Google Scholar]
- 10.Nevin C, Nurhan E, Ali T: The preparation and evaluation of salbutamol sulphate containing poly(lactic acid-coglycolic acid) microspheres with factorial design based studies. Int J Pharm 136, 89–100 (1996) [Google Scholar]
- 11.Costa P, Sousa Lobo JM: Modeling and comparison of dissolution profiles. Eur J Pharm Sci 13, 123–133 (2001) [DOI] [PubMed] [Google Scholar]
- 12.Ramazani F, Chen W, Van Nostrum CF, Storm G, Kiessling F, Lammers T, Hennink WE, Kok RJ: Formulation and characterization of microspheres loaded with imatinib for sustained delivery. Int J Pharm 482, 123–130 (2015) [DOI] [PubMed] [Google Scholar]
- 13.Fentie M, Belete A, Mariam TG: Formulation of sustained release floating microspheres of furosemide from ethylcellulose and hydroxypropyl methylcellulose polymer blends. J Nanomed Nanotechnol 6, 262 (2015) [Google Scholar]
- 14.Raizaday A, Yadav HKS, Jayanth A, Kaushi SR, Mathew M, Zachariah AB: Formulation and evaluation of pH sensitive microspheres of N-succinyl chitosan for the treatment of diverticulitis. Cellulose Chem Technol 49, 41–50 (2015) [Google Scholar]


