Abstract
Among the greatest advances in biology today are the discoveries of various roles played by RNA in biological processes. However, despite significant advances in RNA structure determination using X-ray crystallography [1] and solution NMR [2–4], the number of bona fide RNA structures is very limited, in comparison with the growing number of known functional RNAs. This is because of great difficulty in growing crystals or/and obtaining phase information, and severe size constraints on structure determination by solution NMR spectroscopy. Clearly, there is an acute need for new methodologies for RNA structure determination. The prevailing approach for structure determination of RNA in solution is a “bottom-up” approach that was basically transplanted from the approach used for determining protein structures, despite vast differences in both structural features and chemical compositions between these two types of biomacromolecules. In this chapter, we describe a new method, which has been reported recently, for rapid global structure determination of RNAs using solution-based NMR spectroscopy and small-angle X-ray scattering. The method treats duplexes as major building blocks of RNA structures. By determining the global orientations of the duplexes and the overall shape, the global structure of an RNA can be constructed and further regularized using Xplor-NIH. The utility of the method was demonstrated in global structure determination of two RNAs, a 71-nt and 102-nt RNAs with an estimated backbone RMSD ~3.0 Å. The global structure opens door to high-resolution structure determination in solution.
Keywords: RNA global structure in solution, SAXS, NMR, New methods
1. Introduction
Significant progress has been made towards determination of RNA three-dimensional structures in both X-ray crystallography [1] and solution NMR spectroscopy [2,3]. Moreover, a significant gain of insight into the motional behaviors of RNA in solution has recently been reported [5,6]. Nevertheless, determination of three-dimensional structures of RNA is still a daunting task. The prevailing approach for structure determination of RNA in solution is a “bottom-up” method, similar to that used for determining protein structures [7], despite vast differences between these two types of biomacromolecules in both structural features and chemical compositions. This “bottom-up” approach requires complete or nearly complete assignments of chemical shifts of protons and heteronuclei. While this approach works well for relatively small RNA molecules of simple folds, it is practically not applicable for RNAs with sizes larger than 50–60 nucleotides (nts). This is because RNA is made of only four different structural building units, A, U, G, and C, as compared with twenty amino acids for proteins. These building units all share the same sugar-phosphate moiety and differ only in the nucleic base structures. These high structural similarities lead to similar chemical shift environments for nuclei and thus, a very narrow chemical shift dispersion and significant overlap in NMR signals. To overcome these difficulties, selective use of one or two fully labeled nucleotide types [8–10], or use of partially deuterated nucleotides [11], or/and segmental labeling scheme [8,9,12], have been utilized. Nevertheless, effeteness of these approaches is modest due to some practical limitations. It is therefore still extremely difficult, if not impossible, to extract sufficient structural information to construct global structures of mid- and large-size RNAs [9,12]. Consequently, the current “bottom-up” approach has limited success in structure determination of RNAs with length greater than 50 nts. We present in this chapter a “top-down” approach, where we use global shape and duplex orientation restraints to determine global structures of RNA suing small-angle X-ray scattering (SAXS) and residual dipolar couplings measurements.
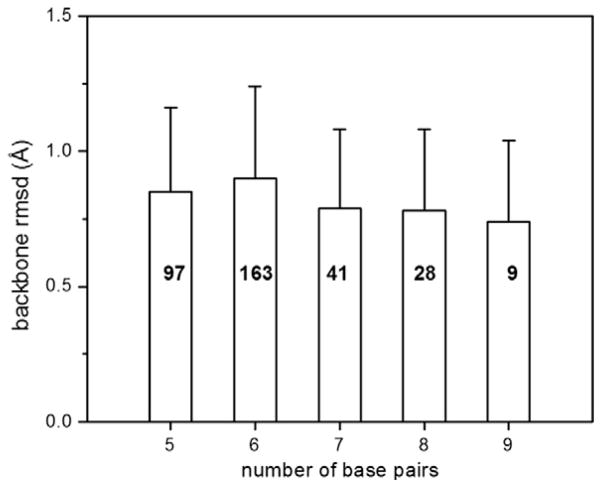
A survey of RNA X-ray crystal structures with resolution better than 3.0 Å in the Protein Data Bank reveals that A-form like duplexes are the most predominant building blocks in RNA structures, and the A-form conformation is very conserved [13] (Fig. 1). The other A-form structural parameters also are very similar, except for the basepair tilt, which heavily depends on the basepair types [13]. Thus, RNA duplexes, or stems, as depicted in a secondary structure, can be treated as A-form like and can be generated from RNA databases as initial structures with an acceptable accuracy in the early stage of structure determination [13]. As a result, the question of determining the global architecture of an RNA molecule made of mostly duplexes is reduced to twofold: (a) the relative positions of the duplexes in a global sense; and (b) the orientation of the polar angles (Φ, Θ and phases ρ (the rotation of duplex around the helical axis) of the duplexes. Once the global relative positions, orientations, and phases of these duplexes are determined, the approximate global structure of the RNA molecule is determined.
Fig. 1.
The backbone rmsds of A-form RNA duplex motifs in crystal structures with resolution better than 3.0 Å in the protein data bank. The total occurrences of each length A-form tract are labeled on the histogram bars and the standard deviations are marked on the top.
The use of small-angle X-ray scattering (SAXS) to derive the global shape of an RNA molecule has been previously reported [14]. The molecular envelope that is derived from SAXS provides an outline of an RNA molecular surface analogous to that of a cryo-EM image and is useful in defining the approximate relative positions of the building blocks. On the other hand, the relative orientation of a duplex can be determined from the residual dipolar coupling (RDC) structural correlation [15] and has been combined with the global shape information from SAXS and covalent linkages to derive global architectures of RNA molecules [16]. Bax and colleagues have reported use of SAXS and RDCs to refine a homologous tRNA structure [17].
2. Theory
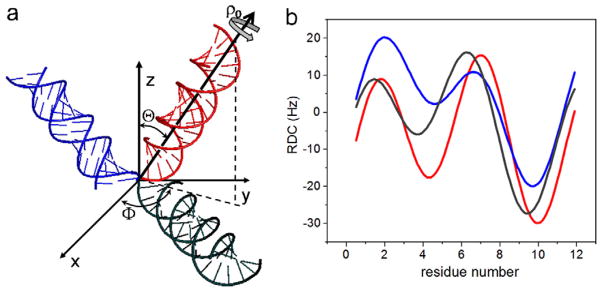
The RDC of spin pairs in a repetitive and periodical structure is wave-like when it is plotted against the residue numbers. This wave is called a dipolar wave, the RDC wave, or, more explicitly, the RDC–structure periodicity correlation. It was first reported for α-helices in proteins [18], then later for duplexes for RNA molecules [15]. The shape of an RDC wave depends on the orientation of the repetitive and periodical structure relative to a reference axis (Fig. 2). Therefore, the RDC wave is used to extract the orientation information of periodical structural elements [15] and has been used for protein structure determination [19,20].
Fig. 2.
The definition of duplex orientation (Θ, Φ) and rotational phase ρ0 in the cylindrical coordinate system (a), and simulated RDC-structural periodicity correlation curves (b) for duplexes in (a). The duplexes and the RDC curves are coded in the same colors.
The relationship between the RDC of an internuclear vector, DAB, and the orientation of a repetitive and periodical structural element can be explicitly expressed by Eq. (1) [15]:
| (1) |
where Ci (i = 1, 2, …, 5) are functions of (Φ, Θ, δn) and are expressed as follows [15]:
DAB can be expressed in terms of the orientation (Θ, Φ) of a structural element in the alignment tensor frame. The bond vector of the nth residue in the duplex in the spherical coordinates is given by bond length dAB, angle δn to the duplex axis, and angle ρn to the x-axis (in the x–y plane perpendicular to the helix axis). The angle ρn = (αn + ρ0) is given by the phase of the first bond vector in the duplex; ρ0, a phase offset that is characteristic of duplex periodicity; αn = 2π (n − 1)/T, n = 1, 2, 3, … where T is the period of the duplex. For an A-form RNA, T = 11. Eq. (1) has five unknown variables, Da, R, Θ, Φ, ρ0, which are derived by the best fit, using the nonlinear least squares fitting [15,13] method.
A recent report by Al-Hashimi and co-workers demonstrated that relative orientations of two-way junction with a bulge are encoded in sequence and can be predicted [49]. Although it remains to be seen that the same prediction can be made for structures with more than two-way junctions, which are complex but are more prevalent and more important in RNA architectures, it certainly underscores the importance of duplexes’ orientations in defining global architectures of RNAs.
One of limiting factors in using RDCs to derive orientation information is the fourfold degeneracy if only one independent alignment medium is available [15,21,22]. For an RNA consisting of three duplexes, the number of possible orientation combinations of the three duplexes is 16 [13]. In theory, a second non-colinear alignment medium is required to resolve ambiguity in the relative orientation of the duplex. A short-cut solution to this problem comes from SAXS, from which one can derive a global structure that contains an approximate layout of the duplexes, which can then be used to identify the correct combination of the relative orientation [13,23].
For a long time, besides being used as a low-resolution structural tool, SAXS had been considered a low information technique. This view gradually changed owing to the developments of computational methods that reconstruct three-dimensional molecular shape from SAXS data. The theories and methods for using SAXS to derive global shapes of biomacromolecules in the solution state have been described extensively in the literature [24–28]. Starting from the 1970s, Stuhrmann, Svergun and co-workers developed an ab initio method based on expanding the shape function in terms of spherical harmonics. [24,29] This semi-analytical method is very powerful for decomposing shapes that fit the SAXS profiles into a low number of spherical harmomics, but it is rather limited in the shapes that this method can handle. In the late 1990s and the early 2000s, Monte Carlo based densely packed bead model methods were developed to reconstruct the low-resolution molecular envelopes/shapes from 1D SAXS profiles [25,26,28]. The basic idea is that any structure can be approximated by a set of densely packed small beads. In principle, one can pick such a set of small beads that well represent the molecular structure and fit the SAXS profile using an exhausted search algorithm. To efficiently solve this problem, a few common strategies and efficient algorithms have been utilized in those methods. First, the search space can be approximated by the largest distance in the molecule that can be directly estimated from SAXS data. Second, efficient algorithms are chosen for bead model structure evolution, considering the abilities of sampling all possible configurations, escaping local minimal traps, and quickly reaching the vicinity of global minimal. Among the currently widely used programs, program DALAI_GA uses the genetic algorithm [26]; program DAMMIN uses the simulated annealing [28], and the program Saxs3D uses a ‘give-n-take’ algorithm [25]. Third, since SAXS profile calculation is very time-consuming, fast calculation methods are also used in all those programs, for example, multipole expansion in DAMMIN, and distance histogram in GALAI_GA and Saxs3D. Constant form factor along q is also used in all these programs. Calculations using all above programs can be done on a PC within a reasonable time period. To make the resulting bead models more physically meaningful, besides the goodness-of-fit of SAXS profile, more regularizations have been imposed in the bead model calculations, for example, extra penalties on bead model looseness and disconnectivity [28]. Options are often available in programs for more regularization if extra structural information is known, e.g., on symmetry and anisomery. Due to the intrinsic degeneracy of SAXS, multiple bead model calculations are always recommended and the most probable model should be the average of these calculated bead models (more details in later sections).
3. Experiments and procedures
3.1. Orientations of duplexes
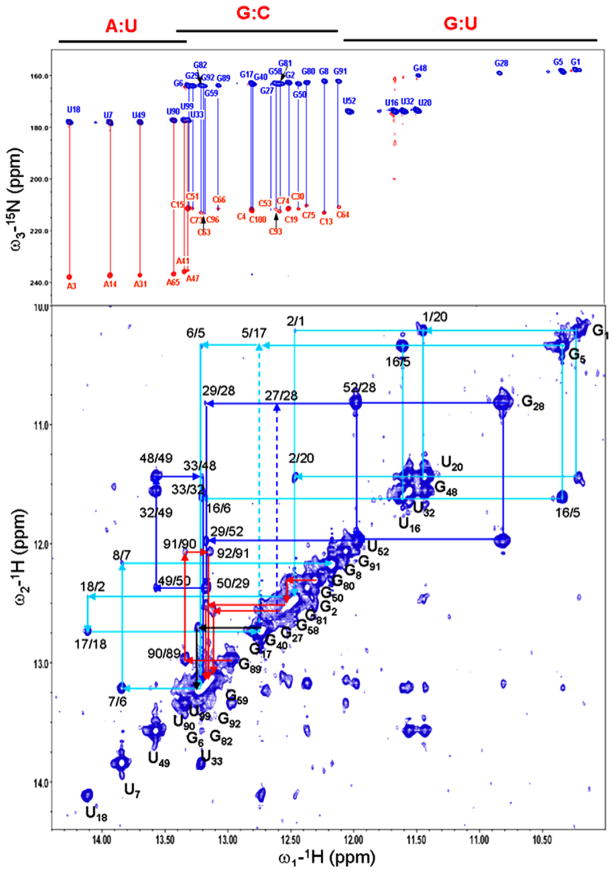
RDCs are measured in an alignment medium, mostly likely in a dilute pf1 phage solution [30]. We measured the RDCs of the imino 1H–15N spin pairs because their chemical shifts are relatively well dispersed and easy to assign using only two-dimensional (2D) spectra such the homo-nuclear nuclear Overhauser effect (NOE) spectrum and HNN-COSY [31], both of which are very sensitive even for RNA molecules that are approximately 100 nts (Fig. 3). Alternatively, one can use the ribose H1′–C1′ spin pairs for the same purpose, but assigning them may be challenging, at least at the early stage of structure determination of large RNA molecules. To determine the duplex orientation, one needs at least five RDCs per duplex. However, in practice, for an unambiguous determination, one may typically need seven to eight imino RDCs per duplex. More practically, one can fit the measured RDCs of all duplexes in an RNA molecule simultaneously under a rigid-body assumption [13,23]. An actual input file for the ORIENT program for deriving duplex orientations of the adenine-riboswitch (riboA) is given in the following [13]:
Fig. 3.
The HNN-COSY (top panel) and 2D imino NOESY (bottom panel) spectra of TCV RBSE. The NOESY spectrum was recorded at room temperature with a mixing time of 150 min. The imino walks in H1, H2, H3a, and H3b were marked in cyan, blue, red and black, respectively. The secondary structure of TCV RBSE is displayed in Figure 5a.
The last four lines of the input specify the approximate relative angles among the three duplexes, about ±180° (parallel or anti-parallel) with a range of ±30°. These approximate relative angles were obtained by the inspection of the overall shape of the RNA molecule [13].
| # filename of rdc table |
| fn_rdc = riboA_rdcs.tbl |
| # num_nt:71 |
| start_resid= 13 |
| end_resid= 83 |
| # Sequence |
| GGGAACAUAUAAUCCUAAUGAUAUGGUUUGGGAGUUUCUA |
| CCAAGAGCCUUAAACUCUUGAUUAUGUUCCC |
| # num of helices: 3 |
| # helix: 1 |
| 13 GC 83 |
| 14 GC 82 |
| 15 GC 81 |
| 16 AU 80 |
| 17 AU 79 |
| 18 CG 78 |
| 19 AU 77 |
| 20 UA 76 |
| 21 AU 75 |
| # helix: 2 |
| 25 UA 45 |
| 26 CG 44 |
| 27 CG 43 |
| 28 UG 42 |
| 29 AU 41 |
| 30 AU 40 |
| 31 UU 39 |
| # helix: 3 |
| 54 CG 72 |
| 55 AU 71 |
| 56 AU 70 |
| 57 GC 69 |
| 58 AU 68 |
| 59 GC 67 |
| # Angles between duplexes |
| 1–2 0+-30 or 180+-30 |
| 1–3 0+-30 or 180+-30 |
| 2–3 0+-30 or 180+-30 |
3.2. Initial structures of building blocks and folding
Since the backbone root-mean-square deviation (RMSD) among all duplexes surveyed in the protein databank is about 1 Å [13], which is comparable to the atomic resolution of most solution NMR structures, a logical step is to not “re-invent the wheel.” Instead, duplexes may be treated as building blocks. Therefore, the coordinates of those duplexes are generated from either the BLOCK program in the G2G toolbox [13] or a commercial program. The former generates coordinates of duplexes and well-defined hairpin loops using an existing RNA structural database [13].
The PACK program in the G2G toolbox takes in both the geometric information, such as the orientations of duplexes in terms of Θ, Φ, ρ, and overall shape, and the duplex coordinates generated from BLOCK to assemble an RNA structure in three-dimensional (3D) space. The linkers between duplexes are arbitrarily generated from the MOSAIC library in the G2G toolbox, and their conformations are restrained only by the angles between duplexes and overall shape of a molecule [13]. Alternatively, non-canonical RNA structural fragments can be generated from well-refined databases [32–34]. In addition, in a survey of RNA structures in the database, most RNA bases (about 95%) tend to be stacked sequentially in a folded state. Bases that are not stacked tend to be at or near the tip of loops or at bulges. Therefore, as an approximation, generic distance restraints are uniformly applied to all bases to maintain base-stacking interactions.
3.3. Small-angle X-ray scattering, data handling, and calculation of molecular surfaces
Detailed descriptions about procedures have been presented elsewhere [13,16,23,35]. The following discussion briefly summarizes the procedures. Obtaining an accurate scattering profile requires a meticulous matching-buffer preparation and a rigorous procedure for background subtraction. Detailed instructions for preparing scattering solution can be found on the authors’ web page: (https://ccrod.cancer.gov/confluence/display/public/Protocols). Failures in obtaining a perfect matching buffer for a sample solution will result in data that is difficult to interpret at best, and most likely not usable.
The third generation of the beamline at the Argonne National Laboratory offers unprecedented sensitivity and enables the collection of both small-angle and wide-angle X-ray scattering (SAXS and WAXS, respectively) data with a very dilute samples, about 1 mg/ml or even less. The scattering wavelength is set as 1.033 Å at 12-ID, and the scattered X-ray photons are recorded with a charge-coupled device X-ray (CCD) detector. To reduce the radiation damage, an X-ray flow cell, made of a cylindrical quartz capillary with a diameter of 1.5 mm and a wall of 10 μm, is used to flow samples. The X-ray beam size is 0.1 × 0.2 mm2 and is adjusted to pass through the center of the cell. Twenty 2D scattering images are taken for each sample or each buffer solution, and the exposure time is usually 0.5–1.0 s. The 2D scattering images of buffers and samples are reduced to one-dimensional profiles by azimuthally averaging after solid-angle correction and then normalizing with the intensity of the incident X-ray beam. The resulting 1D scattering data sets are averaged, followed by buffer background subtraction using the equation:
| (2) |
where I(q) is the scattering intensity at q, and α is the scaling factor that denotes the relative contribution from the buffer. For a quick quality check on SAXS data, α can be estimated as α ≈ 1 − cmass β/1000, where cmass is the concentration of a sample in mg/ml, and β is the partial specific volume of a solute. For nucleic acids, β is about 0.54. However, to obtain an accurate scattering profile that is solely attributed to protein and nucleic acids in solution, a more robust background subtraction procedure, which requires recording both SAXS and WAXS, is needed, as described in the next section [13,16,23,35].
The range of momentum transfer, q, for SAXS and WAXS experiments is 0.006–0.250 Å−1, and 0.1–2.6 Å−1, respectively. First, the WAXS profile is obtained using Eq. (2) by tuning the value of α so that the scattering contribution from water is subtracted, as indicated by the disappearance of the water peak at 2.0 Å−1. The resulting WAXS profile is used as a guide by tuning the value of α in the SAXS subtraction and superimposing the resulting SAXS profile onto the WAXS profile at the overlapping q range, i.e., 0.1–0.25 Å−1 in our experiments. The final scattering data are obtained by piecing the resulting SAXS and WAXS data together in the range of 0.006–2.5 Å−1.
Once an accurate scattering profile is obtained, one can use the Guinier approximation to calculate the radius of gyration (Rg) using data points in a low q range (Eq. (3)) [36],
| (3) |
The pair distance distribution function, p(r), a histogram of weighted inter-atom distance distribution in real space, can also be calculated using an indirect Fourier transform and real-space perceptual criteria based on a solid sphere in the GNOM program [37]. To avoid underestimating the molecular dimension, with the consequent distortion in low-resolution structural reconstruction, the parameter Rmax, which is the upper end of distance r, is estimated by trial and error, so that the resulting p(r) has a short, near-zero-value tail at large r.
We use the DAMMIN program [28] to obtain an approximate molecular envelope, which outlines the phosphate-sugar backbone outline of an RNA structure. Other, similar programs may generate similar results [26,38] for the same purpose. To avoid distortion caused by underestimation of Dmax, the Rmax is usually set to be 10–20 Å greater than Dmax. We have found that the “jagged” mode in DAMMIN yields dummy atoms that are sufficient for resolving the position of RNA duplexes for middle-sized molecules, and is less computationally demanding than “slow” mode. Multiple independent DAMMIN runs are performed, and the resulting bead models are subjected to averaging by DAMAVER [39]. This program computes the normalized spatial discrepancy (NSD) values between each pair of models. The model with the lowest average NSD with respect to the rest of models is chosen as the reference model, and the remaining models are superimposed onto the reference model using SUPCOMB [40], except that possible outliers, as identified by NSD criteria, are discarded. The dummy atoms of these superimposed models are remapped onto a densely packed grid of atoms, and each grid point is marked with its occupancy factor. The grids with non-zero occupancies were chosen to generate a final consensus model with the volume equal to the average excluded volume of all the models. We use scattering data in a q range of 0.006–0.33 Å−1, which reflects the global shape, for the DAMMIN calculations.
4. Practical examples
4.1. The global structure of riboA
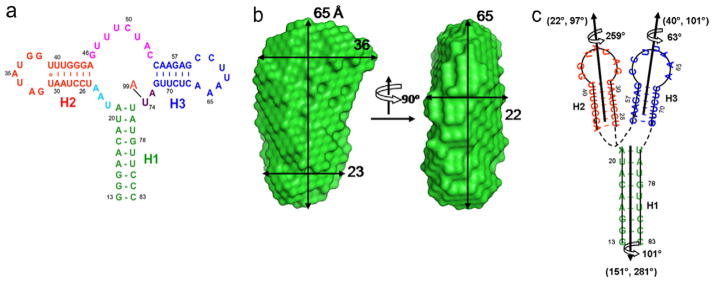
It is clear that sequences in both the 5′ and 3′ untranslated regions (UTRs) of mRNAs play important roles in regulating gene expression [41,42]. Many of these sequences consist of cis-acting structural elements. The adenine-riboswitch RNA modulates the expression of associated genes in response to elevated concentrations of cellular metabolite adenine [43]. In addition to its importance in biology, the 71-nt riboA RNA was selected to test the method because of its excellent solution behavior in an NMR tube, its near-tRNA size, and its relative complex fold. The X-ray crystal structure, with a slightly different sequence, has been reported [44]. The secondary structure of the riboA RNA, shown in Fig. 4a, consists of three duplexes: 9, 7, and 6 basepairs (bps) in duplexes 1, 2, and 3 (H1, H2, and H3), respectively. They are connected by three short linkers, 3, 7, and 2 nt between H1 and H2, H2 and H3, and H3 and H1, respectively. The 2D homo-nuclear NOESY and HNN-COSY spectra were sufficient to assign imino signals of this 71-nt RNA [13] as well as a 102-nt RNA (see the next section) [23].
Fig. 4.
The secondary structure (a), two views of the SAXS-derived molecular envelope (b), and the two-dimensional topological drawing (c) of riboA. In (a), A99 denotes the adenine ligand. In (b), dimensional lengths are in angstroms. In (c), the nucleotide residues are coded in same color as in (a) and the orientations and phases (Θ, Φ, ρ0) of the duplexes are obtained from the best simultaneous RDC fit, given alongside the duplexes.
It becomes clear almost immediately that, based on the dimension of the molecular envelope, the three duplexes are approximately packed either parallel or anti-parallel to each other (Fig. 4b) [13]. Further analysis of the duplexes’ orientations, which are discrete and constrained by covalent linkage and steric hindrance, supports the roughly parallel or anti-parallel arrangement [13]. Moreover, the exact relative orientations and the phases of the three duplexes, which were extracted from fits, led to the topology of riboA (Fig. 4c) [13]. The 3D coordinates were built based on the topology and building blocks from the MOSAIC library in the G2G toolbox and refined using a hybrid simulated annealing and rigid-body refinement protocol and Xplor-NIH [13,16].
It is possible to estimate the approximate RMSD of the G2G structure relative to the “true” structure using the following empirical formula:
| (4) |
where α is the possible RMSD between the “true” and the database-derived duplex structures in the context of the structure; β is the possible RMSD between the “true” and the G2G structures of non-canonical regions, such as long linkers and underdetermined loops; Pduplex is the percentage of duplex residues in the RNA. In A-form-like duplexes, α of an individual duplex is well below 2.0 Å among all duplexes surveyed in crystal structures with 3.0 Å or better resolution in the PDB database [13]. The value of β can vary significantly, depending on the length of non-duplex regions, such as linkers and loops. In the riboA case, duplexes make up more than 60% of the total residues, and the linkers between H1 and H2, and H2 and H3 are relatively short; the overall RMSD between the G2G and the “true” structure is estimated to be about 3.3 Å or better, assuming α and β are about 2.5 and 4.0 Å, respectively, for duplexes and the long linker/loops.
4.2. The global structure of a 102-nt ribosome-binding structural element
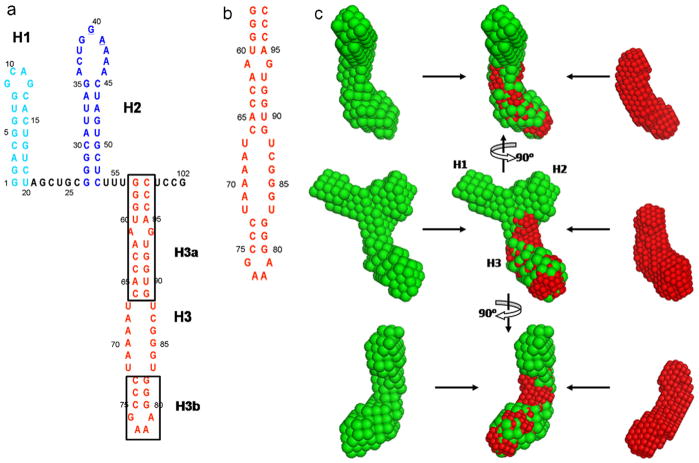
The 3′UTR RNA in turnip crinkle virus (TCV) genomic RNA plays an important role in recruiting the large ribosome subunit and enhances translation initiation [45]. Computational as well as multiple experimental evidence suggest the existence of a structural element that plays a key role in the recognition of the large ribosome subunit [45,46]. The minimum functional size of this ribosome-binding structural element (RBSE) is about 100 nt [23,45] (Fig. 5a), which is well beyond the limit of the conventional solution NMR method but serves as a good test case for the G2G method.
Fig. 5.
The secondary structures of the TCV RBSE (a) and construct H3 (b), and overlays of SAXS envelopes of RBSE (green) with H3 (red) (c).
The secondary structure of the RBSE RNA, shown in Fig. 5a, consists of three hairpins and potentially a pseudoknot [46]. The global shape of the 102-nt RBSE RNA, which was derived from SAXS data, clearly shows the overall structural arrangement. In order to assign the location of each hairpin in the molecular envelope, a series of truncation and extension constructs of the RNA were made [23]. One such construct, the H3 hairpin with an internal loop, was made to assign the location of the H3 hairpin (Fig. 5b). Based on its overall shape, the lower part of the bead model of RBSE is remarkably similar to the lower part of the isolated H3 construct and was therefore assigned to H3 (Fig. 5c).
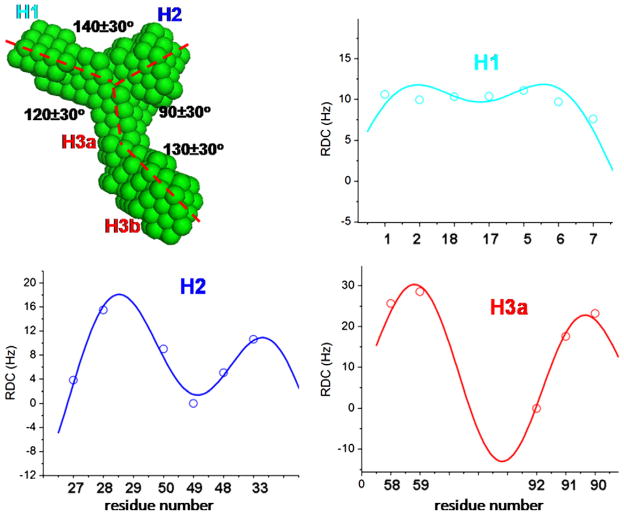
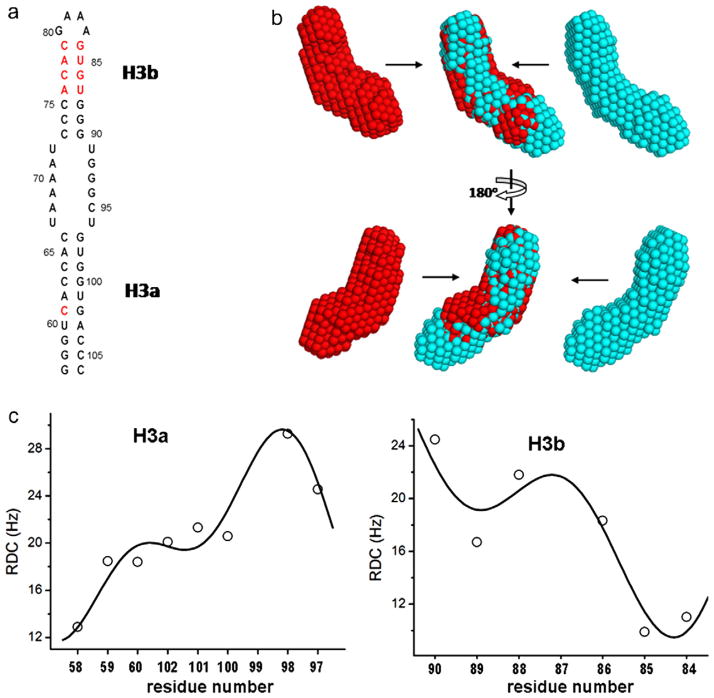
The orientations and phases of the RBSE duplexes were derived from a simultaneous fit to all RDC data (Fig. 6). Neither the orientations and phase for H3b nor the bend in H3 could be determined with the wild-type sequence because the 3 bps of the stem in H3b are too short. Therefore, we made another construct, H3e, which had the stem extended by another four bps, and the fit to the RDCs yielded the relative orientation and phases, together with the bend angle of H3. It is noteworthy to point out that the overall shapes of H3 without or with the extended stem are very similar, except for that the latter is slightly longer (Fig. 7). Furthermore, in order to determine the bend angle with an independent method, we attempted to obtain a second independent alignment tensor using a polyethylene–glycol (PEG) alignment medium but found that the H3 and H3e alignments in PEG are collinear to those in pf1, consistent with previous reports by Butcher’s [47] and Pardi’s [48] groups. The latter group has also explored several alignment media for RNA and concluded that all external alignment media used for RNA gave a similar alignment tensor and therefore do not resolve orientation degeneracy [48]. The difficulty in finding an alignment medium that gives an independent alignment tensor underscores the importance of the SAXS-aided orientation determination using the RDC–structure periodicity correlation.
Fig. 6.
The dimensional measurements on the TCV RBSE SAXS envelope, and the RDC-structural periodicity correlation fits for segments H1, H2 and H3a. The orientations and phases, (Θ, Φ, ρ0), of these duplexes obtained from the best fit were (139°, 90°, 270°), (44°, 290°, 67°) and (37°, 39°, 221°) for H1, H2 and H3a, respectively. The angles between H1 and H2, H1 and H3a, and H2 and H3a calculated from the (Θ, Φ) values are 167°, 111°and 65°, respectively, in good agreements with those directly estimated from the SAXS molecular envelope.
Fig. 7.
The secondary structure (a), SAXS molecular envelope (b) and RDC-periodicity correlation fits (c) of H3e, an extended construct of H3. In (a), four inserted basepairs and a mutation, A61 to C61, compared to H3, are marked in red. In (b), two views of the SAXS molecular envelope of H3e (cyan) and the overlays with that of H3 are displayed. In (c), the best simultaneous fit yields that the orientations and phases of H3a and H3b are (6°, 57°, 307°) and (16°, 256°, 180°), respectively, and an angle between H3a and H3b is 158°.
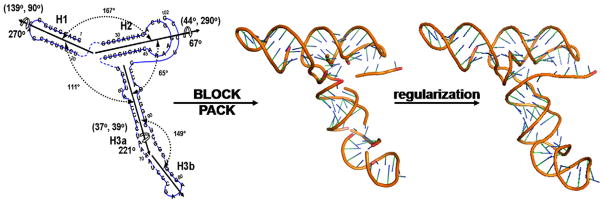
The information of relative orientations and phases of duplexes, together with the global shape, resulted in the topological arrangement of the hairpins in the RBSE RNA (Fig. 8, left). The 3D coordinates were readily built using building blocks in the MOSAIC library (Fig. 8, middle). These coordinates were further regularized to correct the covalent geometry of the structure and refined with a hybrid simulated annealing (SA) refinement protocol to yield an ensemble of refined global structures [23] (Fig. 8, right).
Fig. 8.
A two-dimensional topology drawing (left) of TCV RBSE, the initial structure (middle) generated with the G2G toolkit, and the structure after regularization that fixes the bond breaks (right) using Xplor-NIH. The orientations and phases in terms of (Θ, Φ, ρ0) of H1, H2 and H3a, obtained from the best simultaneous fit, are given in the figure. The linker residues are represented with broken lines in the topology drawing (left) and residue numbers are drawn on the regularized structure (right).
4.3. Rapid determination of global arrangement of RNA:RNA complexes
Defining the interface and the global structure of multicomponent systems presents an important problem in the quest for understanding biological interactions on a molecular level. However, identifying such molecular interfaces using a solution-based method, such as NMR, is a challenging task. A conventional and widely used protocol is to use isotope-labeled and non-labeled mixed samples and apply NMR isotope-filter experiments [49–52]. Even with this protocol, global structures are often underdetermined due to a general lack of experimentally measured NMR-derived restraints that define the overall dimensionalities and shapes of biomacromolecules and complexes in solution. This problem is more daunting for structure determination of RNA or RNA:RNA complexes because the number of protons per molecular weight is much lower than that in the protein counterpart; the structures generally tend to be elongated; and there are fewer options in selective-labeling sample preparation schemes. Moreover, isotope-filter/edited NOE experiments in general are rather insensitive, and assigning those NOEs is often challenging and time-consuming.
Since SAXS contains information about the global shape, it can, in theory, be utilized for global architecture determination of complexes. However, multiple shapes may correspond with similar SAXS profiles within experimental error and this may be a reason for its limited general application for this purpose previously. This degeneracy problem is dramatically reduced if discrete possible relative orientations of two subunits are known and SAXS is utilized to identify one correct global architecture among only three or four possibilities for homo- or hetero-dimeric complexes. The discrete possible orientations are determined from RDCs and subunit coordinates [22,35,53]. Consequently, a global architecture and thus the implicit interface of complexes can be determined without NOE distance restraints. We have applied this method for global structure determination to a 30 kDa homodimeric tetraloop–receptor RNA complex [16], which is a common RNA tertiary structural motif involved in helical packing [54]. This method was also later developed systematically and implemented in an automated program, GASR (derive Global Architecture from SAXS and RDCs) [35], which is applicable for both protein complexes and RNA:RNA complexes. The procedure for this method is straightforward, as briefly described in the following discussion.
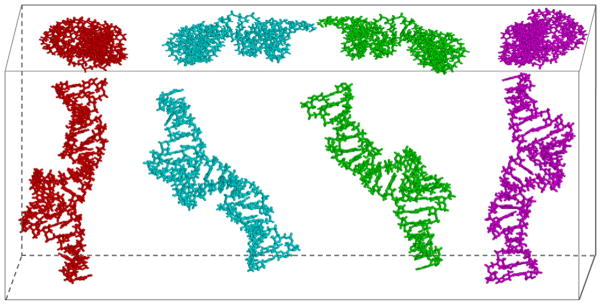
Given a set of RDCs and subunit coordinates as input, GASR calculates the discrete orientations of subunits. For a hetero-dimeric complex, there are four satisfying discrete orientations for each subunit and four unique orientation combinations. For a homodimer with a C2-axial symmetry, the orientations of the two subunits are related to each other within four possible choices (Fig. 9), and there are only three unique orientation combinations [22,55–57]. GASR performs a grid search in the following fashion: the orientation of subunit 1 is fixed, while subunit 2 can be any one of the other three (a homodimeric complex with a C2-axial symmetry) or four (a hetero-dimeric complex) orientations. The vector drawn from the center of subunit 1 to the center of subunit 2 in a molecular frame is used for the SAXS-restrained grid search in a spherical coordinate system, with 0 ≤ θ ≤ 180°, 0 ≤ Φ ≤ 360° and r depending on the shape and the distance between two subunits (Fig. 10). The grid size for both θ and Φ is initially set as 10°, and the grid size for r was initially set 2 Å; these settings are reduced to 1° for θ, Φ, and 1 Å for r, respectively after the approximate position of the interface is found [16,35]. The search for (r, θ, Φ) must also satisfy the conditions on Rg, Rmax, and Rmin, where Rmax and Rmin are the maximum and minimum distances, respectively, between the furthest atom pairs in the complex (i.e., the edges of the two subunits) [16,35]. The correct structures were selected according to a scoring function defined as follows:
| (5) |
where Iexp(q) and Ical(q) are the experimental and the back-calculated scattering intensity at a given transfer momentum q, c is a constant scaling factor, and N is the number of data points.
Fig. 9.
The front view (lower panel) and the top view (upper panel) of the four discrete orientations extracted from a set of RDC data for the subunit of the tetraloop-receptor RNA homodimer.
Fig. 10.
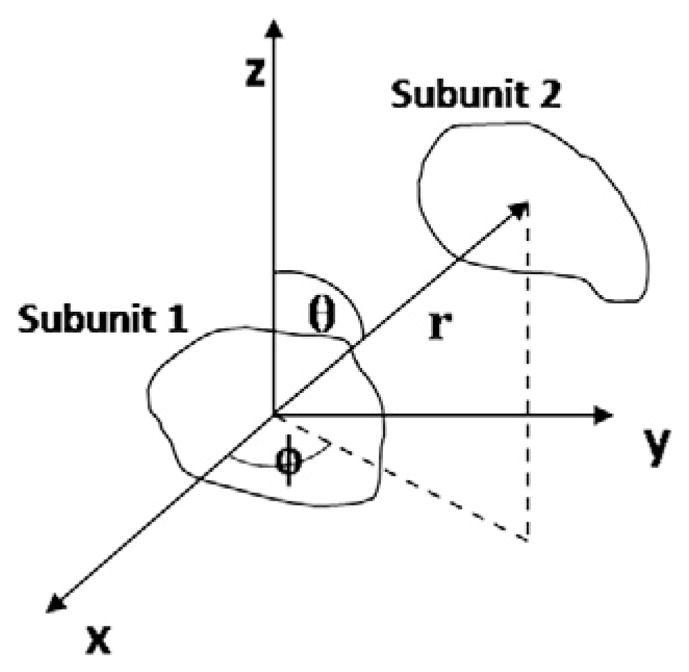
Illustration of spatial search used in the GASR program for a two-subunit system in a spherical polar axis system (θ, Φ, r).
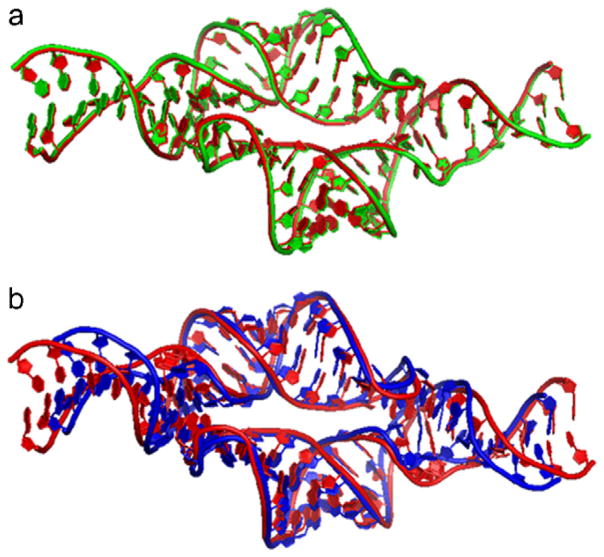
The method has successfully been applied to determine the global architecture of the tetraloop–receptor complex [16] and more extensively tested in protein systems [35]. The RMSD between the rigid-body SAXS-defined dimer and the dimer refined by the intermolecular NMR distance restraints is ~0.4 Å (Fig. 11a), indicating the closeness of the two structures. The global structure-defined interfaces are almost identical, such as potential hydrogen bonds and base-stacking, to that of the previously reported [4,58]. It is noteworthy that the SAXS-refined structure is significantly shorter than that refined without SAXS (Fig. 11b) and RMSD between these two structures is 3.2 Å [16], underscoring the importance of including SAXS to achieve a more accurate global structure.
Fig. 11.
The superimpositions of the tetraloop-receptor homodimeric structures obtained with various data restraints. The red structures in (a) and (b) are identical, refined with 36×2 inter-subunit distance and hydrogen bond restraints (pdb id: 2jyj). The green structure in (a) was obtained using GASR method with SAXS data without inter-subunit NOEs (pdb id: 2jyh). The blue structure in (b) was refined with both SAXS and the inter-subunit NOE restraints (pdb id: 2jyf).
In general, the success of the method depends on several factors, including: the shape of the subunits (elongated and highly asymmetrical are preferred); the quality of the initial subunit structures that are determined in the context of the dimer without the benefit of SAXS data; the equilibrium between monomers and complex in solution; and the quality of experimental RDC and SAXS data. In the case of the tetraloop–receptor complex, the RMSD between the non-SAXS-refined and SAXS-refined structures is 3.2 Å, and the search engine was able to identify the correct orientation for subunit 2 using the SAXS data. In practice, information about the interacting residues from the two subunits at an interface may be available from biochemical studies and may be utilized to aid the SAXS-based orientation search.
4.4. Outline of the global architecture of an RNA:RNA complex using X-ray scattering
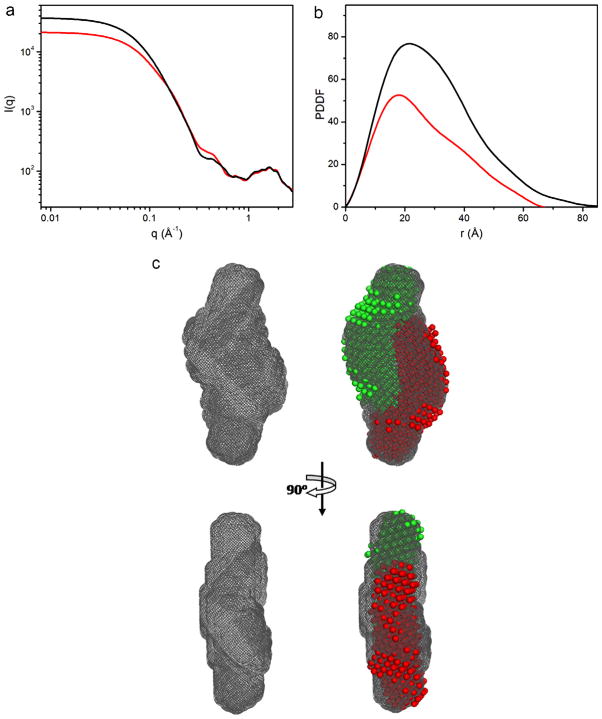
Often a targeted molecule forms a dimeric species under a particular solution condition. It would be optimal if one could rapidly obtain the approximate global architecture and possible contact interface prior to a full structure determination. Because nucleic acids are usually elongated, it is possible to outline the global architecture of a complex and even an interface in favorable cases, as illustrated in the following example. The H3 hairpin in the TCV RBSE (Fig. 5b) exists in either monomer or dimer state, depending on Mg2+/EDTA concentration. At 4 mM or higher Mg2+ concentration, H3 forms a dimer. The questions, then, are [1] whether the dimer is a base-pair-swapped dimer that altered the monomer’s secondary structure, or the dimer is organized with two independently folded monomers; and [2] what the approximate global structure of the dimer looks like. These two questions can be addressed using SAXS data.
The fingerprint regions in WAXS (q ≥ 1.0 Å−1) (Fig. 11a), which is indicative and sensitive to changes in secondary structure [59], remains the same in solutions without or with Mg2+, suggesting that the secondary structures in the monomer and the dimer remain the same, therefore, the dimer is not base-pair-swapped dimer. H3 contains a GAAA tetraloop, which interacts with an A-form minor groove via an “A-minor” motif [54,60–62]. Therefore, a series of dimer structures was modeled to generate a dimer structure that best fits to the SAXS profile, recoded at present, of 4 mM MgCl2 (Fig. 12). The model generated in such a fashion can be used as initial coordinates for a full structure determination.
Fig. 12.
Outline of the global shape of an RNA:RNA complex of an unknown structure. (a) experimental SAXS profiles of the H3 hairpin with 4 mMg2+ (black) and without Mg2+ in solution. (b) the pair-distance-distribution function that were calculated using the data shown in (a). (c) the overall shape of the dimeric H3 hairpin complex (left) and the superimposed the shapes of the two monomer subunits (red and green bead models) to the dimeric shape (grey).
5. Conclusion
The approximate global structure determined using the “top-down” approach and global shape and orientation restraints that are derived from experimental SAXS and RDC measurements, makes it practically possible to elucidate intricate tertiary interactions among residues at junctions thus eventually higher resolution structures of RNAs in solution. Such a higher resolution structure can realistically be determined using solution NMR without a prerequisite knowledge of chemical shift assignments by employing a robust probability assignment strategy for NOE analysis [63–65] and knowledge of a global structure. The probabilistic assignment strategy has been successfully demonstrated in determining structures of small protein cases even without knowledge of global structures [63,64]. The work towards high-resolution structures of RNAs without prior knowledge of chemical shift assignments is well under way in authors’ laboratory. Therefore, we expect in the near future, the top-down approach, together with the using the probabilistic analysis of NOE spectra, will become the one of methods of choice for determining high-resolution structures of large RNAs in solution.
References
- 1.Ferre-D’Amare AR, Doudna JA. Methods to crystallize RNA. In: Beaucage Serge L, et al., editors. Current Protocols in Nucleic Acid Chemistry. Unit 7–6. Chapter 7. [DOI] [PubMed] [Google Scholar]
- 2.Singh M, Gonzales FA, Cascio D, Heckmann N, Chanfreau G, Feigon J. J Biol Chem. 2009;284:1906–1916. doi: 10.1074/jbc.M807337200. [DOI] [PMC free article] [PubMed] [Google Scholar]
- 3.Kim NK, Zhang Q, Zhou J, Theimer CA, Peterson RD, Feigon J. J Mol Biol. 2008;384:1249–1261. doi: 10.1016/j.jmb.2008.10.005. [DOI] [PMC free article] [PubMed] [Google Scholar]
- 4.Davis JH, Tonelli M, Scott LG, Jaeger L, Williamson JR, Butcher SE. J Mol Biol. 2005;351:371–382. doi: 10.1016/j.jmb.2005.05.069. [DOI] [PubMed] [Google Scholar]
- 5.Zhang Q, Stelzer AC, Fisher CK, Al-Hashimi HM. Nature. 2007;450:1263–1267. doi: 10.1038/nature06389. [DOI] [PubMed] [Google Scholar]
- 6.Zhang Q, Sun X, Watt ED, Al-Hashimi HM. Science. 2006;311:653–656. doi: 10.1126/science.1119488. [DOI] [PubMed] [Google Scholar]
- 7.Wüthrich K. NMR of Proteins and Nucleic Acids. John Wiley & Sons; New York: 1986. [Google Scholar]
- 8.Kim I, Lukavsky PJ, Puglisi JD. J Am Chem Soc. 2002;124:9338–9339. doi: 10.1021/ja026647w. [DOI] [PubMed] [Google Scholar]
- 9.Lukavsky PJ, Kim I, Otto GA, Puglisi JD. Nat Struct Biol. 2003;10:1033–1038. doi: 10.1038/nsb1004. [DOI] [PubMed] [Google Scholar]
- 10.Wu H, Feigon J. Proc Natl Acad Sci USA. 2007;104:6655–6660. doi: 10.1073/pnas.0701534104. [DOI] [PMC free article] [PubMed] [Google Scholar]
- 11.Dayie KT, Tolbert TJ, Williamson JR. J Magn Reson. 1998;130:97–101. doi: 10.1006/jmre.1997.1286. [DOI] [PubMed] [Google Scholar]
- 12.D’Souza V, Dey A, Habib D, Summers MF. J Mol Biol. 2004;337:427–442. doi: 10.1016/j.jmb.2004.01.037. [DOI] [PubMed] [Google Scholar]
- 13.Wang J, Zuo X, Yu P, Xu H, Starich MR, Tiede DM, Shapiro BA, Schwieters CD, Wang YX. J Mol Biol. 2009 doi: 10.1016/j.jmb.2009.08.001. [DOI] [PMC free article] [PubMed] [Google Scholar]
- 14.Funari SS, Rapp G, Perbandt M, Dierks K, Vallazza M, Betzel C, Erdmann VA, Svergun DI. J Biol Chem. 2000;275:31283–31288. doi: 10.1074/jbc.M004974200. [DOI] [PubMed] [Google Scholar]
- 15.Walsh JD, Cabello-Villegas J, Wang YX. J Am Chem Soc. 2004;126:1938–1939. doi: 10.1021/ja039446g. [DOI] [PubMed] [Google Scholar]
- 16.Zuo XB, Wang JB, Foster TR, Schwieters CD, Tiede DM, Butcher SE, Wang YX. J Am Chem Soc. 2008;130:3292–3293. doi: 10.1021/ja7114508. [DOI] [PubMed] [Google Scholar]
- 17.Grishaev A, Ying J, Canny MD, Pardi A, Bax A. J Biomol NMR. 2008;42:99–109. doi: 10.1007/s10858-008-9267-x. [DOI] [PMC free article] [PubMed] [Google Scholar]
- 18.Mesleh MF, Veglia G, DeSilva TM, Marassi FM, Opella SJ. J Am Chem Soc. 2002;124:4206–4207. doi: 10.1021/ja0178665. [DOI] [PMC free article] [PubMed] [Google Scholar]
- 19.Walsh JD, Wang YX. J Magn Reson. 2005;174:152–162. doi: 10.1016/j.jmr.2005.01.018. [DOI] [PubMed] [Google Scholar]
- 20.Wang J, Walsh JD, Kuszewski J, Wang YX. J Magn Reson. 2007;189:90–103. doi: 10.1016/j.jmr.2007.08.018. [DOI] [PubMed] [Google Scholar]
- 21.Hus JC, Marion D, Blackledge M. J Am Chem Soc. 2001;123:1541–1542. doi: 10.1021/ja005590f. [DOI] [PubMed] [Google Scholar]
- 22.Fowler CA, Tian F, Al-Hashimi HM, Prestegard JH. J Mol Biol. 2000;304:447–460. doi: 10.1006/jmbi.2000.4199. [DOI] [PubMed] [Google Scholar]
- 23.Zuo X, Wang J, Yu P, Eyler D, Xu H, Starich MR, Tiede DM, Simon AE, Kasprzak W, Schwieters CD, Shapiro BA, Wang YX. Proc Natl Acad Sci USA. 2010;107:1385–1390. doi: 10.1073/pnas.0908140107. [DOI] [PMC free article] [PubMed] [Google Scholar]
- 24.Svergun DI, Stuhrmann HB. Acta Crystallogr A. 1991;47:736–744. [Google Scholar]
- 25.Walther D, Cohen FE, Doniach S. J Appl Crystallogr. 2000;33:350–363. [Google Scholar]
- 26.Chacon P, Moran F, Diaz JF, Pantos E, Andreu JM. Biophys J. 1998;74:2760–2775. doi: 10.1016/S0006-3495(98)77984-6. [DOI] [PMC free article] [PubMed] [Google Scholar]
- 27.Koch MH, Vachette P, Svergun DI. Q Rev Biophys. 2003;36:147–227. doi: 10.1017/s0033583503003871. [DOI] [PubMed] [Google Scholar]
- 28.Svergun DI. Biophys J. 1999;77:2896. doi: 10.1016/S0006-3495(99)77443-6. [DOI] [PMC free article] [PubMed] [Google Scholar]
- 29.Stuhrmann HB. Acta Crystallogr. 1970;A26:297–306. [Google Scholar]
- 30.Hansen MR, Mueller L, Pardi A. Nat Struct Biol. 1998;5:1065–1074. doi: 10.1038/4176. [DOI] [PubMed] [Google Scholar]
- 31.Dingley AJ, Masse JE, Feigon J, Grzesiek S. J Biomol NMR. 2000;16:279–289. doi: 10.1023/a:1008307115641. [DOI] [PubMed] [Google Scholar]
- 32.Leontis NB, Westhof E. Curr Opin Struct Biol. 2003;13:300–308. doi: 10.1016/s0959-440x(03)00076-9. [DOI] [PubMed] [Google Scholar]
- 33.Leontis NB, Westhof E. Comp Funct Genomics. 2002;3:518–524. doi: 10.1002/cfg.213. [DOI] [PMC free article] [PubMed] [Google Scholar]
- 34.Leontis NB, Westhof E. RNA. 2001;7:499–512. doi: 10.1017/s1355838201002515. [DOI] [PMC free article] [PubMed] [Google Scholar]
- 35.Wang J, Zuo X, Yu P, Byeon IJ, Jung J, Wang X, Dyba M, Seifert S, Schwieters CD, Qin J, Gronenborn AM, Wang YX. J Am Chem Soc. 2009;131:10507–10515. doi: 10.1021/ja902528f. [DOI] [PMC free article] [PubMed] [Google Scholar]
- 36.Guinier A. Ann Phys (Paris) 1939;12:161–237. [Google Scholar]
- 37.Svergun DI. J Appl Cryst. 1992;25:495–503. [Google Scholar]
- 38.Wohnert J, Dingley AJ, Stoldt M, Gorlach M, Grzesiek S, Brown LR. Nucleic Acids Res. 1999;27:3104–3110. doi: 10.1093/nar/27.15.3104. [DOI] [PMC free article] [PubMed] [Google Scholar]
- 39.Petoukhov MV, Konarev PV, Kikhney AG, Svergun ID. Appl Cryst. 2007;40:s223–s228. [Google Scholar]
- 40.Kozin MB, Svergun DI. J Appl Cryst. 2001;34:33–41. [Google Scholar]
- 41.Mandal M, Boese B, Barrick JE, Winkler WC, Breaker RR. Cell. 2003;113:577–586. doi: 10.1016/s0092-8674(03)00391-x. [DOI] [PubMed] [Google Scholar]
- 42.Andreassi C, Riccio A. Trends Cell Biol. 2009;19:465–474. doi: 10.1016/j.tcb.2009.06.001. [DOI] [PubMed] [Google Scholar]
- 43.Mandal M, Breaker RR. Nat Struct Mol Biol. 2004;11:29–35. doi: 10.1038/nsmb710. [DOI] [PubMed] [Google Scholar]
- 44.Serganov A, Yuan YR, Pikovskaya O, Polonskaia A, Malinina L, Phan AT, Hobartner C, Micura R, Breaker RR, Patel DJ. Chem Biol. 2004;11:1729–1741. doi: 10.1016/j.chembiol.2004.11.018. [DOI] [PMC free article] [PubMed] [Google Scholar]
- 45.Stupina VA, Meskauskas A, McCormack JC, Yingling YG, Shapiro BA, Dinman JD, Simon AE. RNA. 2008;14:2379–2393. doi: 10.1261/rna.1227808. [DOI] [PMC free article] [PubMed] [Google Scholar]
- 46.McCormack JC, Yuan X, Yingling YG, Kasprzak W, Zamora RE, Shapiro BA, Simon AE. J Virol. 2008;82:8706–8720. doi: 10.1128/JVI.00416-08. [DOI] [PMC free article] [PubMed] [Google Scholar]
- 47.Reiter NJ, Blad H, Abildgaard F, Butcher SE. Biochemistry (Mosc) 2004;43:13739–13747. doi: 10.1021/bi048815y. [DOI] [PubMed] [Google Scholar]
- 48.Latham MP, Hanson P, Brown DJ, Pardi A. J Biomol NMR. 2008;40:83–94. doi: 10.1007/s10858-007-9212-4. [DOI] [PMC free article] [PubMed] [Google Scholar]
- 49.Clore GM, Appella E, Yamada M, Matsushima K, Gronenborn AM. Biochemistry. 1990;29:1689–1696. doi: 10.1021/bi00459a004. [DOI] [PubMed] [Google Scholar]
- 50.Griffey RH, Redfield AG. Q Rev Biophys. 1987;19:51–82. doi: 10.1017/s0033583500004029. [DOI] [PubMed] [Google Scholar]
- 51.Matsuo H, Shirakawa M, Kyogoku Y. J Mol Biol. 1995;254:668–680. doi: 10.1006/jmbi.1995.0646. [DOI] [PubMed] [Google Scholar]
- 52.Venters RA, Huang CC, Farmer BT, 2nd, Trolard R, Spicer LD, Fierke CA. J Biomol NMR. 1995;5:339–344. doi: 10.1007/BF00182275. [DOI] [PubMed] [Google Scholar]
- 53.Parsons LM, Grishaev A, Bax A. Biochemistry (Mosc) 2008;47:3131–3142. doi: 10.1021/bi702283x. [DOI] [PubMed] [Google Scholar]
- 54.Costa M, Michel F. EMBO J. 1995;14:1276–1285. doi: 10.1002/j.1460-2075.1995.tb07111.x. [DOI] [PMC free article] [PubMed] [Google Scholar]
- 55.Saupe A. Angew Chem, Int Ed Engl. 1968;7:97–112. [Google Scholar]
- 56.Bewley CA, Clore GM. J Am Chem Soc. 2000;122:6009–6016. [Google Scholar]
- 57.Al-Hashimi HM, Majumdar A, Gorin A, Kettani A, Skripkin E, Patel DJ. J Am Chem Soc. 2001;123:633–640. doi: 10.1021/ja003379y. [DOI] [PubMed] [Google Scholar]
- 58.Davis JH, Foster TR, Tonelli M, Butcher SE. RNA. 2007;13:76–86. doi: 10.1261/rna.268307. [DOI] [PMC free article] [PubMed] [Google Scholar]
- 59.Zuo X, Cui G, Merz KM, Jr, Zhang L, Lewis FD, Tiede DM. Proc Natl Acad Sci USA. 2006;103:3534–3539. doi: 10.1073/pnas.0600022103. [DOI] [PMC free article] [PubMed] [Google Scholar]
- 60.Nissen P, Ippolito JA, Ban N, Moore PB, Steitz TA. Proc Natl Acad Sci USA. 2001;98:4899–4903. doi: 10.1073/pnas.081082398. [DOI] [PMC free article] [PubMed] [Google Scholar]
- 61.Murray JB, Seyhan AA, Walter NG, Burke JM, Scott WG. Chem Biol. 1998;5:587–595. doi: 10.1016/s1074-5521(98)90116-8. [DOI] [PubMed] [Google Scholar]
- 62.Tanner MA, Cech TR. RNA. 1995;1:349–350. [PMC free article] [PubMed] [Google Scholar]
- 63.Eghbalnia HR, Bahrami A, Wang L, Assadi A, Markley JL. Biomol NMR. 2005;32:219–233. doi: 10.1007/s10858-005-7944-6. [DOI] [PubMed] [Google Scholar]
- 64.Grishaev A, Llinas M. J Biomol NMR. 2004;28:1–10. doi: 10.1023/B:JNMR.0000012846.56763.f7. [DOI] [PubMed] [Google Scholar]
- 65.Bahrami A, Assadi AH, Markley JL, Eghbalnia HR. PLoS Comput Biol. 2009;5:e1000307. doi: 10.1371/journal.pcbi.1000307. [DOI] [PMC free article] [PubMed] [Google Scholar]


