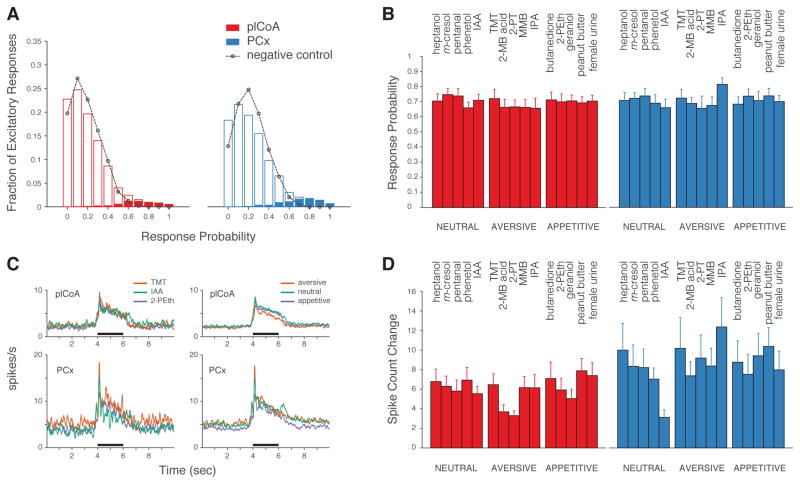
Figure 2. Similar Reliability of Odor-Evoked Responses in plCoA and PCx Regardless of Odor Identity or Valence.
A. Histogram depicting the probability of an excitatory response out of ten trials (see STAR Methods). Open bars (red = plCoA, blue = PCx) depict the fraction of cell-odor pairs with a given excitatory response probability; filled bars represent only those cell-odor pairs whose responses are considered significant by auROC analysis. Black dotted lines: distribution of false-positive responses in absence of odor presentation; note that this rate reflects the level of spontaneous activity in each brain area. B. Response probabilities for cell-odor pairs with a significant excitatory response for five neutral, aversive and appetitive odors; no significant differences were observed (three factors: valence, odor identity and area, three-way ANOVA). C. (Left) Grand averages of peri-stimulus time histograms of excitatory responses to isoamyl acetate/neutral (green), TMT/aversive (red) and 2-phenylethanol/appetitive (blue). (Right) Same as (Left) with all odors considered, grouped by valence: neutral (green), aversive (red) and appetitive (blue). Odor period (black) is demarked. D. Spike count change during presentation of five neutral, aversive and appetitive odorants for those neurons that had an excitatory response. Firing rate was not significantly modulated by the innate valence of odors (three factors: valence, odor identity and area, p<0.05 only for difference between areas, three-way ANOVA).

